
Trade The World
Stellar Price Forecast: XLM targets $0.51 as SEC vs Ripple case nears verdict
Ni Vishal Dixit
Petsa ng Pag-publish: 8 Aug 2025 | Petsa ng Pag-edit: 8 Aug 2025


POPULAR ARTICLES

Stellar (XLM) edges higher by nearly 5% at press time on Friday, building on the 10% rise from Thursday. The cross-border payment token gains momentum as the segment leader, Ripple, files for a joint dismissal with the US Securities and Exchange Commission (SEC) in the years-long legal battle.
- Stellar breaks out of a falling channel pattern, resulting in double-digit gains over the last 24 hours.
- XLM Open Interest increased by over 40%, signaling a rise in trader interest.
- SEC and Ripple file for joint dismissal of the years-long legal battle.
Stellar (XLM) edges higher by nearly 5% at press time on Friday, building on the 10% rise from Thursday. The cross-border payment token gains momentum as the segment leader, Ripple, files for a joint dismissal with the US Securities and Exchange Commission (SEC) in the years-long legal battle.
Both the technical and derivative outlook point to further gains for Stellar based on a channel breakout and a 40% surge in Open Interest.
Stellar shoots up with Ripple and SEC filing for joint dismissal
Ripple, the team behind the cross-border payment token XRP, and the US SEC filed a joint stipulation of case dismissal in the US Court of Appeals for the Second Circuit on Thursday. This has renewed the risk-on sentiment among XRP investors.
The potential conclusion for Ripple’s case has extended momentum and a sentimental boost to its competitor, Stellar, as the market narrative turns bullish. Both the XRP and XLM tokens have recorded double-digit gains in the last 24 hours, as bullish sentiment prevails.
Rising interest spikes XLM Open Interest by 40%
The rising interest in Stellar’s XLM boosts the capital inflow in its futures and options contracts as traders gain confidence. CoinGlass data shows that the XLM Open Interest has risen by nearly 40% in the last 24 hours, reaching $434.04 million.
Alongside the increased inflows, the liquidations over the same period reflect a bullish imbalance. Long liquidations remain at $351,490 while the short liquidations have surged to $1.17 million, indicating a greater wipeout of bearish positions.
The imbalance has driven the long-to-short ratio to 1.0173, pointing to a greater number of active bullish positions.
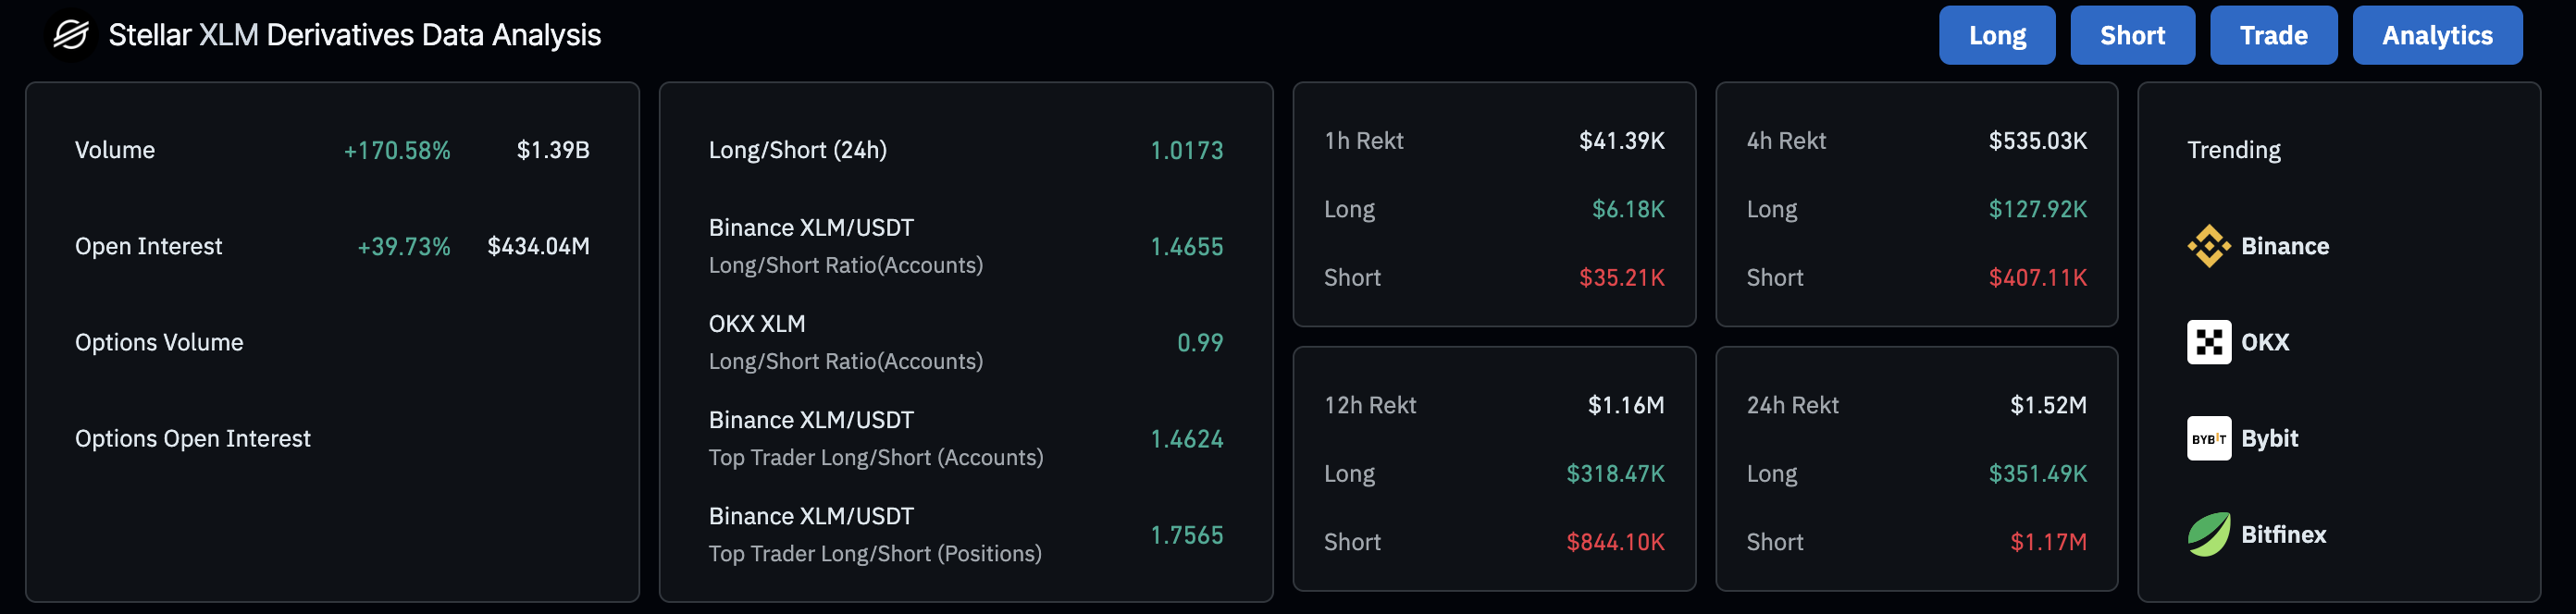
XLM derivatives data. Source: Coinglass
The increasing capital inflows, mixed with long-side in open contracts and rising XLM prices, reflect the bullish dominance likely to extend the rally.
XLM could extend its breakout rally as buying pressure increases
The ongoing recovery in XLM marked a falling channel breakout on the 4-hour chart (shared below). Stellar exceeded the 50% retracement level at $0.4389, which is drawn from $0.5166 on July 14 to $0.3613 on Sunday, with the bulls targeting the 78.6% Fibonacci level at $0.4834.
A decisive close above this level could extend the breakout rally to the $0.5166 peak. This would account for an 11% gain from the current market price.
The 50-day Exponential Moving Average (EMA) rises towards the 100-day EMA, hinting at a potential Golden Cross. This would flash a buy signal for sidelined investors as the short-term trend surpasses the longer-term trend.
The uptrending Moving Average Convergence Divergence (MACD) and its signal line indicate rising bullish momentum. Furthermore, the Relative Strength Index reads 76 as it spikes into the overbought zone, suggesting increased buying pressure.
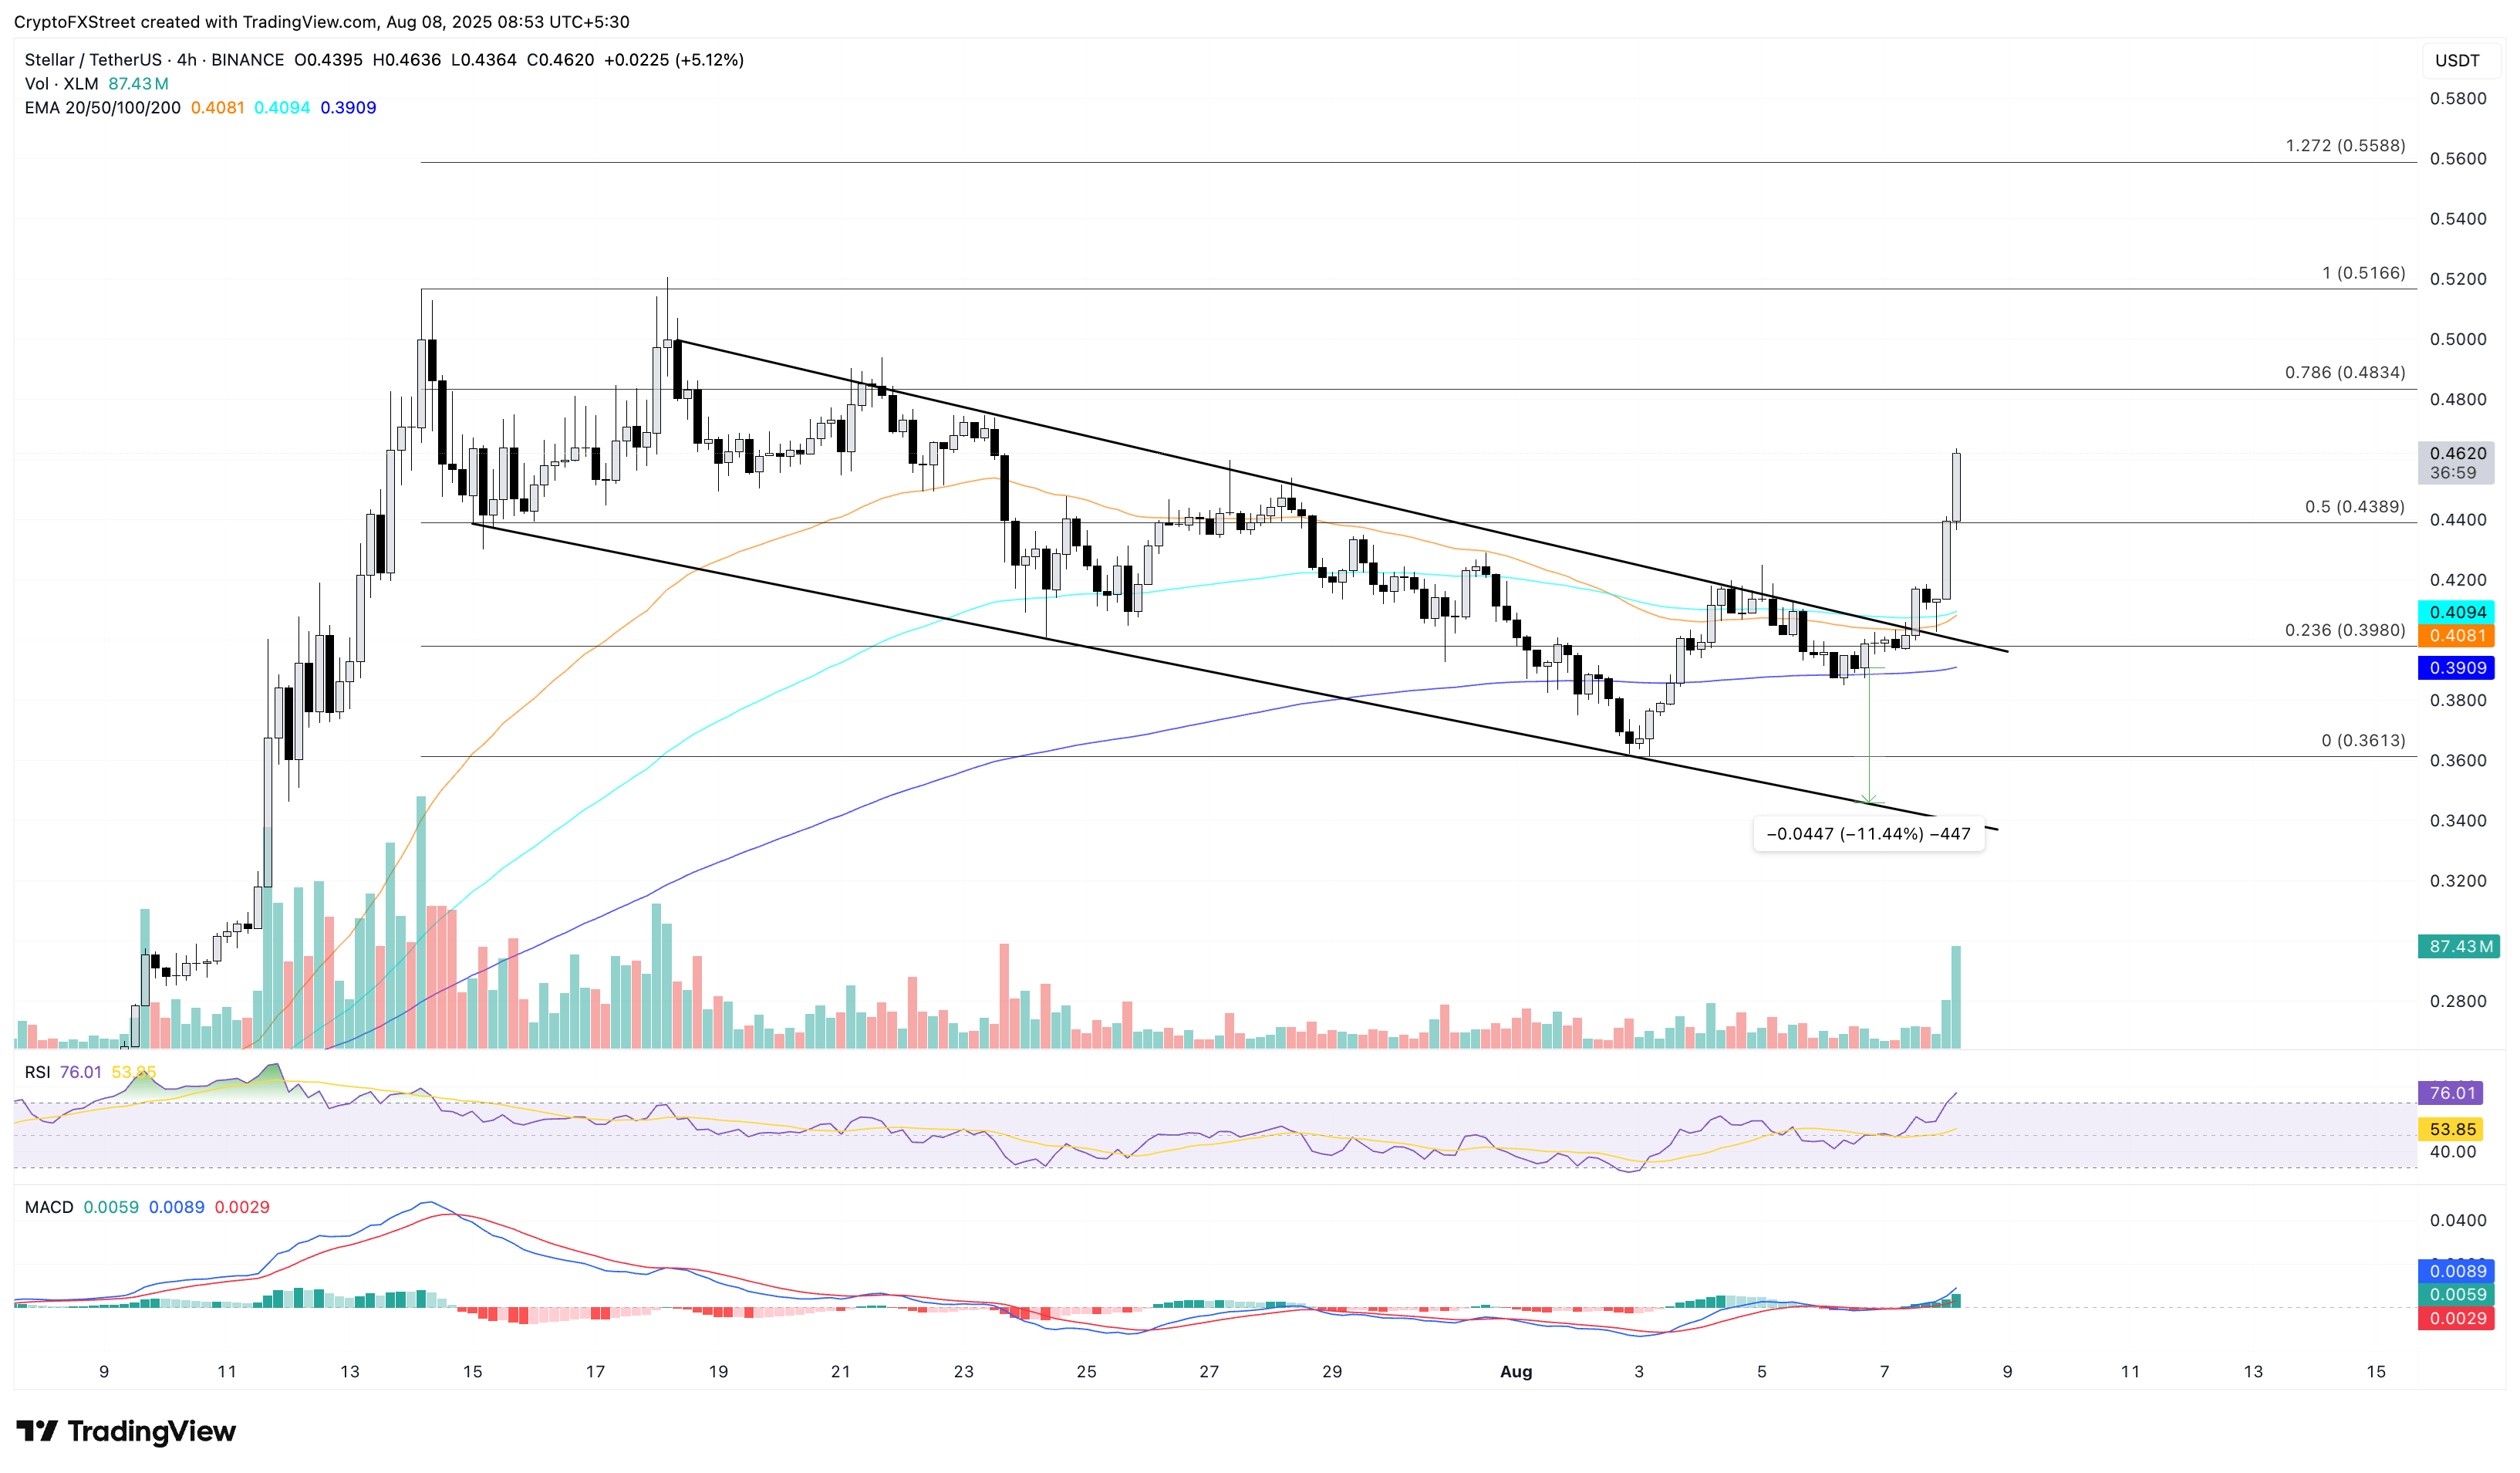
XLM/USDT daily price chart.
On the flip side, if XLM fails to uphold the uptrend, it could retest the 50% retracement level at $0.4389.

FXStreet
Higit sa isang milyong user ang umaasa sa FXStreet para sa real-time market data, charting tools, expert insights, at Forex news. Ang komprehensibong economic calendar at educational webinars nito ay tumutulong sa mga trader na manatiling may alam at gumawa ng kalkuladong mga desisyon. Sinusuportahan ang FXStreet ng humigit-kumulang 60 propesyonal sa pagitan ng Barcelona HQ at iba’t ibang rehiyon sa buong mundo.
Read More


