
Trade The World
Top 3 Price Prediction: Bitcoin, Ethereum, Ripple – BTC, ETH and XRP recover as bearish momentum fades
Ni Manish Chhetri
Petsa ng Pag-publish: 24 Oct 2025 | Petsa ng Pag-edit: 24 Oct 2025


POPULAR ARTICLES

Bitcoin (BTC), Ethereum (ETH) and Ripple (XRP) prices show signs of stabilization on Friday as market momentum steadies after recent volatility.
- Bitcoin price trades above $110,400 on Friday after rebounding from key support earlier in the week.
- Ethereum approaches a crucial resistance level, with a potential breakout signaling further upside ahead.
- XRP trades above $2.39 as momentum indicators signal weakening bearish pressure.
Bitcoin (BTC), Ethereum (ETH) and Ripple (XRP) prices show signs of stabilization on Friday as market momentum steadies after recent volatility. BTC, ETH, and XRP are holding above key levels, with momentum indicators suggesting fading bearish pressure and potential signs of recovery for these top three cryptocurrencies in the coming days.
Bitcoin shows early signs of recovery
Bitcoin price faced rejection from the 50-day Exponential Moving Average (EMA) at $113,329 on Tuesday and declined by 2.81% the next day. However, BTC price retested the 61.8% Fibonacci retracement level (drawn from the April low of $74,508 to the record high of $126,199) at $106,453 and recovered 2.33% on Thursday. At the time of writing on Friday, BTC is trading above $110,400, nearing the previously broken ascending trendline.
If BTC breaks and closes above the trendline, it could extend the rally toward the 50-day EMA at $113,329. A successful move above this level could extend the gains toward the 78.6% Fibonacci retracement level at $115,137.
The Relative Strength Index (RSI) indicator at 45 points upward on the daily chart, suggesting early signs of fading bearish momentum. For the recovery rally to be sustained, the RSI must move above the neutral level of 50. Moreover, the Moving Average Convergence Divergence (MACD) lines are converging to form a bullish crossover. If successful, this would further support a recovery ahead.
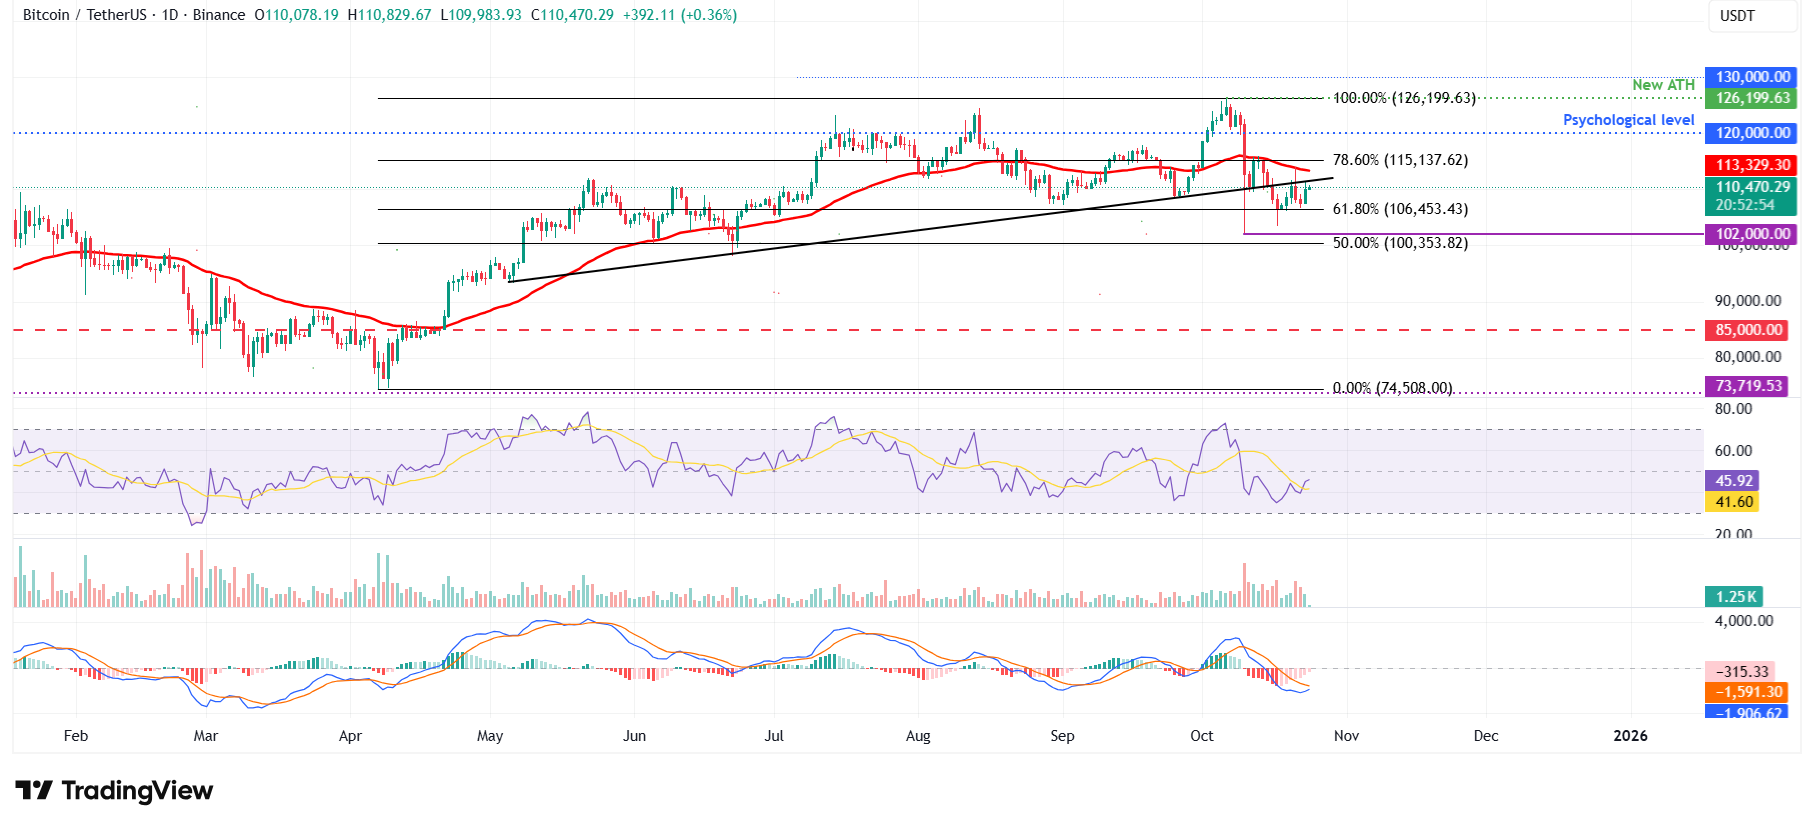
BTC/USDT daily chart
However, if BTC closes below $106,453, it could extend losses toward the October 10 low of $102,000.
Ethereum shows signs of fading bearish momentum
Ethereum price corrected by over 4% last week after being rejected at the daily resistance at $4,232. ETH continued its correction, down 5.11% in the first half of this week, but recovered slightly on Thursday. At the time of writing on Friday, ETH is recovering, trading above $3,800.
If ETH recovers, it could extend the recovery to retest its daily resistance level at $4,232.
Like Bitcoin, Ethereum’s RSI and MACD indicators show signs of fading bearish momentum and hint at potential recovery ahead.
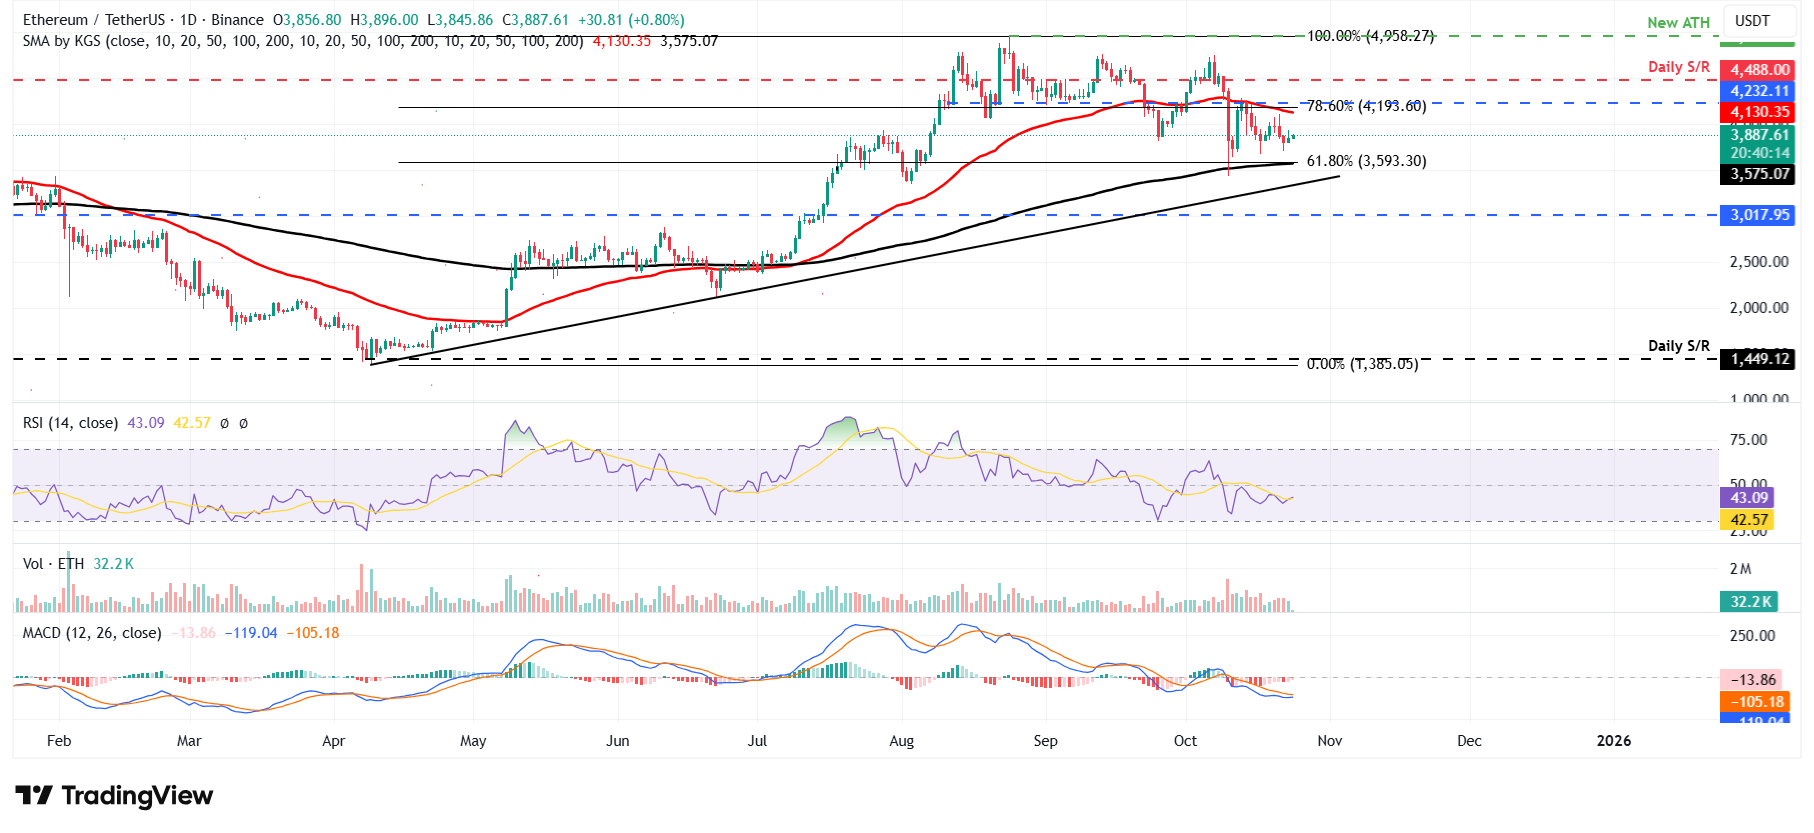
ETH/USDT daily chart
On the other hand, if ETH faces a correction, it could extend the decline toward the 61.8% Fibonacci retracement level at $3,593, which coincides with the 200-day EMA.
XRP rebounds from its daily support at $2.35
XRP started the week on a positive note, rallying 4.35% and closing above the daily resistance level at $2.35 on Monday. However, XRP declined over the next two days, erasing its Monday gains and retesting the daily level at $2.35. XRP found support around $2.35 and recovered slightly on Thursday. At the time of writing on Friday, XRP is extending its recovery, trading above $2.40.
If XRP continues to recover, it could extend the recovery toward the 50-day EMA at $2.69.
Like Bitcoin and Ethereum, XRP’s RSI and MACD indicators show signs of fading bearish momentum and hint at potential recovery ahead.
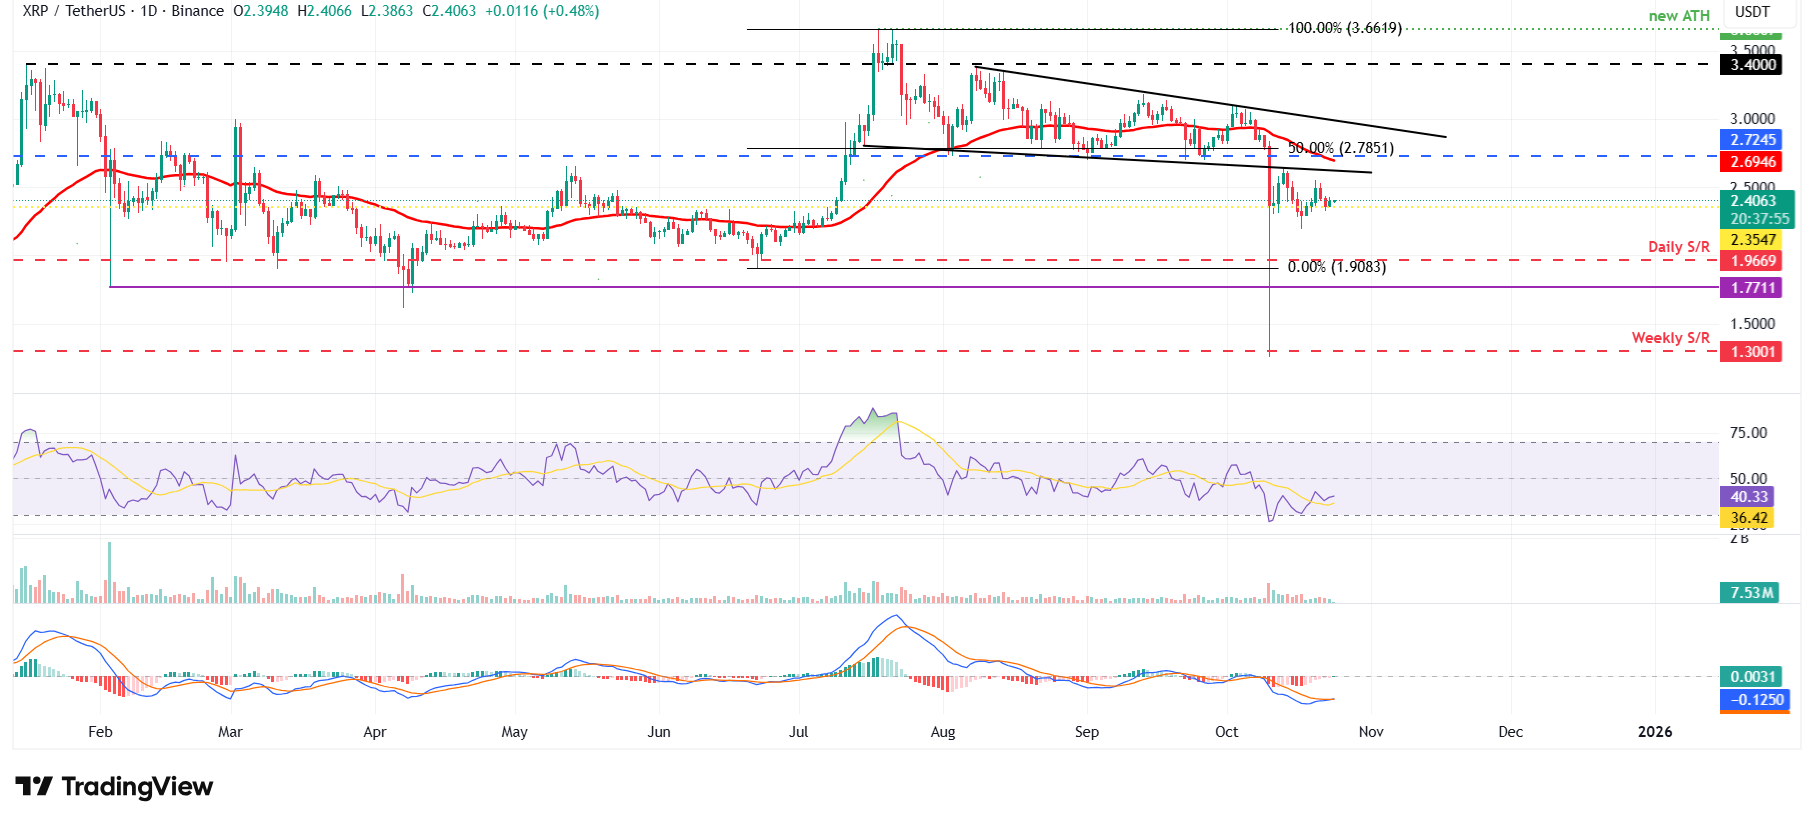
XRP/USDT daily chart
On the other hand, if XRP fails to find support around $2.35 and closes below it, it could extend the decline toward the next daily support at $1.96.
Cryptocurrency metrics FAQs
The developer or creator of each cryptocurrency decides on the total number of tokens that can be minted or issued. Only a certain number of these assets can be minted by mining, staking or other mechanisms. This is defined by the algorithm of the underlying blockchain technology. On the other hand, circulating supply can also be decreased via actions such as burning tokens, or mistakenly sending assets to addresses of other incompatible blockchains.
Market capitalization is the result of multiplying the circulating supply of a certain asset by the asset’s current market value.
Trading volume refers to the total number of tokens for a specific asset that has been transacted or exchanged between buyers and sellers within set trading hours, for example, 24 hours. It is used to gauge market sentiment, this metric combines all volumes on centralized exchanges and decentralized exchanges. Increasing trading volume often denotes the demand for a certain asset as more people are buying and selling the cryptocurrency.
Funding rates are a concept designed to encourage traders to take positions and ensure perpetual contract prices match spot markets. It defines a mechanism by exchanges to ensure that future prices and index prices periodic payments regularly converge. When the funding rate is positive, the price of the perpetual contract is higher than the mark price. This means traders who are bullish and have opened long positions pay traders who are in short positions. On the other hand, a negative funding rate means perpetual prices are below the mark price, and hence traders with short positions pay traders who have opened long positions.

FXStreet
Higit sa isang milyong user ang umaasa sa FXStreet para sa real-time market data, charting tools, expert insights, at Forex news. Ang komprehensibong economic calendar at educational webinars nito ay tumutulong sa mga trader na manatiling may alam at gumawa ng kalkuladong mga desisyon. Sinusuportahan ang FXStreet ng humigit-kumulang 60 propesyonal sa pagitan ng Barcelona HQ at iba’t ibang rehiyon sa buong mundo.
Read More


