
Trade The World
Top Crypto Gainers: Starknet, AB, SPX6900 deliver a surprise rebound
Ni Vishal Dixit
Petsa ng Pag-publish: 19 Nov 2025 | Petsa ng Pag-edit: 19 Nov 2025


POPULAR ARTICLES

Starknet (STRK), AB, and SPX6900 (SPX) are leading gains in the cryptocurrency market over the last 24 hours. The rebound in STRK, AB, and SPX marks a bullish shift in the short-term trend momentum, aiming to extend gains.
- Starknet rises by 7% on Wednesday, aiming for Sunday’s high.
- AB rallies 18% towards the 200-day EMA, with bulls eyeing a potential breakout.
- SPX6900 holds steady after a rebound above the $0.50 psychological level on Tuesday.
Starknet (STRK), AB, and SPX6900 (SPX) are leading gains in the cryptocurrency market over the last 24 hours. The rebound in STRK, AB, and SPX marks a bullish shift in the short-term trend momentum, aiming to extend gains. Technically, the Starknet and SPX6900 witness room on the upside before reaching the immediate resistance, while AB faces opposition at the 200-day Exponential Moving Average (EMA).
Starknet’s post-retest rebound aims for further gains
Starknet edges higher by 7% at press time on Wednesday, extending the 5% gains from Tuesday. The short-term recovery marks a post-retest rebound from the $0.1956 level, which served as strong resistance of a consolidation range with $0.0962 as the base level.
STRK bulls aim for a daily close above the Sunday high at $0.2467 to overcome the supply pressure at higher levels, and potentially target the R2 Pivot Point at $0.2777.
The momentum indicators on the daily chart suggest strong bullish pressure as the Relative Strength Index (RSI) at 68 fluctuates near the overbought boundary. Meanwhile, the Moving Average Convergence Divergence (MACD) maintains a steady uptrend with the signal line, while successive rises in green histogram bars corroborate the trend's momentum.
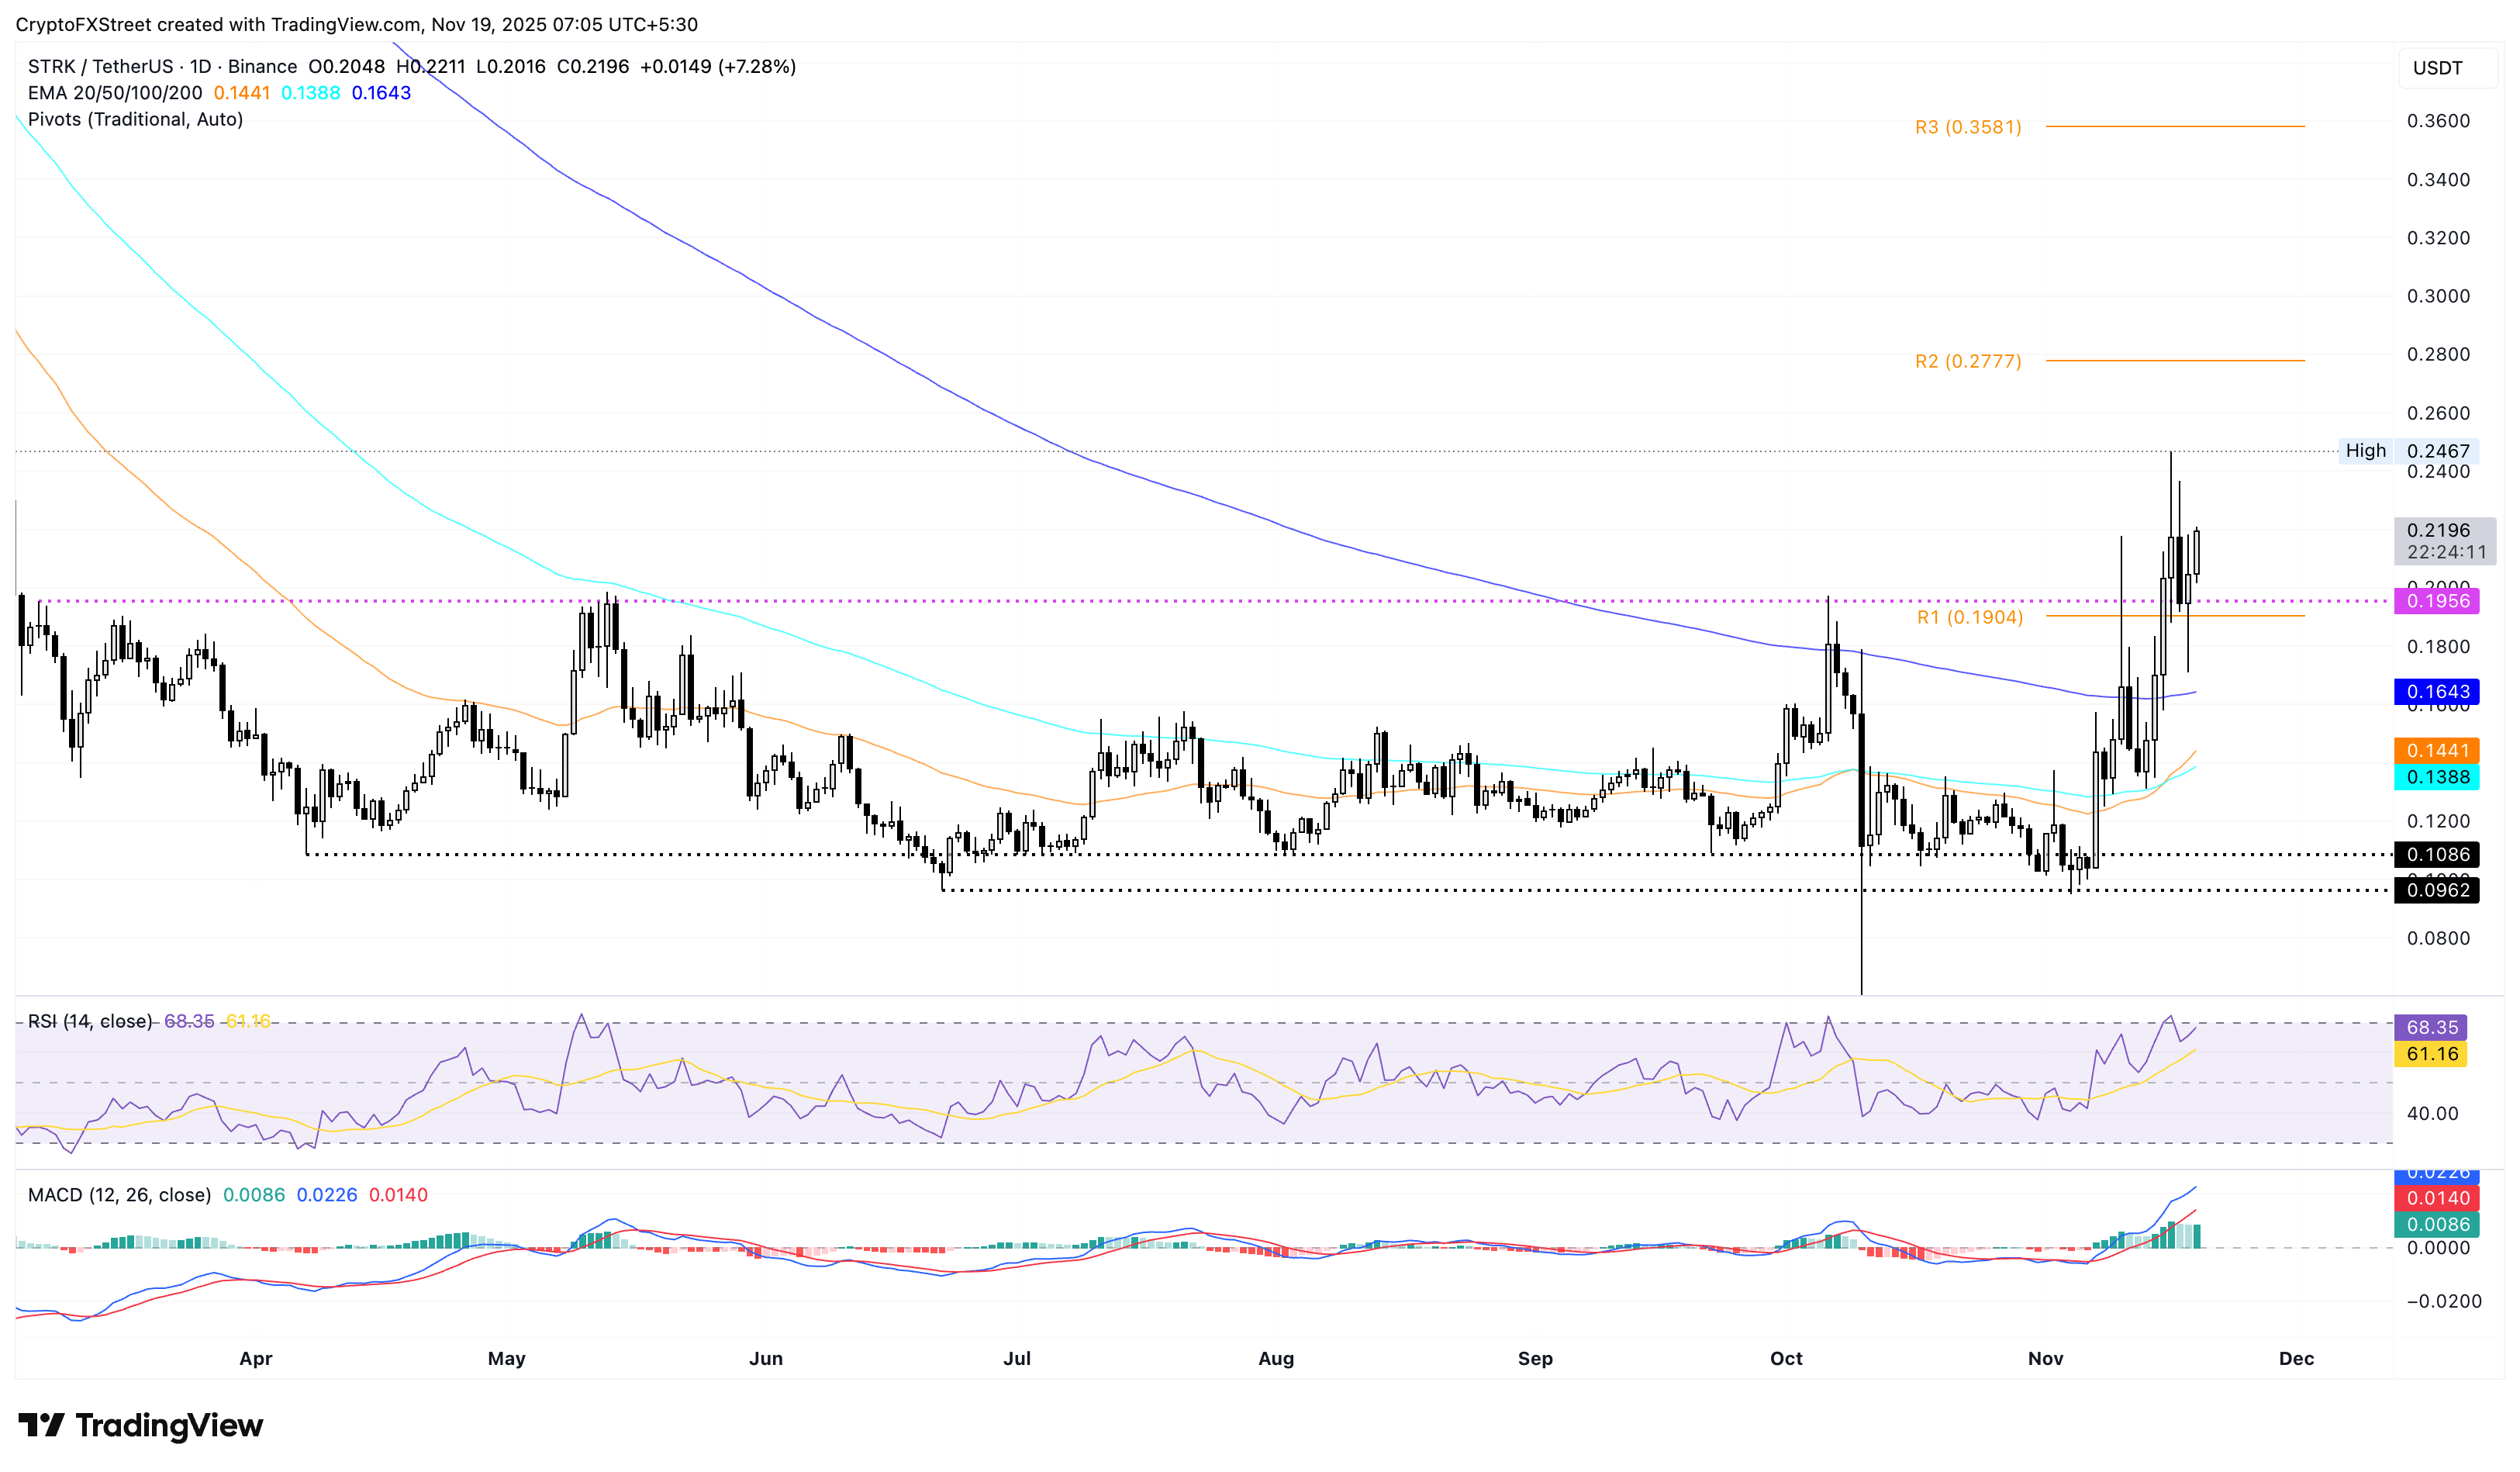
On the flip side, if STRK falls below the R1 Pivot Point at $0.1904, it would nullify the consolidation range breakout. In such a case, the decline in Starknet could test the 200-day EMA at $0.1643.
AB recovery struggles at the 200-day EMA
AB records an 18% rise by press time on Wednesday, attempting to hold above the 200-day EMA at $0.007896. The recovery in AB overshadows the five-day pullback of over 13% started on Friday.
If AB clears above $0.007896, it would confirm the 200-day EMA breakout, potentially extending the rally to the July 11 close of $0.009288.
The RSI at 66 displays a rebound towards the overbought zone as buying pressure resumes, supporting the bullish potential. At the same time, the MACD and its signal line are extending upward, approaching the zero line, signaling a potential crossover into positive territory that would indicate a renewed bullish phase.
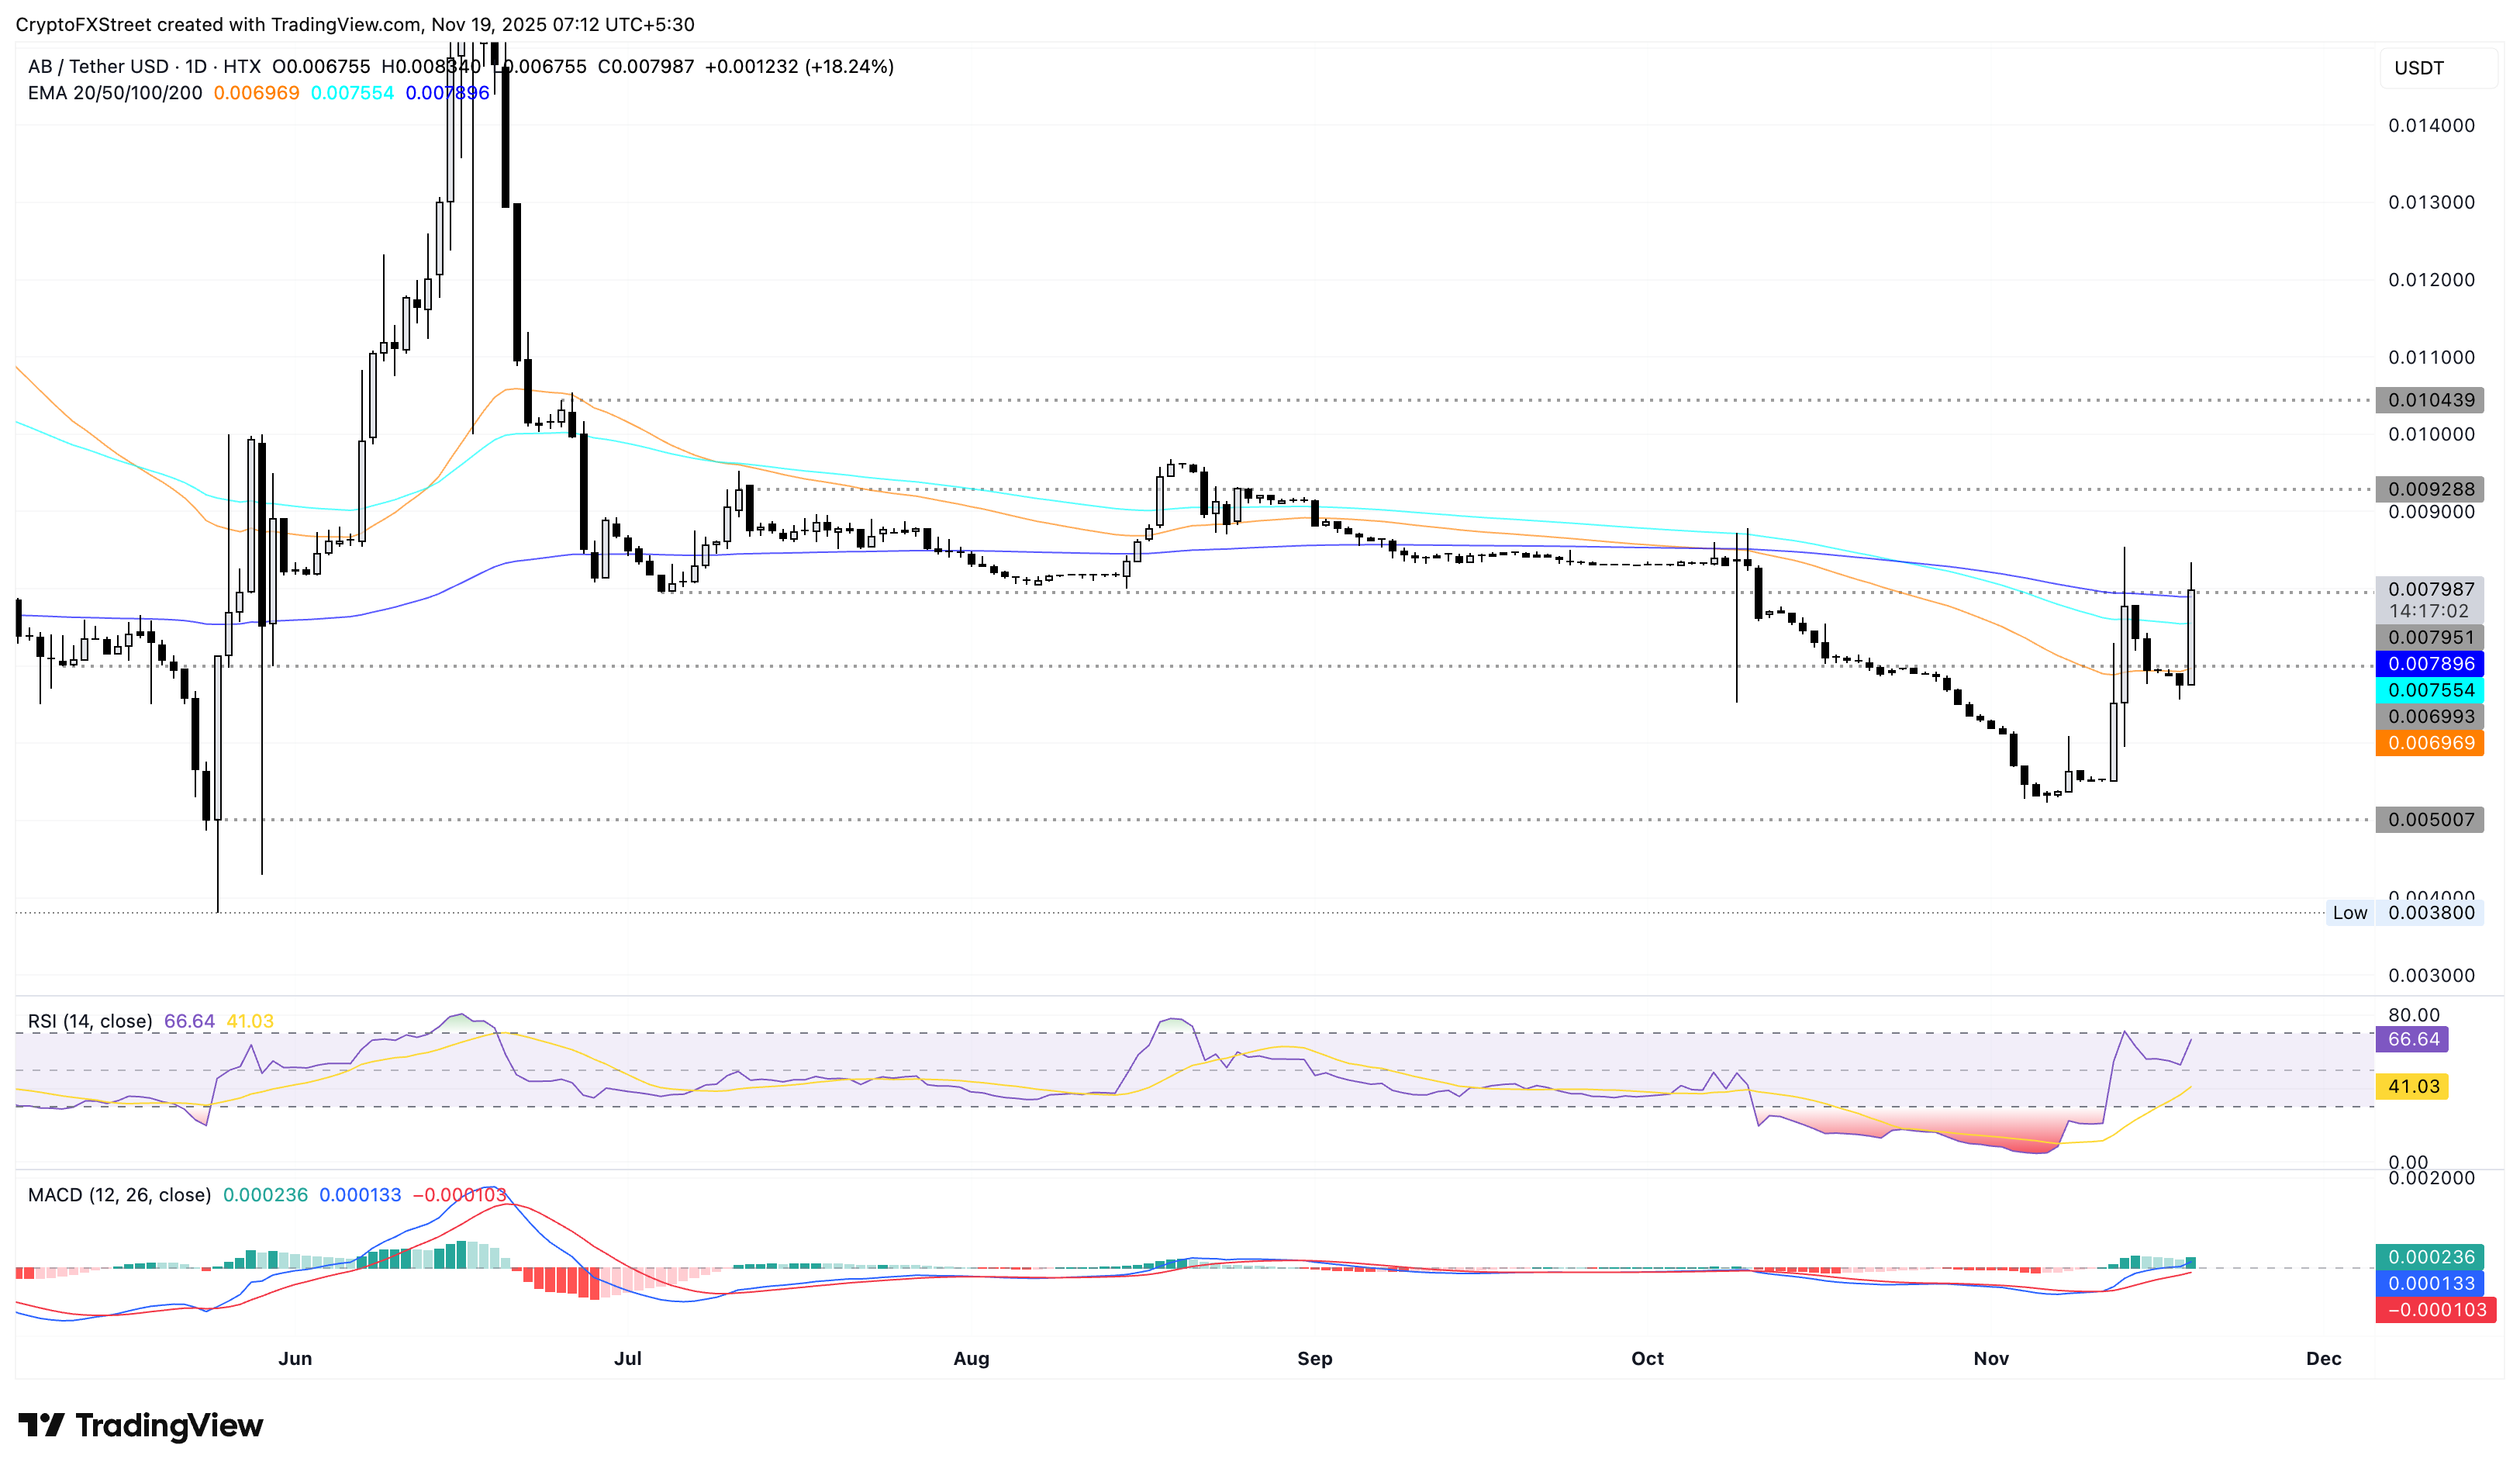
On the downside, key support for AB remains at the 50-day EMA at $0.006969.
SPX6900 flashes trend reversal potential
SPX6900 trades above $0.005500, recording a rise of over 2% at the time of writing on Wednesday. This marks an extension to a 17% rise from the previous day, indicating a potential for a bullish trend reversal.
The immediate resistance for SPX lies at $0.6345, which served as strong support in early November.
Corroborating the trend reversal thesis, the RSI at 37 reverses from the oversold zone, indicating a fresh wave of buying pressure. Meanwhile, the MACD converges with the signal line, suggesting a potential crossover that could signal a buying opportunity on renewed bullish momentum.
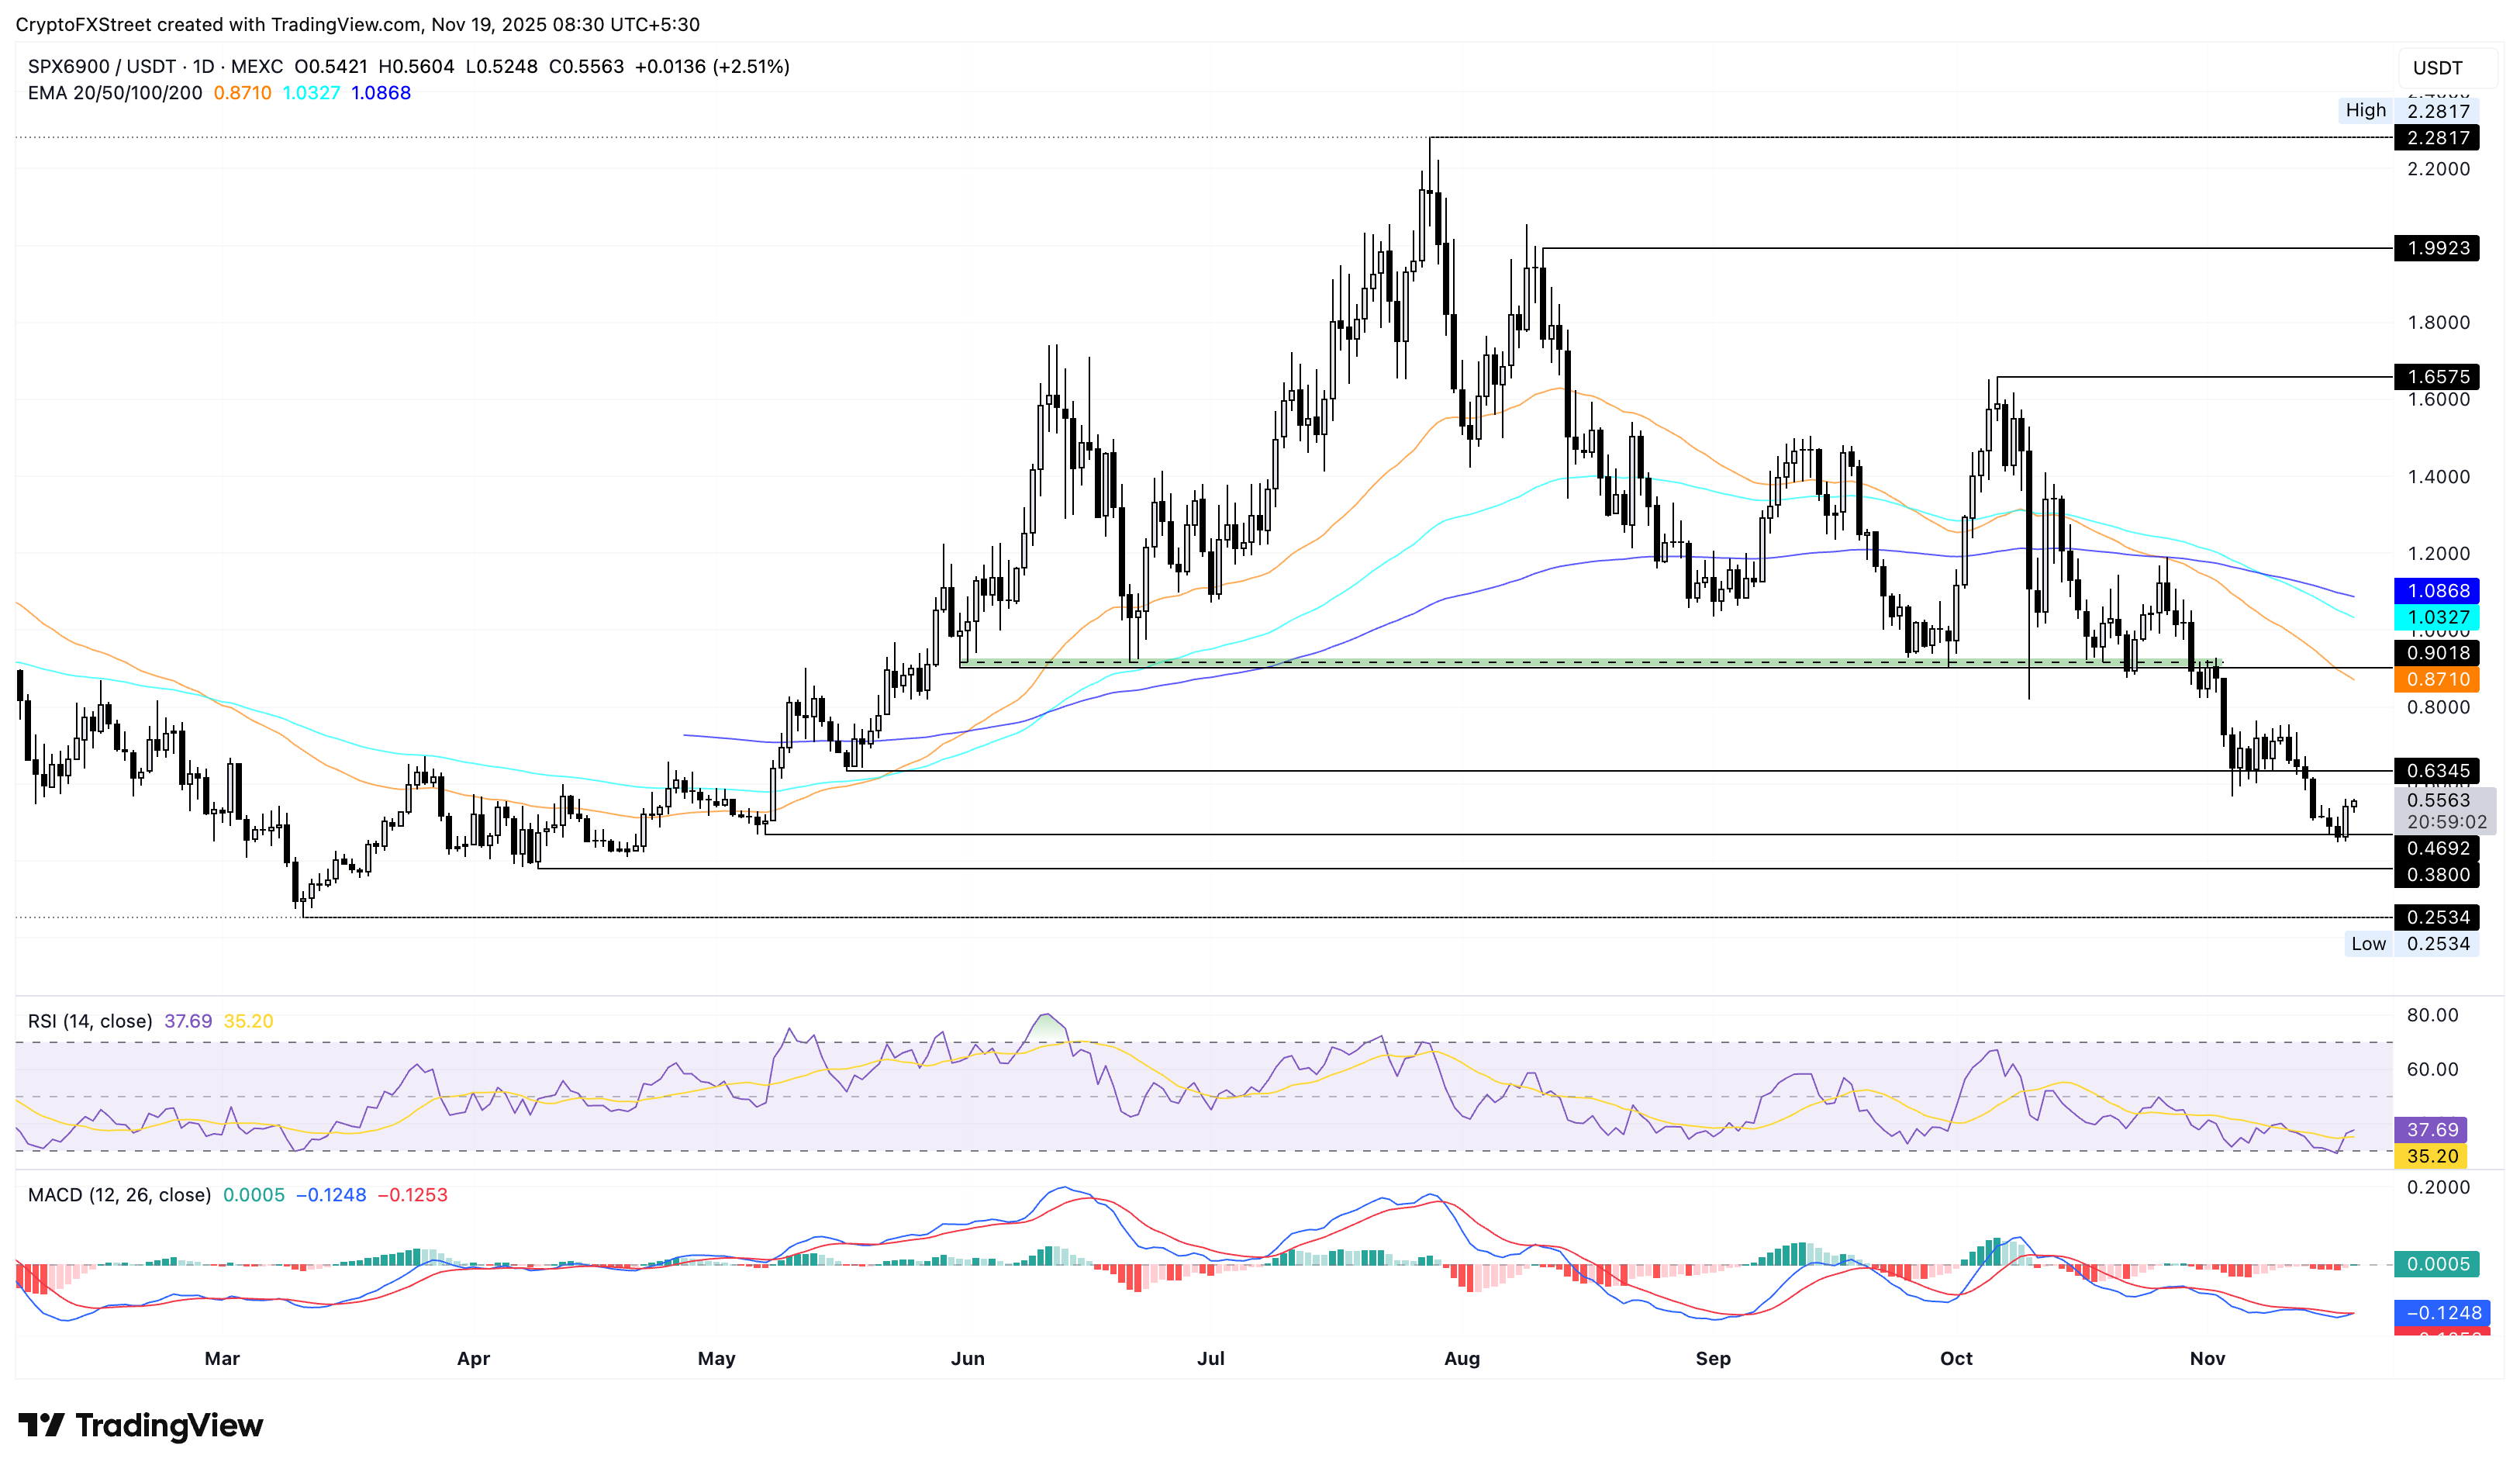
On the flip side, if SPX falls below $0.4692, it could extend the decline to the April 9 low at $0.3800.

FXStreet
Higit sa isang milyong user ang umaasa sa FXStreet para sa real-time market data, charting tools, expert insights, at Forex news. Ang komprehensibong economic calendar at educational webinars nito ay tumutulong sa mga trader na manatiling may alam at gumawa ng kalkuladong mga desisyon. Sinusuportahan ang FXStreet ng humigit-kumulang 60 propesyonal sa pagitan ng Barcelona HQ at iba’t ibang rehiyon sa buong mundo.
Read More


