
Trade The World
USD/CAD Price Forecast: Faces selling pressure above 200-day EMA
Ni Sagar Dua
Petsa ng Pag-publish: 25 Aug 2025 | Petsa ng Pag-edit: 25 Aug 2025


POPULAR ARTICLES

The USD/CAD pair trades cautiously near Friday’s low around 1.3820 during the European trading session on Monday.
- USD/CAD trades with caution around 1.3820 as Fed Powell’s dovish guidance has battered the US Dollar.
- Fed’s Powell argued in favor of interest rate cuts amid growing labor market risks.
- Investors await the US inflation and Canadian GDP data.
The USD/CAD pair trades cautiously near Friday’s low around 1.3820 during the European trading session on Monday. The Loonie pair struggles to gain ground as the US Dollar stays under pressure, following comments from Federal Reserve (Fed) Chair Jerome Powell that cooling United States (US) labor market conditions have opened the door for the resumption of the monetary expansion cycle.
At the time of writing, the US Dollar Index (DXY), which tracks the Greenback’s value against six major currencies, trades with caution near an almost four-week low around 97.70.
In his speech at the Jackson Hole Symposium on Friday, Fed’s Powell said that monetary policy adjustments have become appropriate as downside employment risks have escalated. He further added that the Fed would cut interest rates quickly if labor market risks started materializing.
Going forward, investors will focus on the US Personal Consumption Expenditure Price Index (PCE) data for July, and Canada June’s and Q2 Gross Domestic Product (GDP) data, which will be published on Friday. The Canadian economy is estimated to have expanded 0.1% in June after declining by the same pace in May.
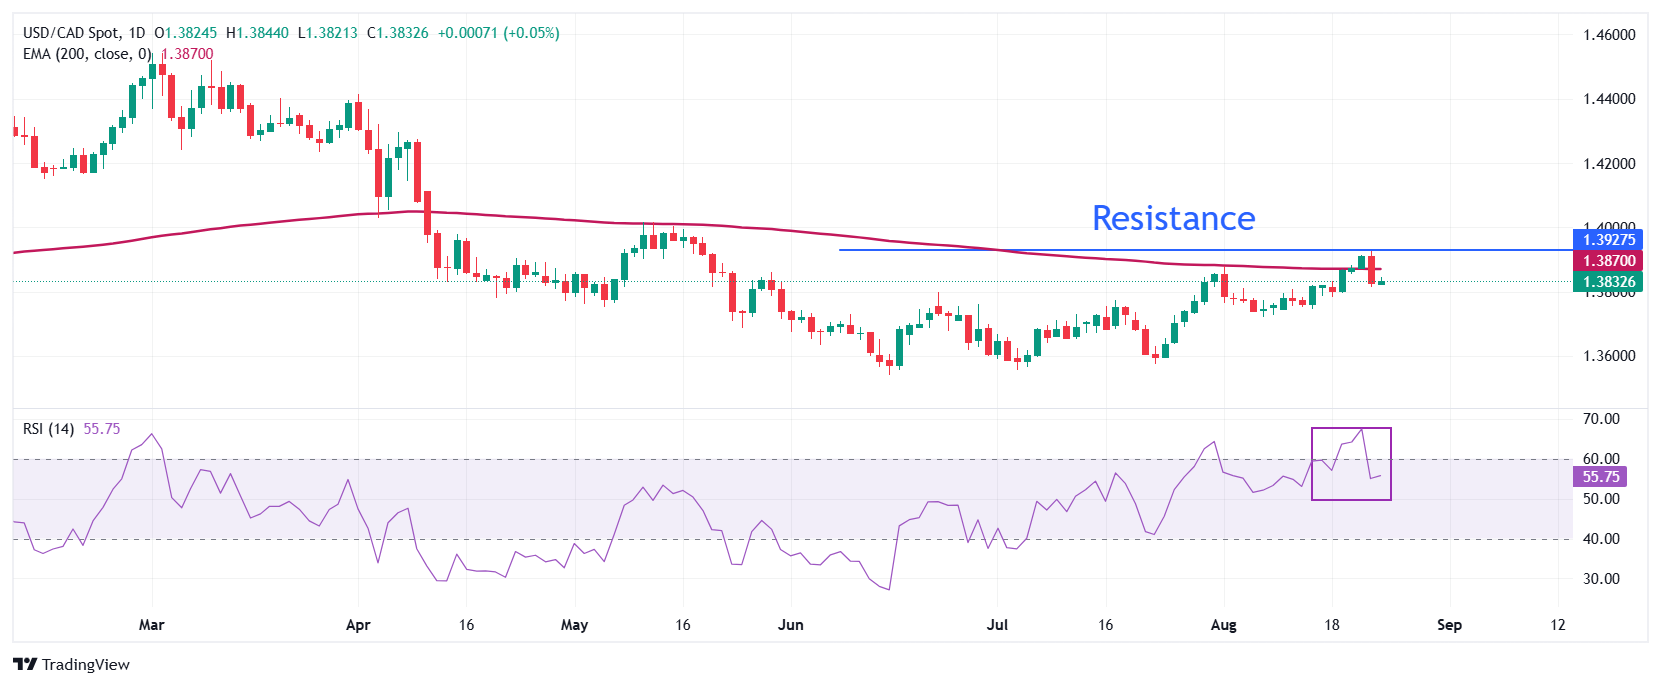
USD/CAD corrects sharply after facing selling pressure above the 200-day Exponential Moving Average (EMA), which trades around 1.3870.
The 14-day Relative Strength Index (RSI) has fallen inside the 40.00-60.00 range, suggesting that the bullish momentum is over for now. However, the bullish bias is intact.
Going forward, the asset could slide towards the psychological level of 1.3500 and the September 25 low of 1.3420 if it breaks below the June 16 low of 1.3540.
On the flip side, a recovery move by the pair above the August 22 high of 1.3925 would open the door towards the May 15 high of 1.4000, followed by the April 9 low of 1.4075.
USD/CAD daily chart
Economic Indicator
Gross Domestic Product (MoM)
The Gross Domestic Product (GDP), released by Statistics Canada on a monthly and quarterly basis, is a measure of the total value of all goods and services produced in Canada during a given period. The GDP is considered as the main measure of Canadian economic activity. The MoM reading compares economic activity in the reference month to the previous month. Generally, a high reading is seen as bullish for the Canadian Dollar (CAD), while a low reading is seen as bearish.
Read more.Next release: Fri Aug 29, 2025 12:30
Frequency: Monthly
Consensus: 0.1%
Previous: -0.1%
Source:

FXStreet
Higit sa isang milyong user ang umaasa sa FXStreet para sa real-time market data, charting tools, expert insights, at Forex news. Ang komprehensibong economic calendar at educational webinars nito ay tumutulong sa mga trader na manatiling may alam at gumawa ng kalkuladong mga desisyon. Sinusuportahan ang FXStreet ng humigit-kumulang 60 propesyonal sa pagitan ng Barcelona HQ at iba’t ibang rehiyon sa buong mundo.
Read More


