
Trade The World
USD/CAD Price Forecast: Targets six-month highs near 1.4050 as bullish bias prevails
Ni Akhtar Faruqui
Petsa ng Pag-publish: 10 Oct 2025 | Petsa ng Pag-edit: 10 Oct 2025


POPULAR ARTICLES

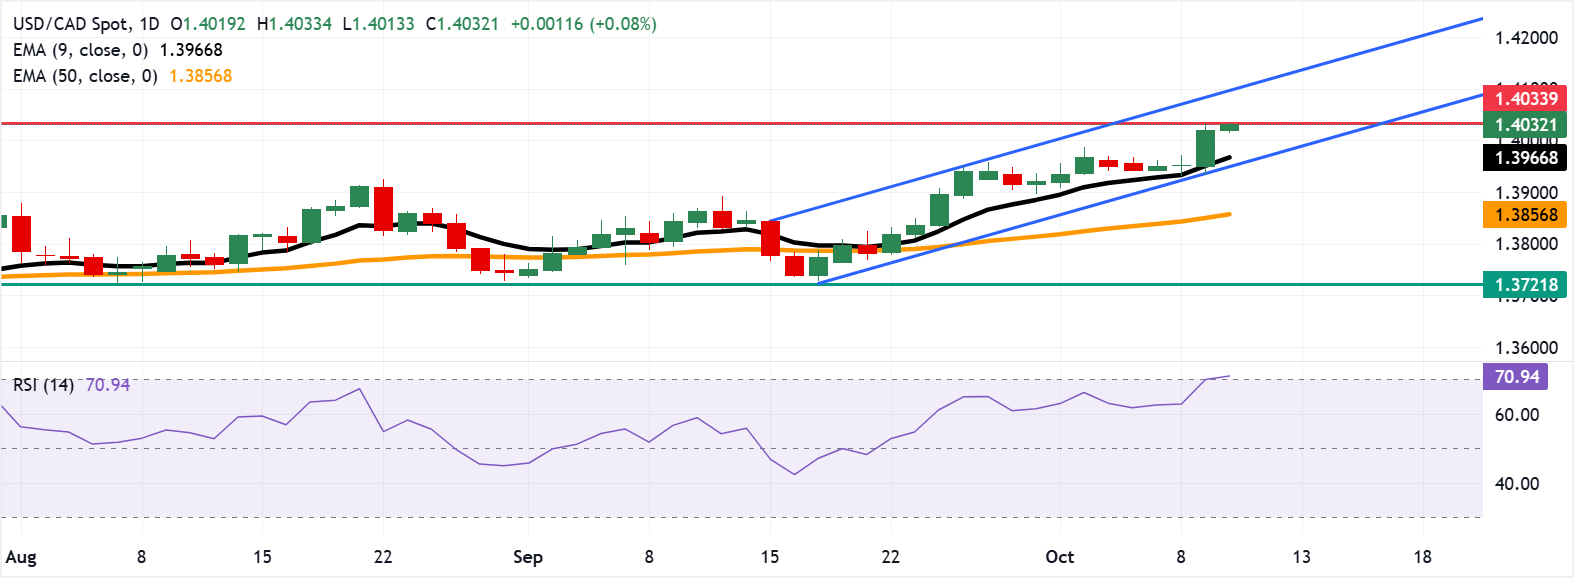
USD/CAD continues to gain ground for the fourth successive day, trading around 1.4030 during the early European hours on Friday. The technical analysis of the daily chart indicates a prevailing bullish bias as the pair is moving upwards within the ascending channel pattern.
- USD/CAD reached a six-month high of 1.4034 on Friday.
- The 14-day Relative Strength Index is positioned at the 50 level, indicating a potential downward correction ahead.
- The primary support lies at the nine-day EMA of 1.3965.
USD/CAD continues to gain ground for the fourth successive day, trading around 1.4030 during the early European hours on Friday. The technical analysis of the daily chart indicates a prevailing bullish bias as the pair is moving upwards within the ascending channel pattern.
Additionally, the USD/CAD pair remains above the nine-day Exponential Moving Average (EMA), indicating the short-term price momentum is stronger. However, the 14-day Relative Strength Index (RSI) is positioned at the 50 level, suggesting the USD/CAD pair is trading within an overbought territory and a potential for a downward correction anytime soon.
On the upside, the immediate barrier lies at the six-month high of 1.4034, reached on September 10. A break above this level would lead the pair to test the psychological level of 1.4100, followed by the ascending channel’s upper boundary around 1.4110.
The USD/CAD pair may find its initial support at the nine-day EMA of 1.3966, followed by the lower boundary of the ascending channel around 1.3950. A break below this confluence support zone would weaken the short-term price momentum and put downward pressure on the pair to navigate the region around the 50-day EMA at 1.3856.
USD/CAD: Daily Chart
Canadian Dollar Price Today
The table below shows the percentage change of Canadian Dollar (CAD) against listed major currencies today. Canadian Dollar was the strongest against the New Zealand Dollar.
| USD | EUR | GBP | JPY | CAD | AUD | NZD | CHF | |
|---|---|---|---|---|---|---|---|---|
| USD | 0.02% | 0.07% | -0.23% | 0.10% | 0.10% | 0.29% | -0.12% | |
| EUR | -0.02% | 0.08% | -0.35% | 0.06% | 0.13% | 0.03% | -0.05% | |
| GBP | -0.07% | -0.08% | -0.39% | -0.06% | 0.03% | 0.17% | -0.19% | |
| JPY | 0.23% | 0.35% | 0.39% | 0.44% | 0.42% | 0.55% | 0.23% | |
| CAD | -0.10% | -0.06% | 0.06% | -0.44% | -0.04% | 0.17% | -0.13% | |
| AUD | -0.10% | -0.13% | -0.03% | -0.42% | 0.04% | 0.15% | -0.22% | |
| NZD | -0.29% | -0.03% | -0.17% | -0.55% | -0.17% | -0.15% | -0.37% | |
| CHF | 0.12% | 0.05% | 0.19% | -0.23% | 0.13% | 0.22% | 0.37% |
The heat map shows percentage changes of major currencies against each other. The base currency is picked from the left column, while the quote currency is picked from the top row. For example, if you pick the Canadian Dollar from the left column and move along the horizontal line to the US Dollar, the percentage change displayed in the box will represent CAD (base)/USD (quote).

FXStreet
Higit sa isang milyong user ang umaasa sa FXStreet para sa real-time market data, charting tools, expert insights, at Forex news. Ang komprehensibong economic calendar at educational webinars nito ay tumutulong sa mga trader na manatiling may alam at gumawa ng kalkuladong mga desisyon. Sinusuportahan ang FXStreet ng humigit-kumulang 60 propesyonal sa pagitan ng Barcelona HQ at iba’t ibang rehiyon sa buong mundo.
Read More


