
Trade The World
Zcash Price Forecast: ZEC faces correction risks as retail activity rises, momentum weakens
Ni Manish Chhetri
Petsa ng Pag-publish: 28 Oct 2025 | Petsa ng Pag-edit: 28 Oct 2025


POPULAR ARTICLES

Zcash (ZEC) price trades in red below $330 at the time of writing on Tuesday, showing early signs of cooling after a sharp rally earlier in the week. The privacy-focused cryptocurrency, onchain data shows a rise in retail activity, a trend often linked to short-term market tops.
- Zcash trades in red on Tuesday, erasing the 5% gain registered the previous day.
- On-chain data shows signs of concern as retail activity increases, often indicating short-term market overheating.
- The RSI and price action show a bearish divergence, adding to the likelihood of a correction ahead.
Zcash (ZEC) price trades in red below $330 at the time of writing on Tuesday, showing early signs of cooling after a sharp rally earlier in the week. The privacy-focused cryptocurrency, onchain data shows a rise in retail activity, a trend often linked to short-term market tops. Adding to this bearish outlook, the technical indicators are flashing bearish divergence, suggesting weakening momentum and the potential for a near-term correction.
Zcash's rising retail activity hints at a short-term correction
Ki Young Ju, Founder and CEO of on-chain and market data platform CryptoQuant, shared on X on Tuesday that Zcash appears to be in its distribution phase.
Ju cautioned investors, saying, “Sorry, but you’re retail if you’re buying Zcash now,” suggesting ZEC may be entering a period of profit-taking after recent gains.
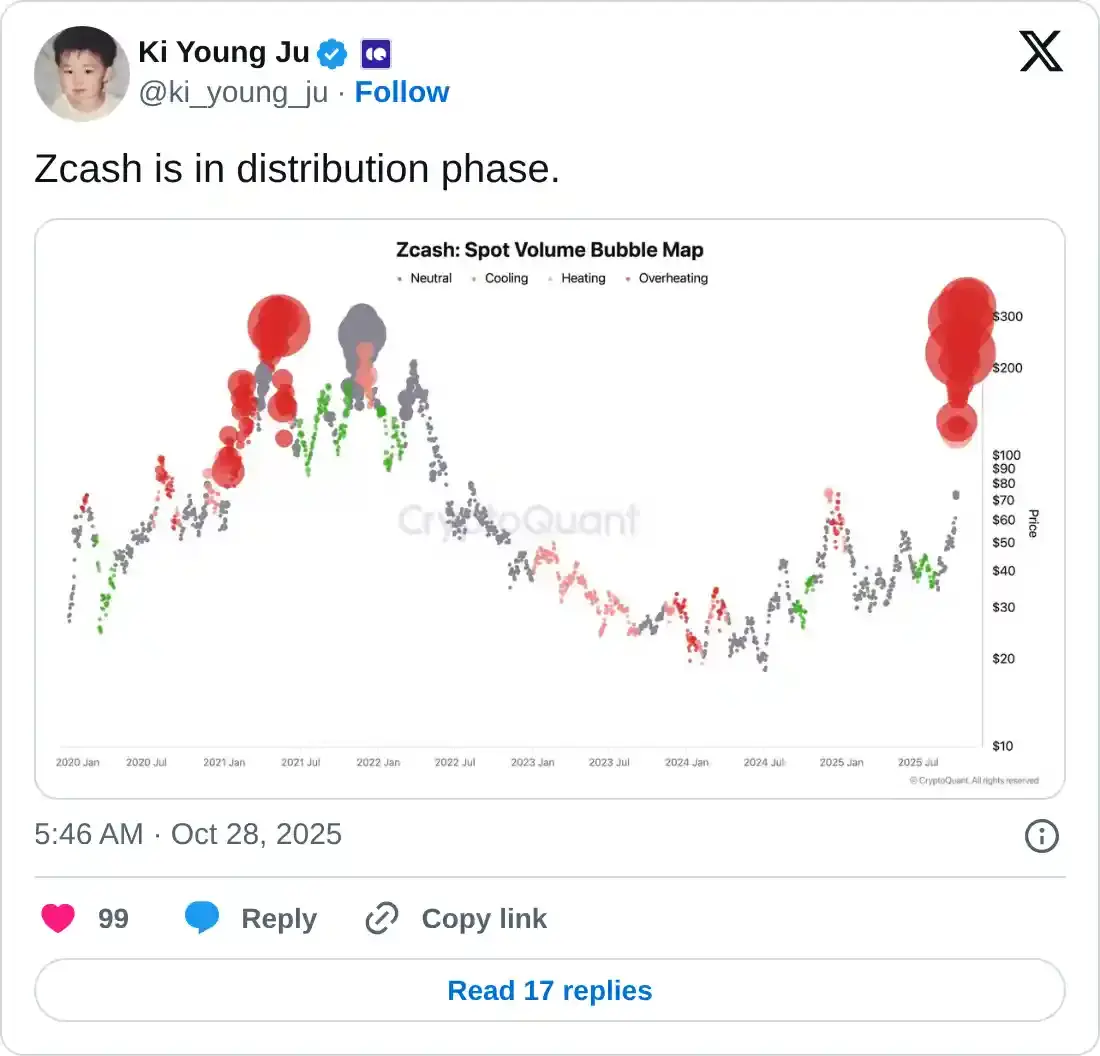
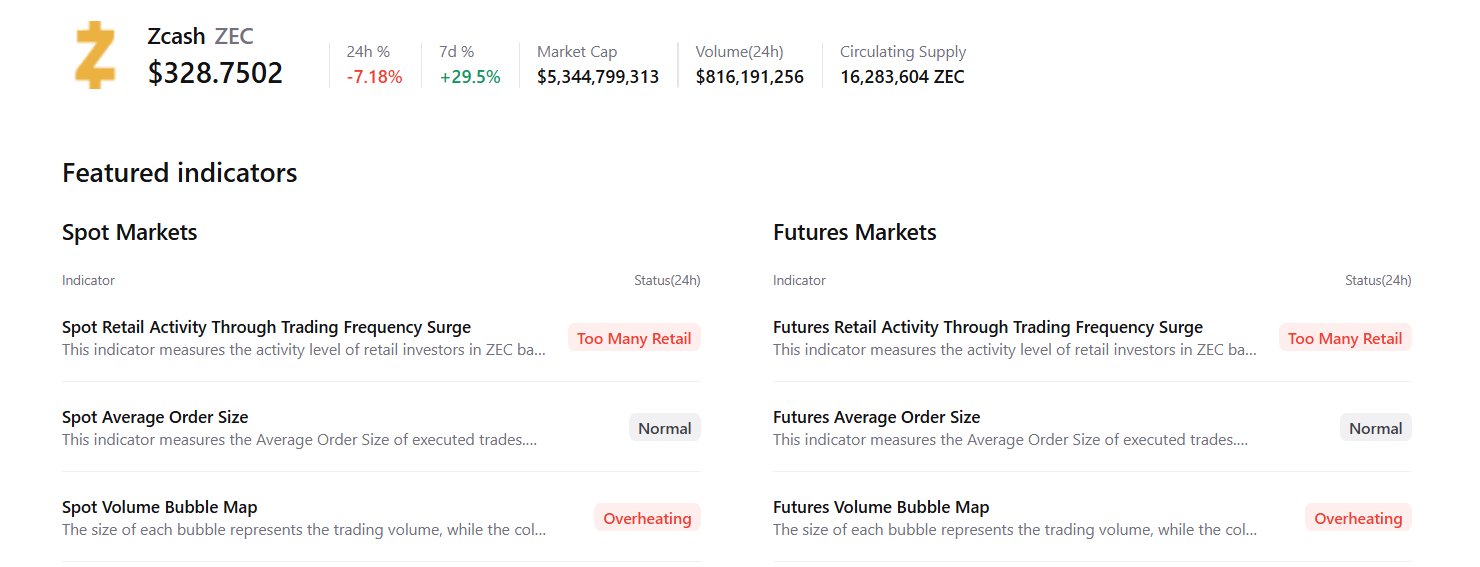
Additionally, CryptoQuant’s summary data further supports the bearish outlook, with both the spot and futures markets showing signs of retail activity and overheating conditions, signaling a potential correction ahead.
Zcash Price Forecast: ZEC’s RSI indicator shows bearish divergence
Zcash's price rose more than 37% in the previous week, and on Monday, it extended those gains by 5%. At the time of writing on Tuesday, ZEC trades slightly below $230.
Moreover, on the daily chart, ZEC's price shows a bearish divergence in the Relative Strength Index (RSI). The formation of a higher high on Monday contrasts with the RSI’s low highs during the same period. This development is called a bearish divergence and often signals a trend reversal after recent upward momentum.
If ZEC faces a correction, it could extend the decline toward the weekly support at $260.42.
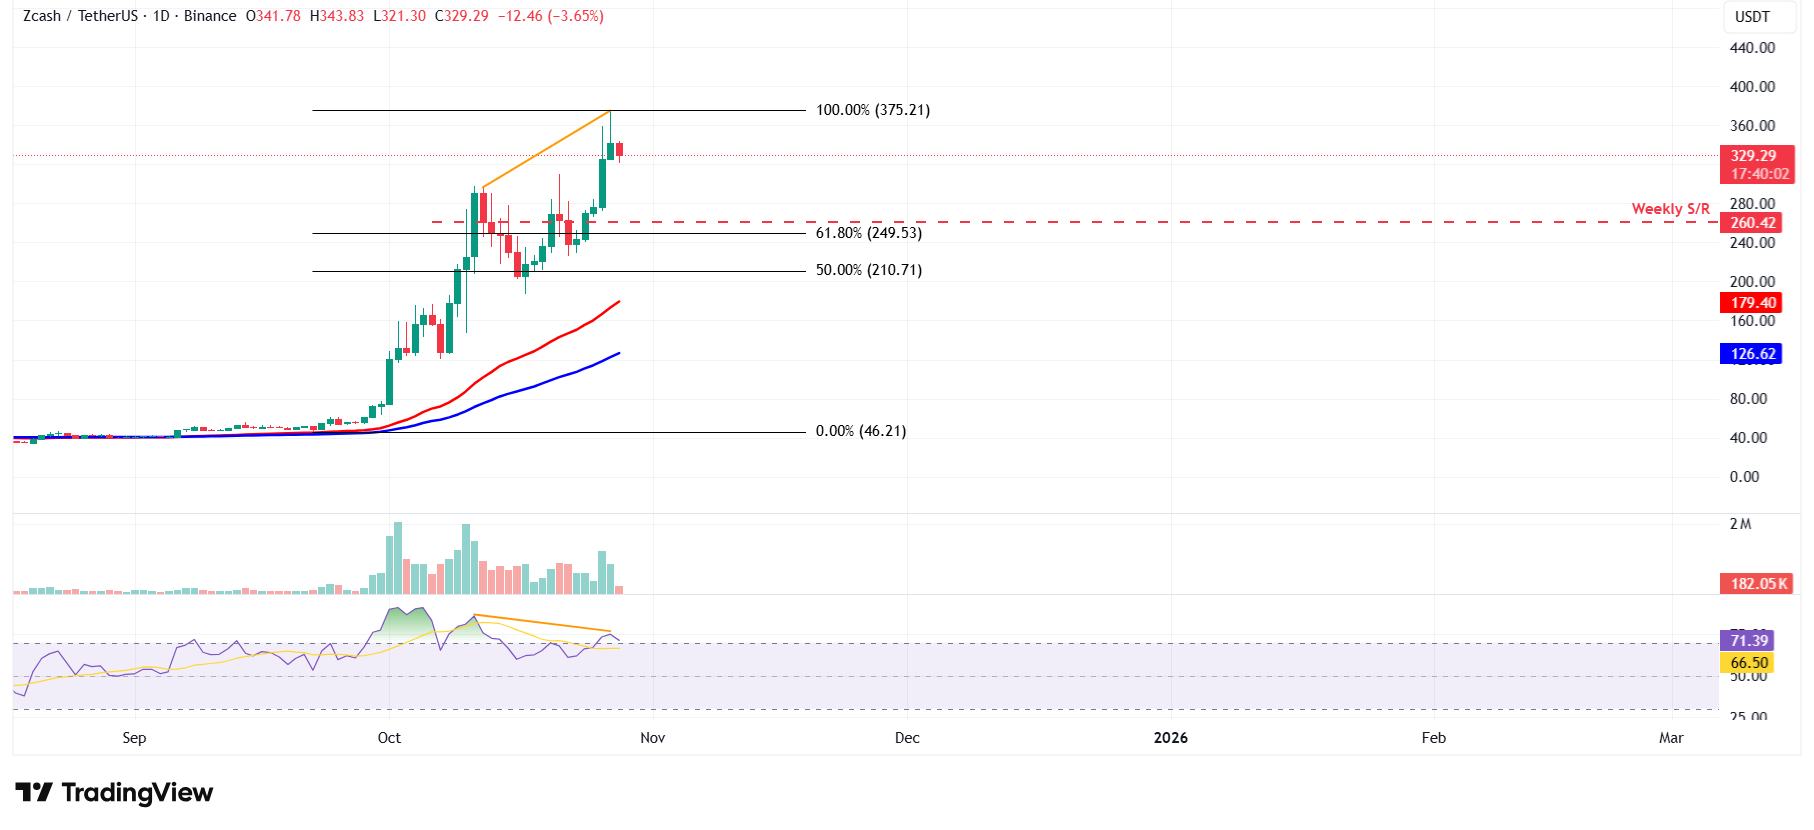
ZEC/USDT daily chart
On the other hand, if ZEC recovers, it could extend the rally toward Monday’s high of $375.21.

FXStreet
Higit sa isang milyong user ang umaasa sa FXStreet para sa real-time market data, charting tools, expert insights, at Forex news. Ang komprehensibong economic calendar at educational webinars nito ay tumutulong sa mga trader na manatiling may alam at gumawa ng kalkuladong mga desisyon. Sinusuportahan ang FXStreet ng humigit-kumulang 60 propesyonal sa pagitan ng Barcelona HQ at iba’t ibang rehiyon sa buong mundo.
Read More


