

Savdo
Raqobatbardosh narxlar, chuqur likvidlik va ilg‘or savdo vositalari bilan keng turdagi bozorlarni kashf eting.
Batafsil ma’lumot 
Platforma
TMGM’ning tezlik, aniqlik va yuqori savdo tajribasi uchun yaratilgan kuchli platformasi bilan uzluksiz savdo qiling.
Batafsil ma’lumot Savdo platformasi
Savdo vositalari
Akademiya
Boshlovchilar uchun qulay resurslar, jumladan qo‘llanmalar, vebinarlar va bozor tahlillari orqali savdoning asoslarini o‘rganing.
Batafsil ma’lumot Yangiliklar va tahlil
Savdo imkoniyatlaridan oldinda bo‘lish uchun bozor yangilanishlari va ekspert tahlillarini real vaqt rejimida oling
Batafsil ma’lumot Yangiliklar va tahlil
Haqida
TMGMni boshqalardan ajratib turadigan jihatlarni bilib oling — bizning global mavjudligimiz, tartibga solishdagi mustahkamligimiz va savdoda innovatsiyalarga sodiqligimiz.
Batafsil ma’lumot Nega TMGMni tanlash kerak
Nasdaq 100 leads US indexes lower on hot CPI and Nvidia
- NASDAQ, SPX and DJIA each give back about a sixth of Monday's rebound.
- Fed Governor Waller floats a half-point December hike, and the 10-year tops 5%.
- October producer prices are due Friday after a 1.3% jump in September.
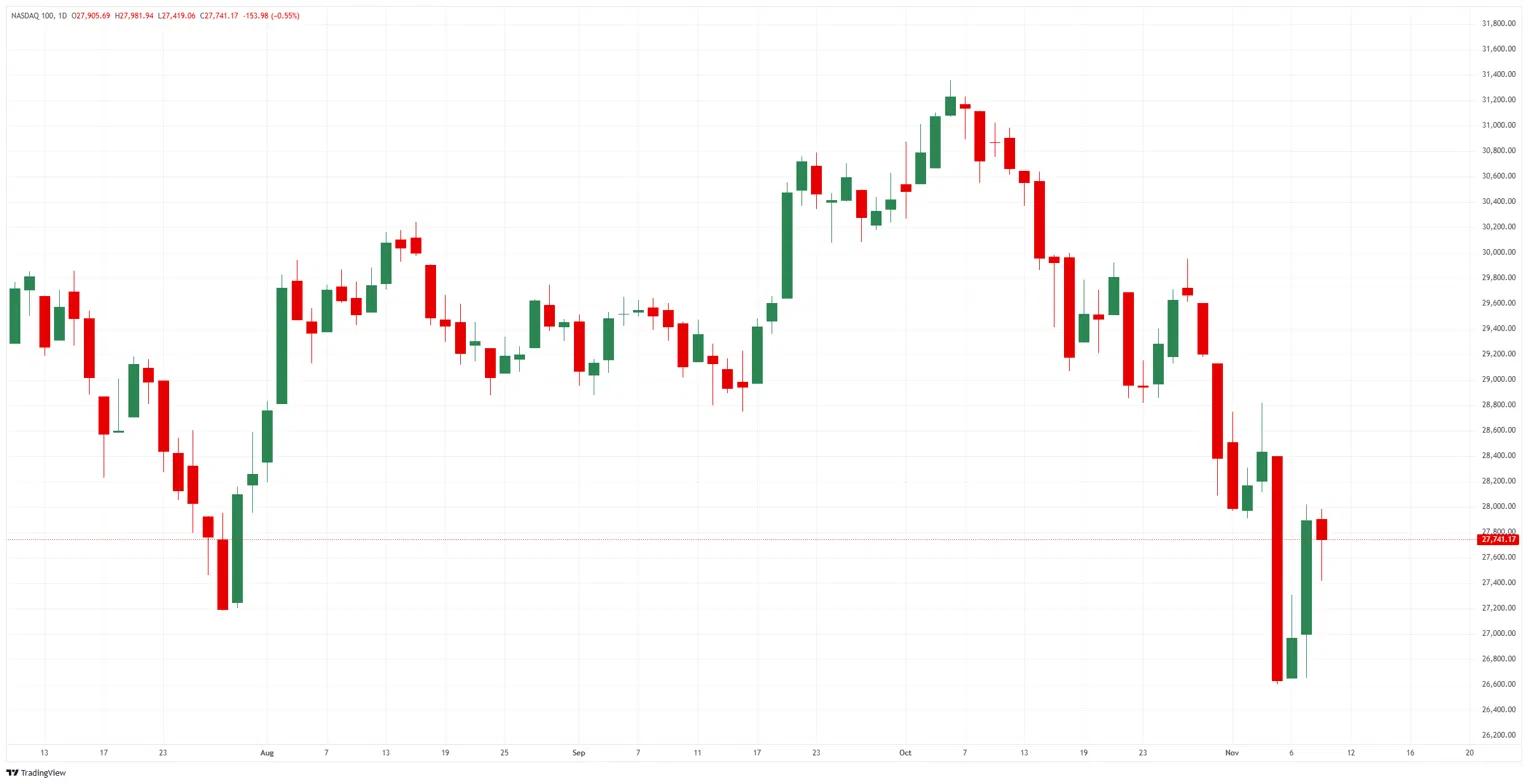
About a sixth of Monday's rebound is gone from all three US stock indexes after a hot October Consumer Price Index (CPI) and talk of a half-point Fed hike. The Nasdaq 100 gave back about half of Monday's gain, hitting a session low just above 27,400, and is now back near 27,750. The S&P 500 is near 7,525 and the Dow Jones Industrial Average near 52,250.

Consumer prices rose 0.4% in October, above the 0.3% forecast, the kind of overshoot Fed Governor Waller had said could call for a half-point December hike. The release had no annual rate, since the 2025 government shutdown left no October 2025 figure, and that rate returns on December 10, a day after the Fed decides. The 10-year Treasury yield is back above 5%, and a higher yield means stock buyers pay less for future profits.
Nvidia (NVDA), the world's most valuable company, lagged Monday's rally and is falling, which is dragging down all three indexes. The drop follows Chief Executive Jensen Huang's admission of an affair with a woman accused of spying for China. Chip stocks make up a larger share of the NASDAQ 100 than of the other two, and that index is falling the most of the three.
On the calendar
Fed Vice Chair for Supervision Bowman and Philadelphia Fed President Paulson speak at 23:30 GMT on Tuesday, and Cleveland Fed President Hammack at 14:00 GMT on Thursday. All three vote on the December 8-9 decision, where traders see a hike as close to certain, so what they say bears on its size.
Weekly jobless claims are due at 13:30 GMT on Thursday, forecast at 195K after 189K. October producer prices follow at 13:30 GMT on Friday, forecast up 0.4% after a 1.3% jump in September, the next inflation figure to bear on a half-point hike.
On the charts
The NASDAQ 100 has climbed back about a quarter of its fall from the October 6 high near 31,350. The S&P 500 is about two-fifths of the way back from its November 6 low near 7,325 to its October high just below 7,850. The Dow Jones Industrial Average is near the middle of the 50,500-53,800 range it has held since mid-September.
Nasdaq 100 index, daily chart
Nasdaq FAQs
The Nasdaq is a stock exchange based in the US that started out life as an electronic stock quotation machine. At first, the Nasdaq only provided quotations for over-the-counter (OTC) stocks but later it became an exchange too. By 1991, the Nasdaq had grown to account for 46% of the entire US securities’ market. In 1998, it became the first stock exchange in the US to provide online trading. The Nasdaq also produces several indices, the most comprehensive of which is the Nasdaq Composite representing all 2,500-plus stocks on the Nasdaq, and the Nasdaq 100.
The Nasdaq 100 is a large-cap index made up of 100 non-financial companies from the Nasdaq stock exchange. Although it only includes a fraction of the thousands of stocks in the Nasdaq, it accounts for over 90% of the movement. The influence of each company on the index is market-cap weighted. The Nasdaq 100 includes companies with a significant focus on technology although it also encompasses companies from other industries and from outside the US. The average annual return of the Nasdaq 100 has been 17.23% since 1986.
There are a number of ways to trade the Nasdaq 100. Most retail brokers and spread betting platforms offer bets using Contracts for Difference (CFD). For longer-term investors, Exchange-Traded Funds (ETFs) trade like shares that mimic the movement of the index without the investor needing to buy all 100 constituent companies. An example ETF is the Invesco QQQ Trust (QQQ). Nasdaq 100 futures contracts allow traders to speculate on the future direction of the index. Options provide the right, but not the obligation, to buy or sell the Nasdaq 100 at a specific price (strike price) in the future.
Many different factors drive the Nasdaq 100 but mainly it is the aggregate performance of the component companies revealed in their quarterly and annual company earnings reports. US and global macroeconomic data also contributes as it impacts on investor sentiment, which if positive drives gains. The level of interest rates, set by the Federal Reserve (Fed), also influences the Nasdaq 100 as it affects the cost of credit, on which many corporations are heavily reliant. As such the level of inflation can be a major driver too as well as other metrics which impact on the decisions of the Fed.
Eng yaxshi maqolalar
1AUD/JPY narx prognozi: pasayish signallari pastga yo‘nalgan kayfiyatni kuchaytirishi fonida 109,50 dan pastladi2Oktyabrda Xitoy savdo profitsiti qisqargani fonida Avstraliya dollari sustligicha qolmoqda3Xitoyning savdo profitsiti oktyabrda kutilganidan ko‘proq qisqarib, 712,72 mlrd CNYni tashkil etdi.4AQSh dollari indeksi (DXY) 101,70 atrofida barqaror, Eron borasidagi noaniqlik fonida AQSh CPI hisobotini kutmoqda5Xitoy eksporti yillik hisobda oktyabrda 35,2%ni tashkil etib, 33,5%lik prognozdan yuqori boʻldi.6Xitoy importi (yillik hisobda) oktyabrda kutilganidan yuqori: prognoz 32%, amaldagi ko‘rsatkich 41,6%7Xitoyning AQSh dollaridagi savdo balansi oktabrda $105,28 mlrdni tashkil etdi, bu kutilgan $125,8 mlrd ko‘rsatkichidan past.8Xitoyning savdo balansi (CNY) oktabrda 712,78 mlrdni tashkil etib, kutilgan 859 mlrdlik ko‘rsatkichdan past bo‘ldi.9Xitoy eksporti (yillik, CNY) oktyabrda avvalgi 29,6% dan 28,7% gacha pasaydi.


Boshlang!
Ro‘yxatdan o‘ting va 3 daqiqadan kamroq vaqt ichida Global bozorlariga kirish imkoniga ega bo‘ling

Biz bilan bog‘laning









Kontaktlar
Telefon: +61 2 8036 8388
Faks: +61 2 8036 8388
Email: support@tmgm.com
Veb: https://www.tmgm.com



Ushbu veb-saytda taqdim etilgan ma’lumotlar faqat umumiy xususiyatga ega bo‘lib, shaxsiy moliyaviy maslahat hisoblanmaydi. Ushbu veb-saytdagi har qanday ma’lumot asosida harakat qilishdan oldin, ma’lumotning sizning maqsadlaringiz, moliyaviy ahvolingiz va ehtiyojlaringizga mosligini ko‘rib chiqishingiz kerak. CFD va FX Margin shartnomalariga sarmoya kiritish sezilarli xavflarni o‘z ichiga oladi va barcha investorlar uchun mos emas. Siz boshlang‘ich depozitingizdan ko‘proq yo‘qotishingiz mumkin. Siz asosiy aktivga egalik qilmaysiz va unda hech qanday manfaatga ega emassiz. Savdo qilishdan oldin mustaqil maslahat olishni va ishtirok etuvchi xavflarni to‘liq tushunishingizni tavsiya qilamiz. Veb-saytda keltirilgan har qanday mahsulotni xarid qilishdan oldin oshkor qilish hujjatini o‘qib chiqishingiz va ko‘rib chiqishingiz muhimdir. Ushbu veb-saytda taklif etilgan ma’lumotlar va reklama materiallari bunday foydalanish mahalliy qonunlar va qoidalarga zid bo‘ladigan har qanday mamlakat yoki yurisdiksiyadagi shaxslar tomonidan foydalanish uchun mo‘ljallanmagan. Ushbu veb-saytda taklif etilgan Mahsulotlar va Xizmatlar AQSh, Malayziya va Tailand rezidentlari uchun mo‘ljallanmagan.
TMGM turli yurisdiksiyalarda vakolatli va tartibga solinadi.
Trademax Australia Limited, TMGM nomi ostida faoliyat yuritadi, Avstraliya Qimmatli qog‘ozlar va investitsiyalar komissiyasi (ASIC) tomonidan tartibga solinadi, AFSL raqami 436416 va manzili: Level 28, One International Tower, 100 Barangaroo Avenue, 2000 Sydney, NSW Australia.
Email: support@tmgm.com.au
Trademax Global Limited, TMGM nomi ostida faoliyat yuritadi, Vanuatu Moliyaviy Xizmatlar Komissiyasi (VFSC) tomonidan vakolatli va tartibga solinadi, ro‘yxatga olish raqami 40356 va ro‘yxatdan o‘tgan manzili: 1276, Kumul Highway, Port Vila, Vanuatu, Vanuatu Respublikasi.
Email: support@tmgm.com
Trademax Global Markets (SE) Limited, TMGM nomi ostida faoliyat yuritadi, Seyshel orollari Moliyaviy Xizmatlar Boshqarmasi (FSA) tomonidan 224-sonli SD litsenziyasi bilan vakolatli va tartibga solinadi. Kompaniya Office No 13, Providence Estate ABIS Centre, Mahe, Seychelles manzilida ro‘yxatdan o‘tgan.
Email: support@tmgm.com
Trademax Global Markets (International) Pty Ltd, TMGM nomi ostida faoliyat yuritadi, Mauritius Moliyaviy Xizmatlar Komissiyasi (FSC) tomonidan GB22201012 litsenziya raqami bilan vakolatli va tartibga solinadi hamda 33, Edith Cavell Street C/o IQ EQ Fund Services (Mauritius) Ltd Port Louis, 11324 Mauritius manzilida ro‘yxatdan o‘tgan.
Email: support@tmgm.com
Mualliflik huquqi © TMGM. Barcha huquqlar himoyalangan