


釋放您的潛力:
加入100萬名
投資者的行列
立即開始交易

0.0點
點差起始
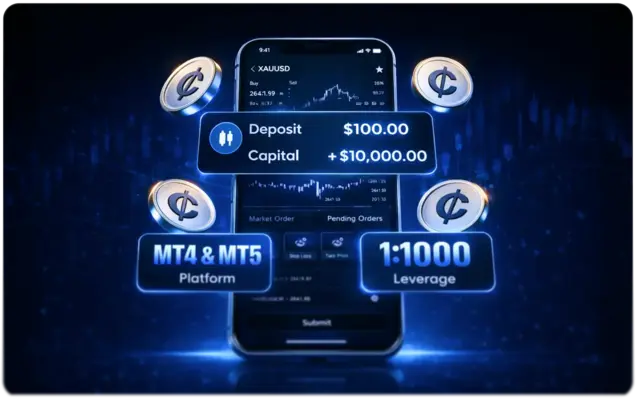
$100
最低存款
1:1000
最高槓桿
<30毫秒
執行速度
免費
資金費用
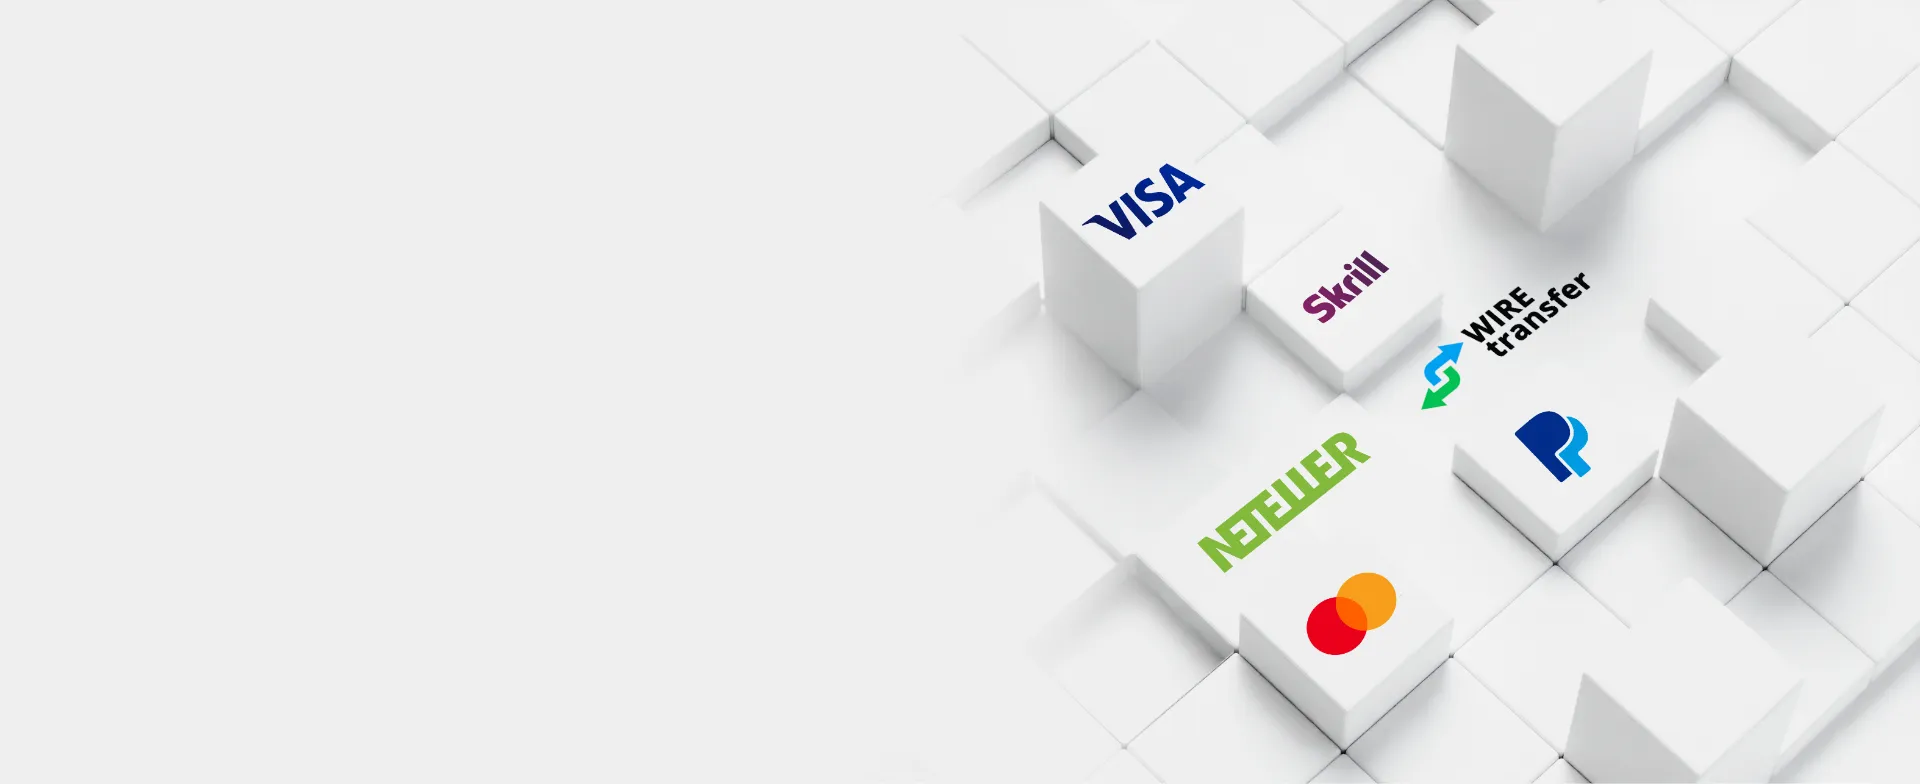
+10
資金選項
數百種
交易工具
100%
隔離客戶資金


為什麼選擇TMGM?
無與倫比的定價
受益於透明定價、超緊點差和低傭金,在每筆交易前都能獲得成本優勢。
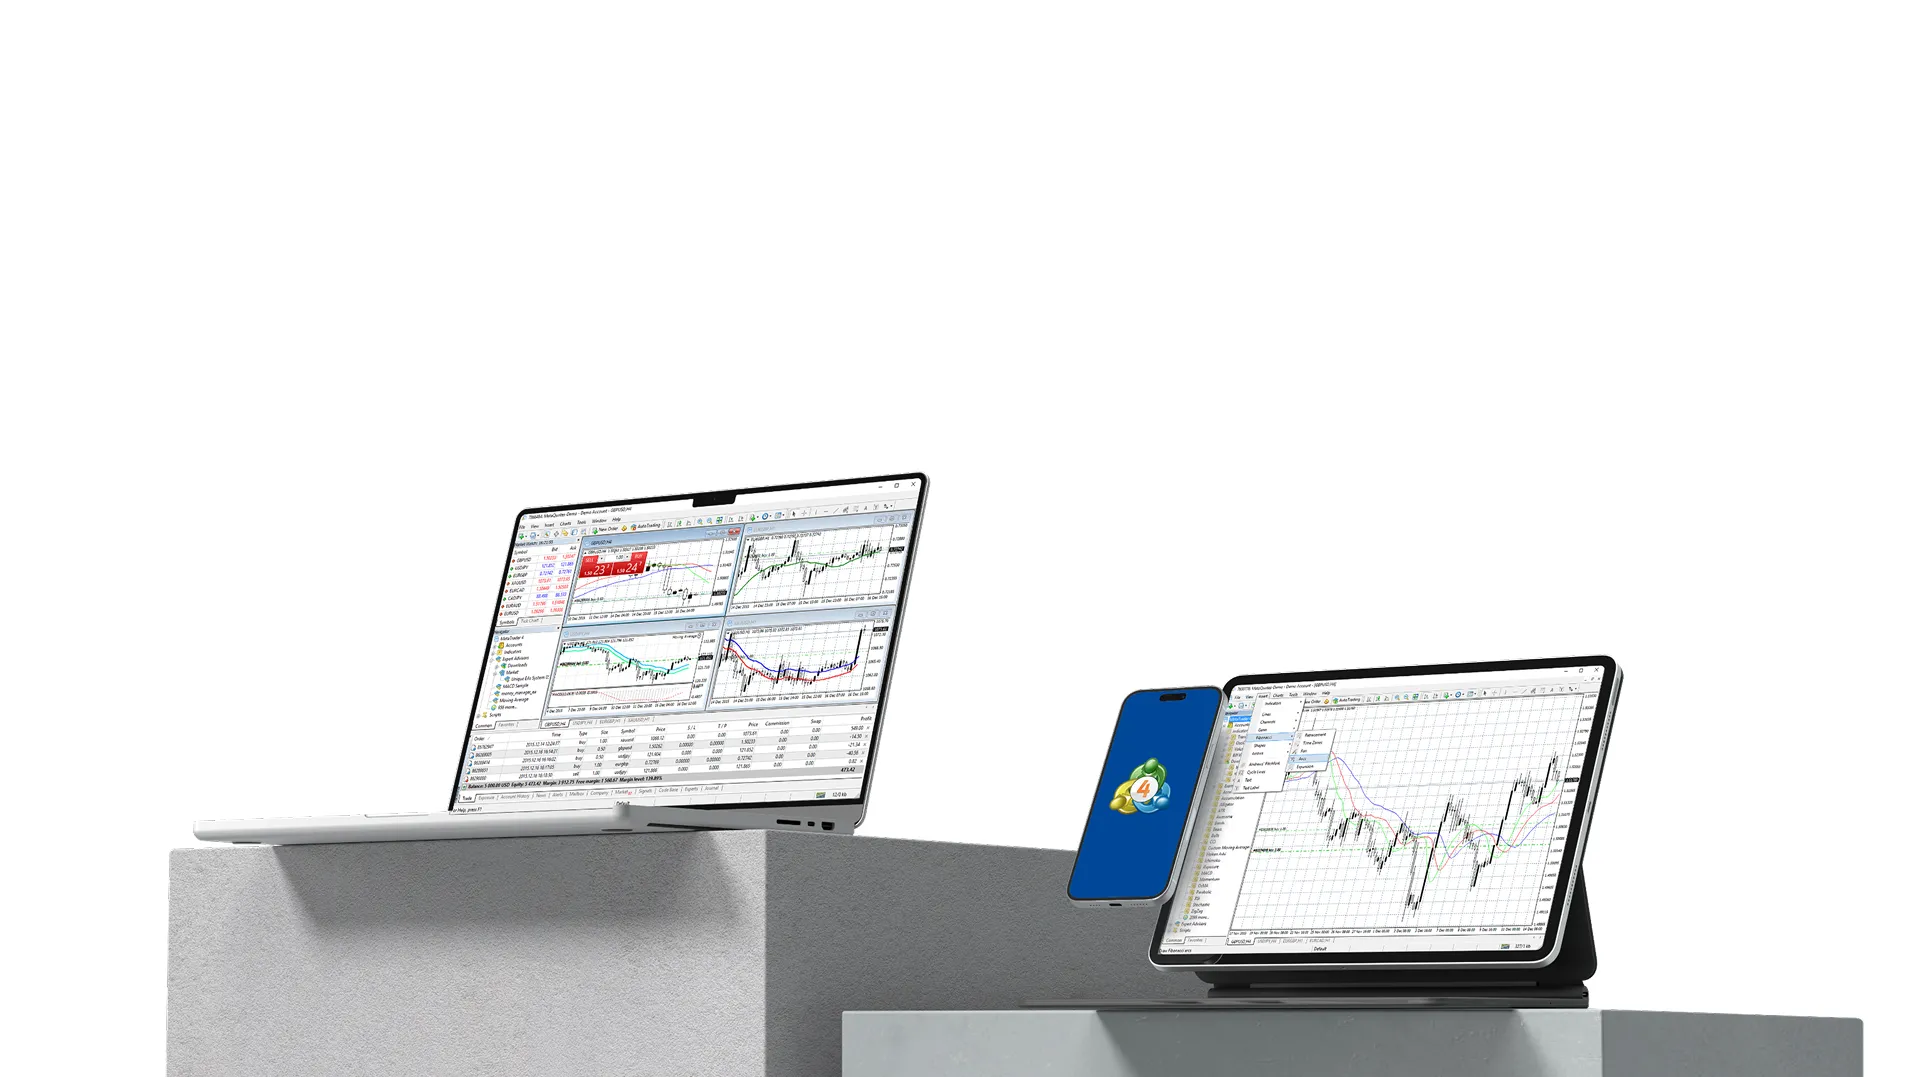
世界級交易平台
在TMGM屢獲殊榮的平台上無縫交易,包括專為精准、速度和卓越的交易體驗而設計的MetaTrader。
強大的交易工具
解鎖高級交易功能,如一鍵執行、深度市場分析、實時提醒和先進的圖表工具,讓交易更智能。
獨家教育資源
通過TMGM的免費網絡研討會、專家主導的課程和深度文章提升您的技能——涵蓋從基礎知識到複雜策略的所有內容。
在TMGM,我們通過尖端平台和行業領先技術提供最佳交易條件。我們對研究和創新的承諾確保您受益於最佳流動性和閃電般的執行速度。
保持領先 盡享 TMGM 市場洞察與分析


安全可靠的TMGM交易平台
只需一個 TMGM 交易賬戶,便可交易數百種差價合約產品,涵蓋外匯、股票、指數、大宗商品、ETF、債券等多個市場。


TMGM 贊助
TMGM 是英超勁旅車路士足球會的官方合作夥伴,也是 NBA 頂級球隊布魯克林籃網的官方合作夥伴。這一戰略合作夥伴關係體現了 TMGM 對創新、卓越表現、追求卓越和全球影響力的承諾,與這兩家標誌性體育組織的卓越地位相得益彰。

見證俱樂部
標誌性時刻
標誌性時刻

籃網中國行

專屬VIP
觀賽位置
觀賽位置

激動人心
的球迷體驗
的球迷體驗

布魯克林籃網隊
官方合作夥伴
官方合作夥伴

TMGM亮相切爾西球衣廣告位
VIP觀賽款待
VIP見面會

體育場參觀

切爾西足球俱樂部
官方合作夥伴
官方合作夥伴
見證俱樂部
標誌性時刻
標誌性時刻
籃網中國行
專屬VIP
觀賽位置
觀賽位置
激動人心
的球迷體驗
的球迷體驗

布魯克林籃網隊
官方合作夥伴
官方合作夥伴
TMGM亮相切爾西球衣廣告位
VIP觀賽款待
VIP見面會
體育場參觀

切爾西足球俱樂部
官方合作夥伴
官方合作夥伴


獎項與認可

年度交易商獎
2025 Followme
香港峰會
亞太最佳多資產金融商獎
Brokersview
年度Fastbull獎項
最具創新性贊助
外匯競技賽事獎項
SkyLine金融商指南獎
WikiFX SkyLine
金融指南2024
最佳外匯交易平台獎
IFINEXPO
年度最佳
信譽外匯經紀商獎
WikiFX曼谷
2024金融博覽會
最佳交易課程獎
ForexBrokers
Annual Awards
最佳交易體驗獎
Ultimate
Fintech Awards
越南地區最佳交易經紀商
Traders Fair
& Awards
亞洲地區最佳交易服務獎
Traders Fair
& Awards
澳洲社區重大貢獻獎
胡潤百富
金融服務業短片類銀獎
The Telly Awards
2022年度
十大最受歡迎交易商
Follow Me 年度獎項
最具成長經紀商
亞洲交易博覽會
最佳增長交易商
Follow Me 年度獎項
最佳交易環境獎
金融科技大會
最佳交易環境平台
UK Forex Awards
中國互聯網金
融行業誠信示範單位
中國企業戰略聯盟
最佳交易環境平台
馬來西亞
國際金融世界論壇
最佳客戶服務券商
中澳傳媒集團
年度最值得信賴經紀商
新浪
增長最快的外匯經紀商
UK Forex Award
外匯獎 - 亞太地區
傑出經紀商
Best Partner
Program Asia
0+ 億
交易量
150+
國家
120萬
每年交易手數
數百種
交易產品
(數據截至2024年)
(數據截至2024年)
4.3 / ★★★★★
投資評級
6 資產類別
外匯 · 加密貨幣 · 貴金屬 · 指數 · 股票 · 原油
不到3分鐘便可開設賬戶!
1
註冊
選擇賬戶類型並填寫
我們的快速安全申請表。
2
驗證
通過我們的簡化數字化
開戶流程,快速完成驗證。
3
入金
通過多種支付方式
為您的交易賬戶充值。
4
交易
立即開始交易,訪問
數百種交易工具。
交易的力量掌握在您手中
加入來自150個國家的全球交易者,體驗TMGM的閃電般執行速度。更智能、更快速、更自信地交易。


本網站所提供的資料僅屬一般性質,並不構成個人財務建議。在根據本網站上的任何資料採取行動之前,您應考慮該等資料是否適合您的目標、財務狀況及需要。投資差價合約(CFD)及外匯保證金合約涉及重大風險,並不適合所有投資者。您的損失可能超過您的初始存款。您並不擁有相關基礎資產,亦不享有其任何權益。我們建議您尋求獨立意見,並在交易前確保您已充分了解所涉及的風險。在購買網站上列出的任何產品之前,請務必閱讀並考慮相關披露文件。本網站提供的資料及廣告並非擬供任何身處其使用會違反當地法律及法規的國家或司法管轄區的人士使用。本網站提供的產品及服務並非擬供美國、馬來西亞及泰國居民使用。
TMGM 是由多家金融監管機構授權。
TMGM 集團下的 Trademax Australia Limited 公司(交易名稱為TMGM),是由澳大利亞證券和投資委員(ASIC)監管的金融服務公司,金融服務牌照號為 436416,公司地址為 Level 28, One International Tower, 100 Barangaroo Avenue, 2000 Sydney, NSW Australia.
郵箱:support@tmgm.com.au
TMGM 集團下的 Trademax Global Limited公司(交易名稱為TMGM),是由瓦努阿圖金融服務委員會(VFSC)監管的金融服務公司,金融牌照號為 40356,註冊地址為 1276, Kumul Highway, Port Vila, Vanuatu, Republic of Vanuatu.
郵箱:support@tmgm.com
Trademax Global Markets (SE) Limited,以 TMGM 為營運名稱,獲塞舌爾金融服務管理局(FSA)授權及監管,執照號碼為 SD224。公司註冊地址為塞舌爾馬埃島 Providence Estate ABIS 中心 13 號辦公室。
郵箱:support@tmgm.com
TMGM集團下的Trademax Global Markets (International) Pty Ltd公司(交易名稱為TMGM),是由毛里求斯金融服務委員會監管的金融服務公司. 牌照號為 GB22201012,註冊地址為33, Edith Cavell Street C/o IQ EQ Fund Services (Mauritius) Ltd Port Louis, 11324 Mauritius.
郵箱:support@tmgm.com
版權所有 © TMGM。保留所有權利