
Trade The World
EUR/CAD Price Forecast: Holds above nine-day EMA, 1.6200 within a consolidation phase
作者 Akhtar Faruqui
發布日期: 6 Nov 2025 | 修改日期: 6 Nov 2025


POPULAR ARTICLES

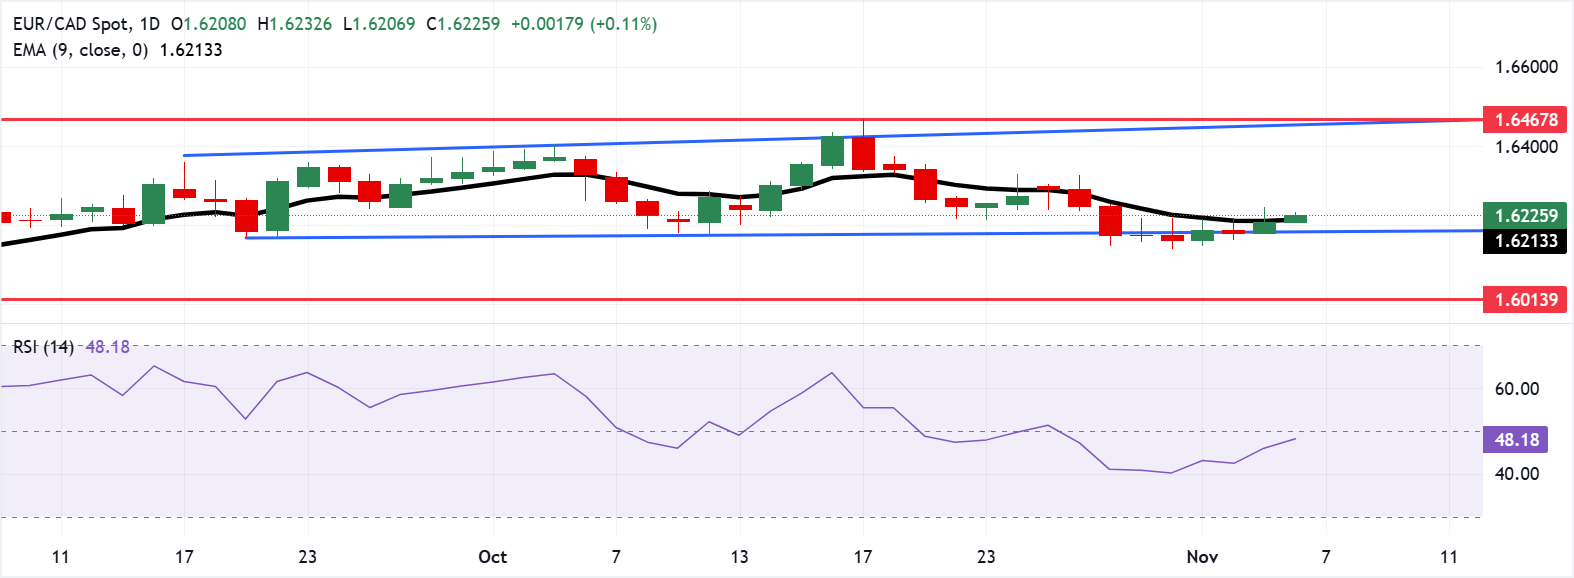
EUR/CAD extends its gains for the second successive session, trading around 1.6220 during the early European hours on Thursday. The currency cross has moved above the nine-day Exponential Moving Average (EMA), suggesting that short-term price momentum has turned stronger.
- EUR/CAD may approach the rectangle’s upper boundary at 1.6460.
- The 14-day Relative Strength Index sits slightly below the 50 mark, indicating a mild bearish bias.
- The immediate support lies at the nine-day Exponential Moving Average of 1.6213.
EUR/CAD extends its gains for the second successive session, trading around 1.6220 during the early European hours on Thursday. The currency cross has moved above the nine-day Exponential Moving Average (EMA), suggesting that short-term price momentum has turned stronger.
Technical analysis on the daily chart indicates a range-bound trading, with the currency cross moving sideways within a rectangle. However, the 14-day Relative Strength Index (RSI) is positioned slightly below the 50 level, suggesting that a bearish bias is in play. Further advances above the 50 mark would suggest that bullish bias is gradually building within the consolidation range.
On the upside, the EUR/CAD cross may explore the region around the upper boundary of the rectangle at 1.6460, aligned with the all-time high of 1.6467, reached on October 17.
The EUR/CAD cross may test the immediate support at the nine-day Exponential Moving Average (EMA) of 1.6213, followed by the psychological level of 1.6200 and the rectangle’s lower boundary near 1.6190. A break below this confluence support area would cause the emergence of the bearish bias and put downward pressure on the currency cross to navigate the region around the three-month low of 1.6013, which was recorded on September 2.
Euro Price Today
The table below shows the percentage change of Euro (EUR) against listed major currencies today. Euro was the strongest against the New Zealand Dollar.
| USD | EUR | GBP | JPY | CAD | AUD | NZD | CHF | |
|---|---|---|---|---|---|---|---|---|
| USD | -0.17% | -0.04% | -0.09% | -0.05% | -0.07% | 0.07% | -0.11% | |
| EUR | 0.17% | 0.12% | 0.07% | 0.12% | 0.07% | 0.24% | 0.06% | |
| GBP | 0.04% | -0.12% | -0.04% | -0.00% | -0.03% | 0.12% | -0.07% | |
| JPY | 0.09% | -0.07% | 0.04% | 0.06% | 0.03% | 0.14% | -0.01% | |
| CAD | 0.05% | -0.12% | 0.00% | -0.06% | -0.02% | 0.10% | -0.06% | |
| AUD | 0.07% | -0.07% | 0.03% | -0.03% | 0.02% | 0.15% | -0.03% | |
| NZD | -0.07% | -0.24% | -0.12% | -0.14% | -0.10% | -0.15% | -0.18% | |
| CHF | 0.11% | -0.06% | 0.07% | 0.00% | 0.06% | 0.03% | 0.18% |
The heat map shows percentage changes of major currencies against each other. The base currency is picked from the left column, while the quote currency is picked from the top row. For example, if you pick the Euro from the left column and move along the horizontal line to the US Dollar, the percentage change displayed in the box will represent EUR (base)/USD (quote).

Acuity Trading
Acuity Trading 是一家成立於 2013 年、總部位於倫敦的金融科技公司,專注於 AI 驅動的另類數據與情緒分析,用於交易與投資。他們以可視化新聞與情緒工具革新線上交易體驗,並持續以最新 AI 研究與技術提供可產生阿爾法的另類數據與高度互動的交易工具。
Read More


