
EUR/USD Price Forecast: Hovers around nine-day EMA above 1.1800
作者 Akhtar Faruqui
發布日期: 23 Feb 2026 | 修改日期: 23 Feb 2026


熱門文章

EUR/USD gains ground for the second successive session, trading around 1.1820 during the Asian hours on Monday. The 14-day Relative Strength Index (RSI) momentum indicator stands at 51 (neutral) after recovering above the midline, indicating stabilizing momentum.
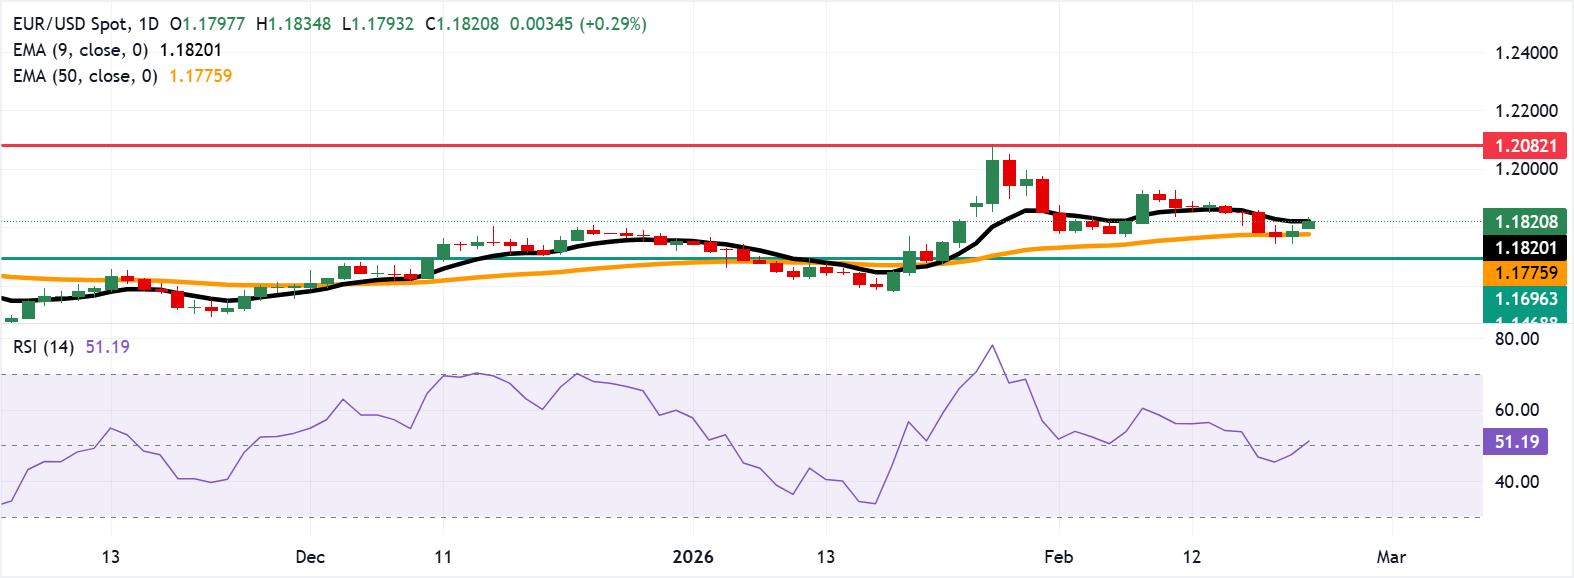
- EUR/USD trades near the nine-day EMA at 1.1820.
- The 14-day Relative Strength Index at 51 signals neutral, stabilizing momentum.
- A drop below the nine-day EMA would target the 50-day EMA at 1.1775.
EUR/USD gains ground for the second successive session, trading around 1.1820 during the Asian hours on Monday. The 14-day Relative Strength Index (RSI) momentum indicator stands at 51 (neutral) after recovering above the midline, indicating stabilizing momentum. A push in RSI above the low-50s would aid an upside extension, while a drop below 50 would tilt the risk toward support.
The technical analysis of the daily chart shows that the EUR/USD pair holds above the 50-day Exponential Moving Average (EMA), keeping the broader bias supported. The nine-day EMA has flattened near the spot, tempering immediate follow-through.
The EUR/USD pair is hovering around the nine-day EMA at 1.1820. A daily close above the short-term average would cause the emergence of the bullish bias and support the pair to explore the region around 1.2082, the highest level since June 2021.
A close back under the nine-day EMA would expose the 50-day EMA at 1.1775. A drop back under the medium-term average would strengthen the bearish bias and expose the two-month low at 1.1578, recorded on January 19.
(The technical analysis of this story was written with the help of an AI tool.)
Euro Price Today
The table below shows the percentage change of Euro (EUR) against listed major currencies today. Euro was the strongest against the Australian Dollar.
| USD | EUR | GBP | JPY | CAD | AUD | NZD | CHF | |
|---|---|---|---|---|---|---|---|---|
| USD | -0.28% | -0.20% | -0.45% | -0.09% | 0.21% | -0.09% | -0.33% | |
| EUR | 0.28% | 0.08% | -0.18% | 0.20% | 0.49% | 0.22% | -0.06% | |
| GBP | 0.20% | -0.08% | -0.25% | 0.10% | 0.40% | 0.10% | -0.14% | |
| JPY | 0.45% | 0.18% | 0.25% | 0.37% | 0.66% | 0.36% | 0.13% | |
| CAD | 0.09% | -0.20% | -0.10% | -0.37% | 0.29% | -0.01% | -0.25% | |
| AUD | -0.21% | -0.49% | -0.40% | -0.66% | -0.29% | -0.30% | -0.54% | |
| NZD | 0.09% | -0.22% | -0.10% | -0.36% | 0.00% | 0.30% | -0.25% | |
| CHF | 0.33% | 0.06% | 0.14% | -0.13% | 0.25% | 0.54% | 0.25% |
The heat map shows percentage changes of major currencies against each other. The base currency is picked from the left column, while the quote currency is picked from the top row. For example, if you pick the Euro from the left column and move along the horizontal line to the US Dollar, the percentage change displayed in the box will represent EUR (base)/USD (quote).

Acuity Trading 是一家成立於 2013 年、總部位於倫敦的金融科技公司,專注於 AI 驅動的另類數據與情緒分析,用於交易與投資。他們以可視化新聞與情緒工具革新線上交易體驗,並持續以最新 AI 研究與技術提供可產生阿爾法的另類數據與高度互動的交易工具。
閱讀更多


