
XRP approaches $2.00 support amid Fed policy anticipation and weak interest
作者 John Isige
發布日期: 10 Dec 2025 | 修改日期: 10 Dec 2025


熱門文章

Ripple (XRP) is grinding lower, trading at $2.06 at the time of writing on Wednesday, reflecting risk-off sentiment across the cryptocurrency market ahead of the Federal Reserve (Fed) monetary policy decision.
- XRP drops toward $2.00 support as the broader crypto market wobbles ahead of the Fed's monetary policy decision.
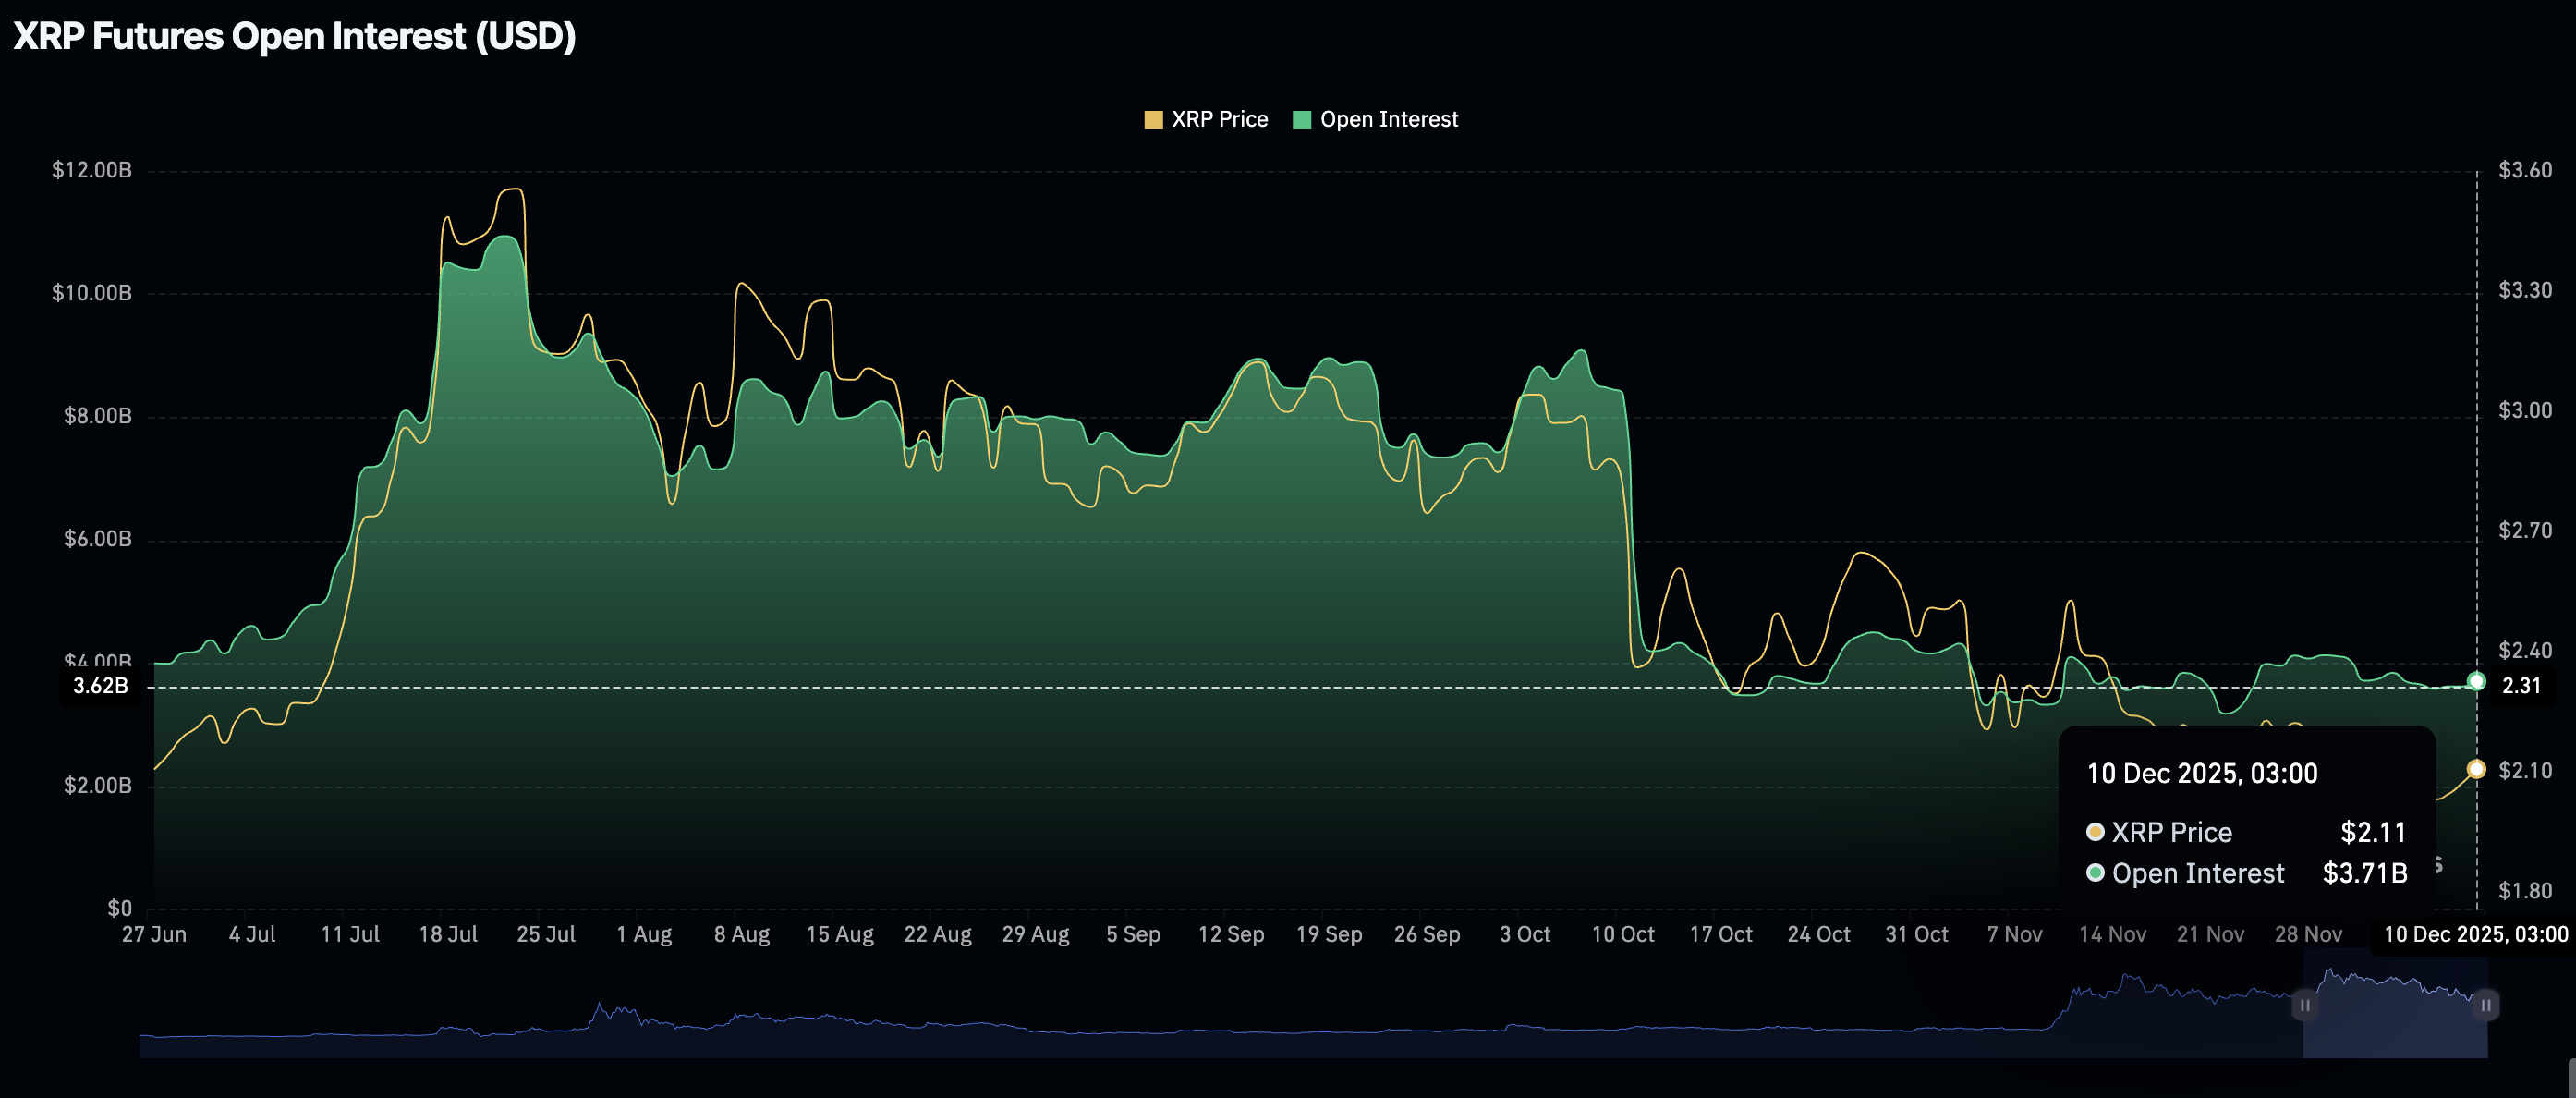
- Low retail interest, with futures Open Interest stabilising at $3.71 billion, may continue to cap rebounds.
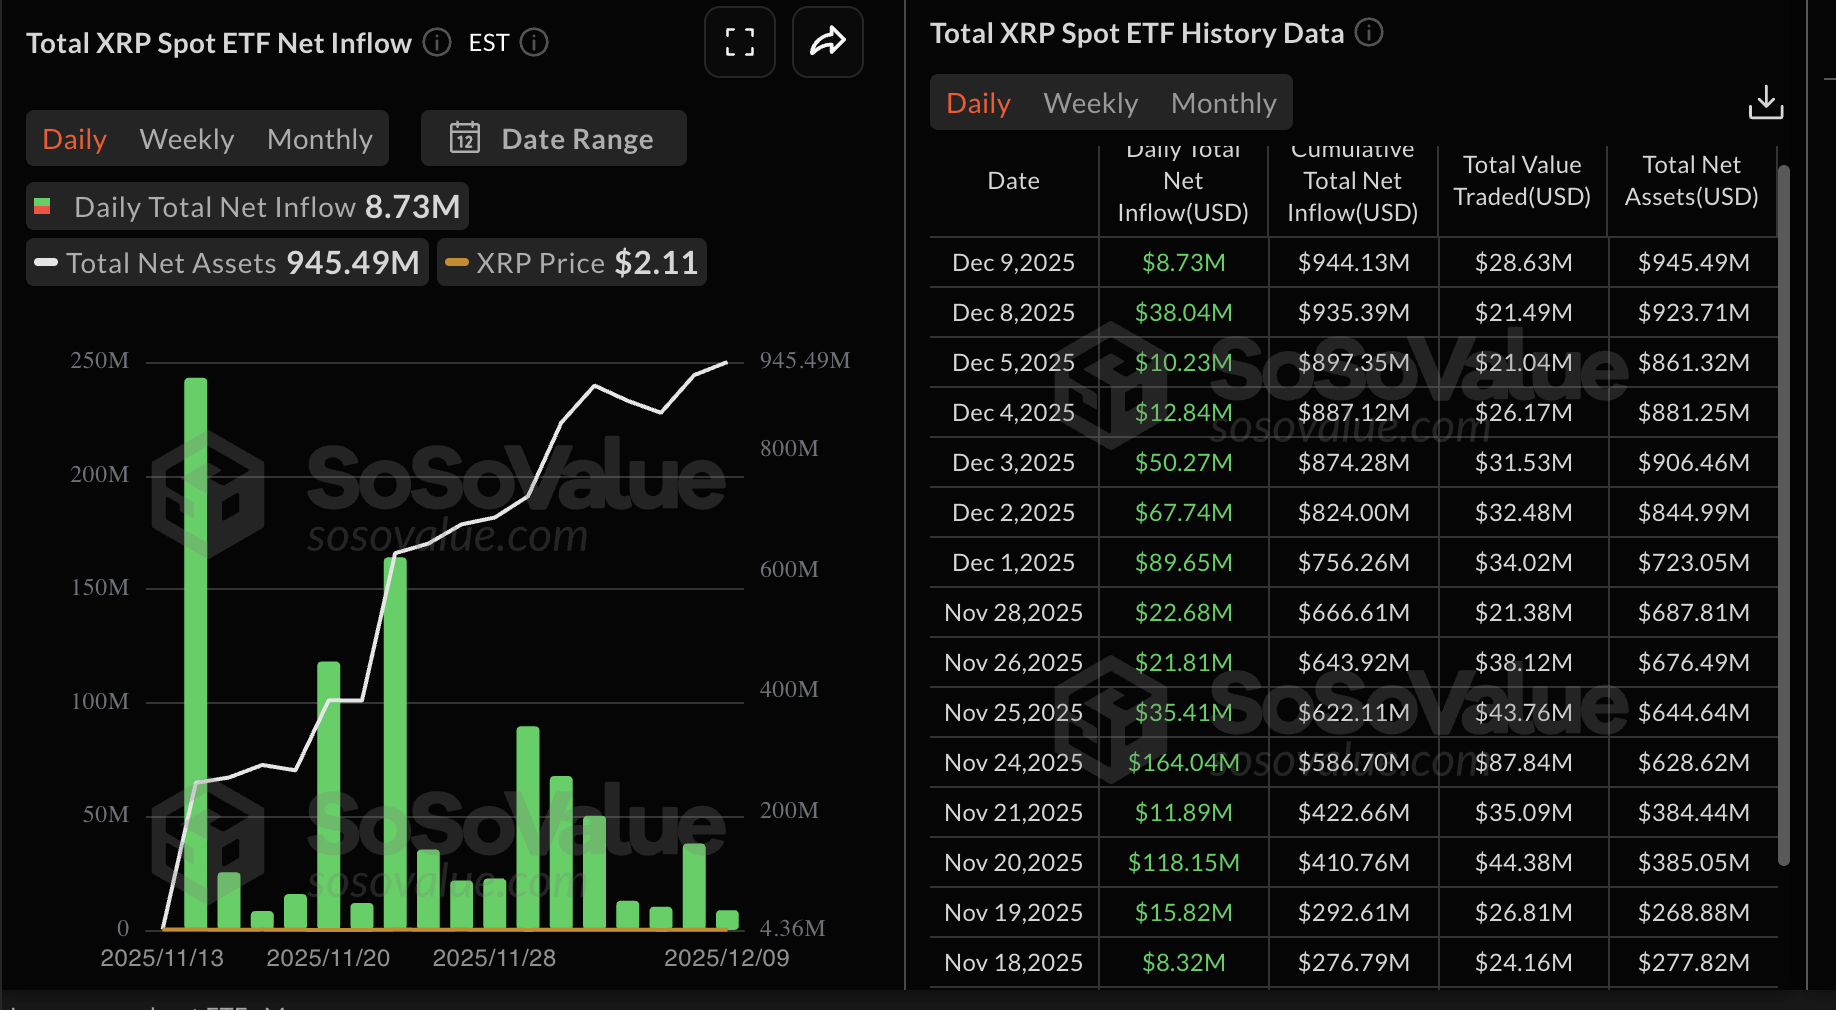
- XRP ETFs extend mild ETF inflows, suggesting declining institutional interest.
Ripple (XRP) is grinding lower, trading at $2.06 at the time of writing on Wednesday, reflecting risk-off sentiment across the cryptocurrency market ahead of the Federal Reserve (Fed) monetary policy decision.
If the central bank meets market expectations and cuts the benchmark rate to a range of 3.50%–3.75%, sentiment surrounding XRP and other riskier assets may improve. Lower interest rates often incentivize traders to increase their risk exposure.
Meanwhile, XRP holds above its $2.00 short-term support following a rejection at Tuesday's high of $2.17, as traders brace for volatility likely to follow the Fed's decision.
XRP recovery stalls amid mild ETF inflow
XRP spot Exchange Traded Funds (ETFs) recorded their 17th consecutive day of inflows, with almost $9 million flowing in on Tuesday. The cumulative inflow volume stands at $944 million, with net assets of $945 million. A break above $1 billion may affirm institutional interest in XRP ETFs.
Meanwhile, demand for XRP derivatives has stabilized, with futures Open Interest (OI) standing at $3.71 billion on Wednesday. OI, which represents the notional value of outstanding futures contracts, is significantly below its record high of $10.94 billion reached in July, suggesting that low retail interest in XRP may be suppressing a recovery.
Technical outlook: XRP declines seeking liquidity
XRP is trading at $2.06 at the time of writing on Wednesday, down from the day's open at $2.10. The cross-border money remittance token also sits below the 50-day Exponential Moving Average (EMA) at $2.26, the 100-day EMA at $2.42 and the 200-day EMA at $2.46, which maintain a bearish outlook as they slope lower and cap rebounds.
The Moving Average Convergence Divergence's (MACD) line is hovering near the red signal line on the daily chart and the histogram bars remain relatively flat, suggesting lackluster momentum. With the Relative Strength Index (RSI) at 43.94 (neutral-bearish) and declining, buying interest could be subdued below the 50 midline in the short term.
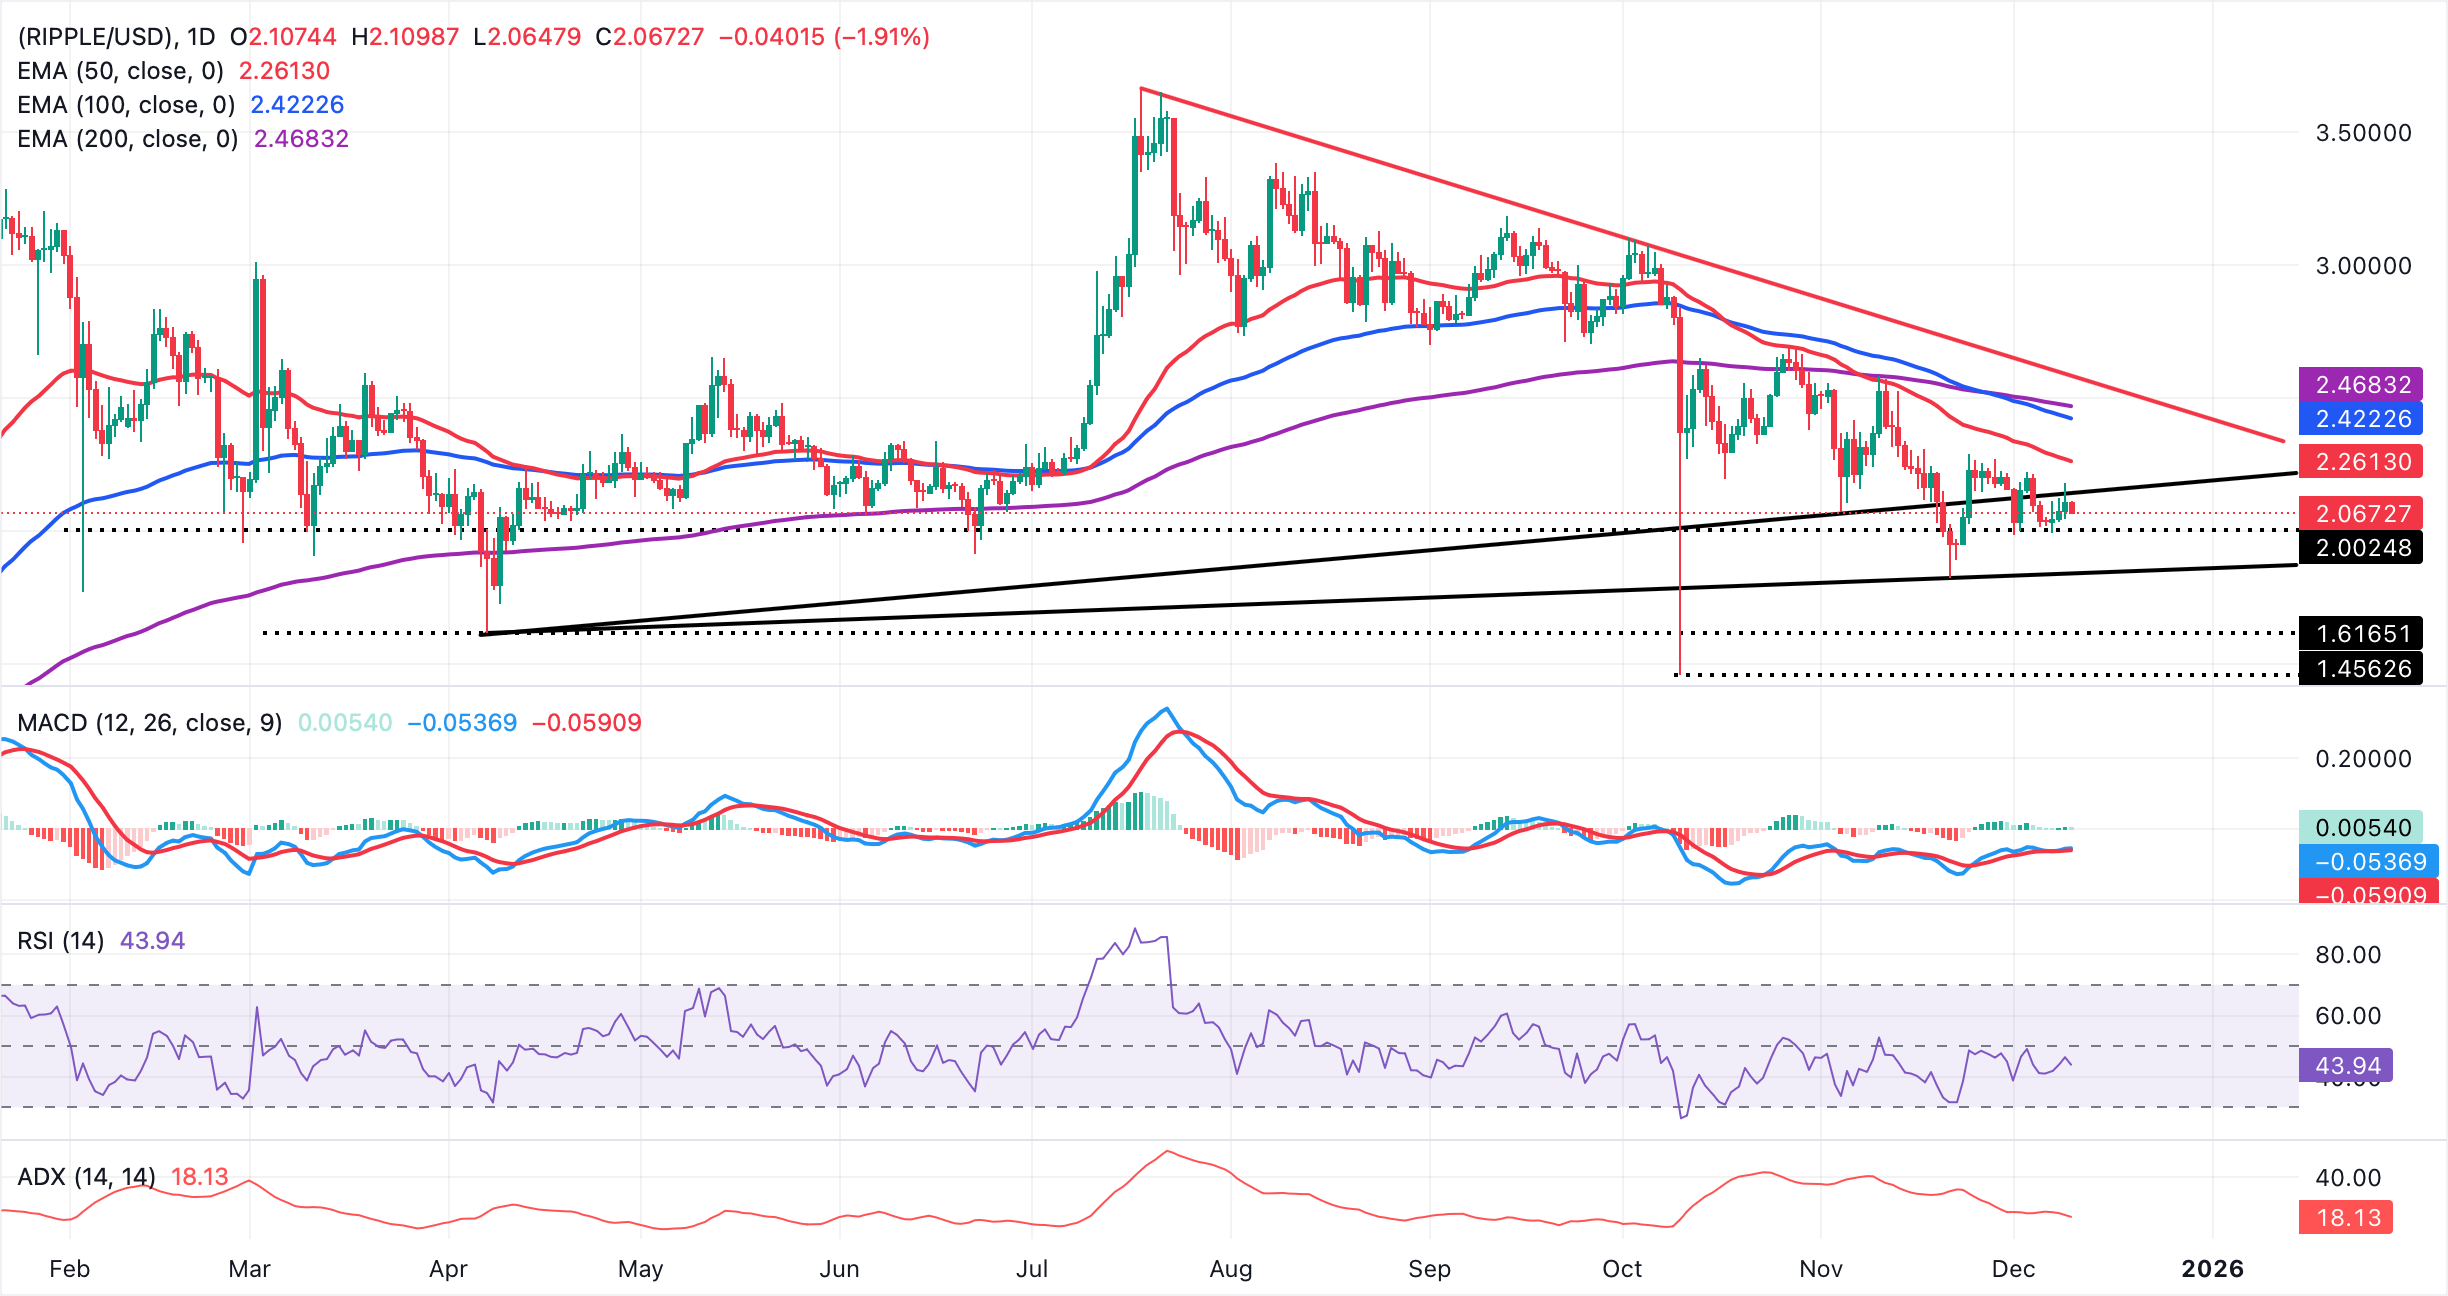
Still, the descending trend line from XRP's record high of $3.66 limits gains, with resistance seen at $2.57. The rising trend line from April's support at $1.61 underpins a potential bullish bias, offering support near $1.82. A daily close above the 50-day EMA at $2.26 would ease pressure and could open a recovery toward the 100-day EMA at $2.42. Failure to hold rising support would expose the downside. Overall, bears may stay in control until the XRP price reclaims the moving averages as support and momentum improves.
Cryptocurrency metrics FAQs
The developer or creator of each cryptocurrency decides on the total number of tokens that can be minted or issued. Only a certain number of these assets can be minted by mining, staking or other mechanisms. This is defined by the algorithm of the underlying blockchain technology. On the other hand, circulating supply can also be decreased via actions such as burning tokens, or mistakenly sending assets to addresses of other incompatible blockchains.
Market capitalization is the result of multiplying the circulating supply of a certain asset by the asset’s current market value.
Trading volume refers to the total number of tokens for a specific asset that has been transacted or exchanged between buyers and sellers within set trading hours, for example, 24 hours. It is used to gauge market sentiment, this metric combines all volumes on centralized exchanges and decentralized exchanges. Increasing trading volume often denotes the demand for a certain asset as more people are buying and selling the cryptocurrency.
Funding rates are a concept designed to encourage traders to take positions and ensure perpetual contract prices match spot markets. It defines a mechanism by exchanges to ensure that future prices and index prices periodic payments regularly converge. When the funding rate is positive, the price of the perpetual contract is higher than the mark price. This means traders who are bullish and have opened long positions pay traders who are in short positions. On the other hand, a negative funding rate means perpetual prices are below the mark price, and hence traders with short positions pay traders who have opened long positions.
(The technical analysis of this story was written with the help of an AI tool)

Acuity Trading 是一家成立於 2013 年、總部位於倫敦的金融科技公司,專注於 AI 驅動的另類數據與情緒分析,用於交易與投資。他們以可視化新聞與情緒工具革新線上交易體驗,並持續以最新 AI 研究與技術提供可產生阿爾法的另類數據與高度互動的交易工具。
閱讀更多


