
Bitcoin Price Forecast: Falling-knife risks grow as BTC breaches $75,000
作者 Manish Chhetri
發布日期: 2 Feb 2026 | 修改日期: 2 Feb 2026


熱門文章

Bitcoin (BTC) price steadies at $76,400 at the time of writing on Monday after slipping below $75,000 during the early Asian session.
- Bitcoin price recovers slightly after slipping below $75,000 during the early Asian session on Monday.
- The crypto market correction intensifies, triggering liquidations totaling nearly $800 million over the last 24 hours.
- US-listed spot ETFs recorded a weekly outflow of $1.49 billion on Friday, extending withdrawals to a second consecutive week.
Bitcoin (BTC) price steadies at $76,400 at the time of writing on Monday after slipping below $75,000 during the early Asian session. The broader crypto market remains under pressure, with nearly $800 million in liquidations over the last 24 hours, and institutional demand for the King crypto continues to decline.
Liquidation of nearly $800 million in 24 hours
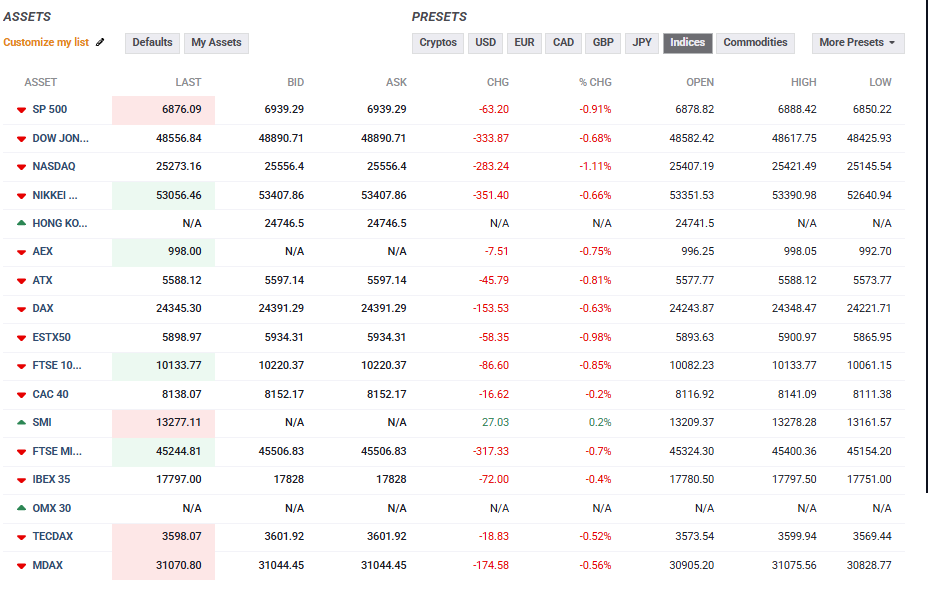
Bitcoin price begins the week on a negative note, slipping below $75,000 during the early asian trading session on Monday. The global market also opens the week on a negative note, with major indexes trading red as of writing in the early European trading session, as shown in the chart below.
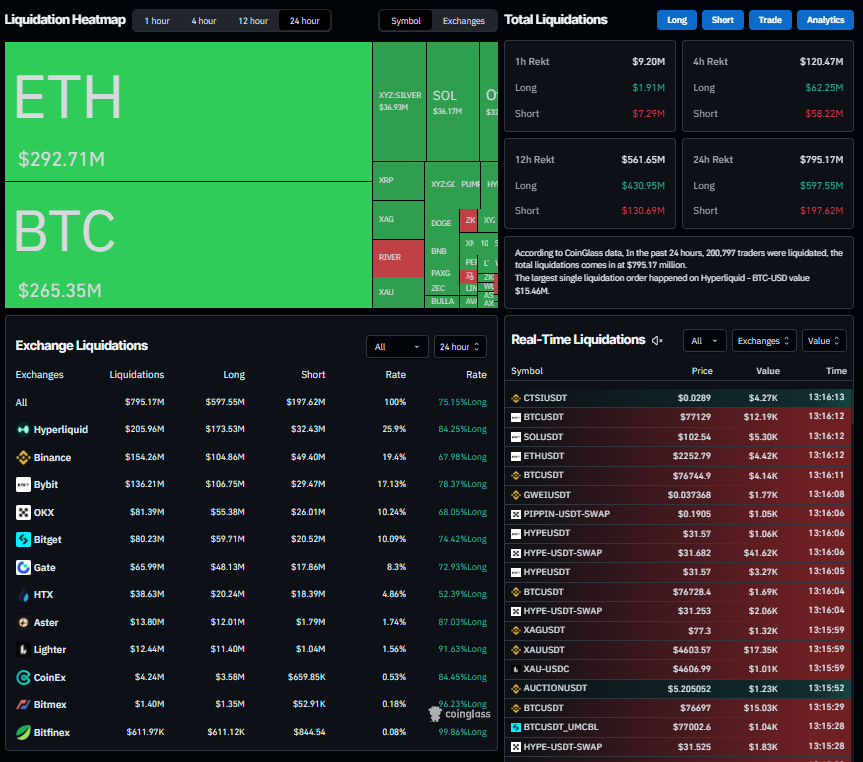
The cryptocurrency market has experienced a sharp downturn over the past 24 hours, with total liquidations of nearly $800 million, according to Coinglass data. Of these, 75% were long positions, indicating bullish overexposure among traders. Over 201,000 traders were liquidated, and the largest single liquidation occurred on Hyperliquid exchange, where a BTC/USD position worth $15.46 million was liquidated. Traders should be cautious, as such price dips could trigger further liquidation among leverage traders.
Fading institutional demand
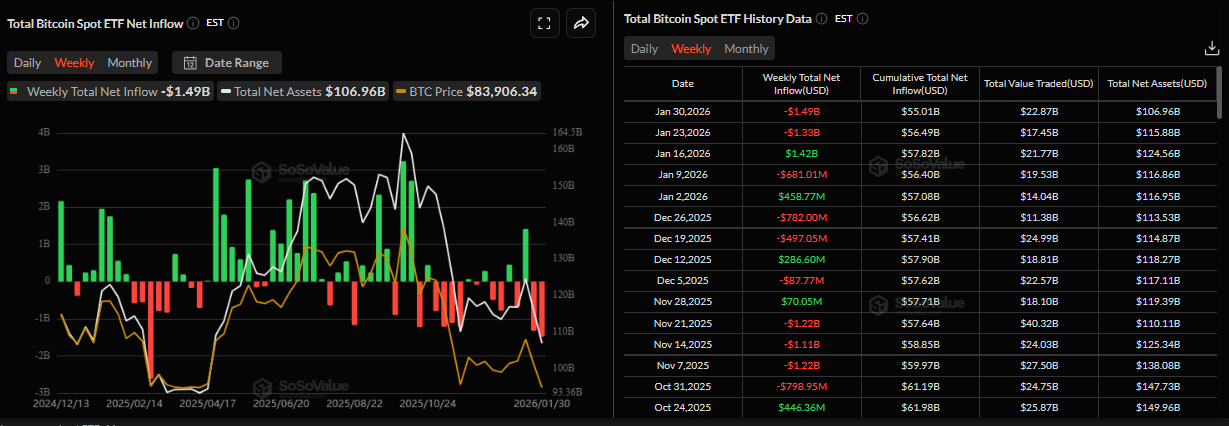
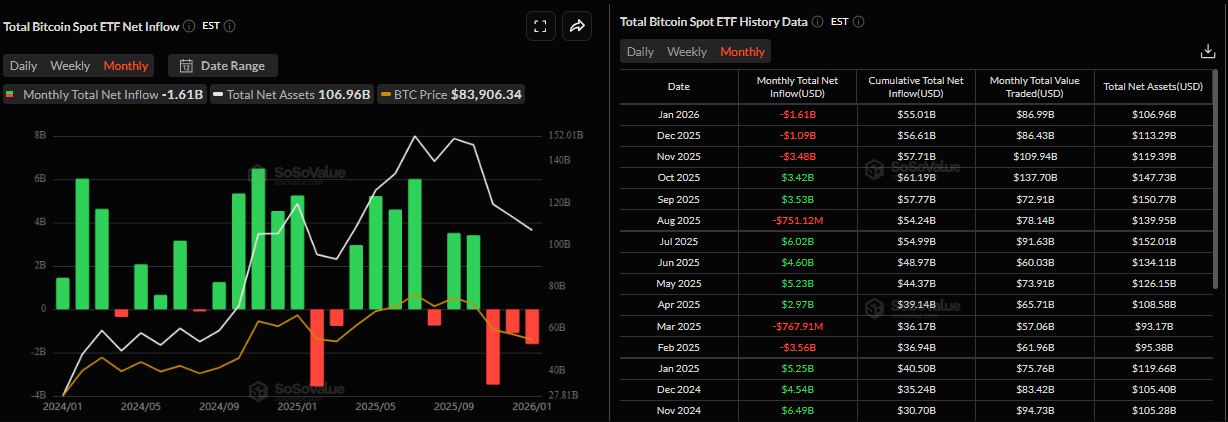
Bitcoin price dips were further supported by fading institutional demand. The SoSoValue chart below shows that spot Bitcoin Exchange-Traded Funds (ETFs) recorded a total outflow of $1.49 billion last week, marking their second consecutive weekly outflow. On the monthly chart, January withdrawals totaled $1.61 billion, marking the third consecutive month of outflows. If the institutional demand continues to weaken and intensify, BTC could see further correction.
On the corporate front, Strategy (MSTR), the largest corporate holder of Bitcoin with 712,647 BTC on its balance sheet, has slipped into unrealized losses as Bitcoin prices fell below $75,000.
With the firm’s average purchase price at $76,037, this marks the first time since October 2023 that its Bitcoin holdings have moved into the red, highlighting the growing pressure on corporate treasuries amid the ongoing market correction.
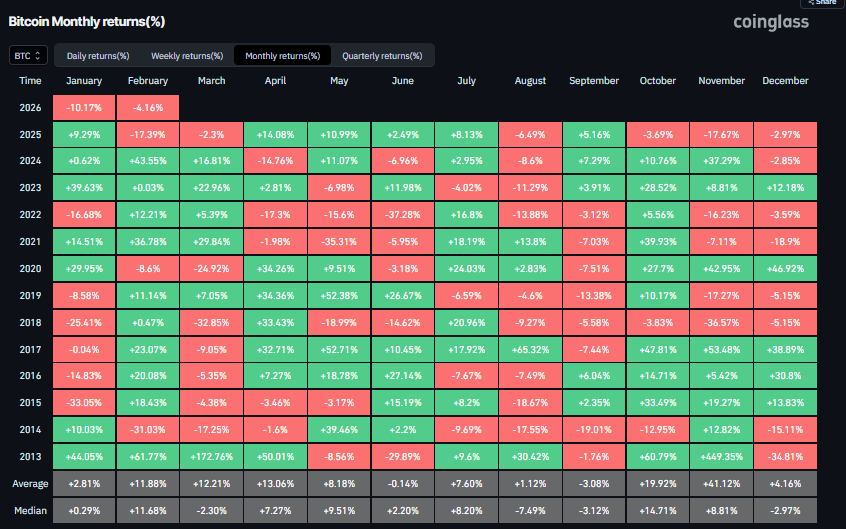
What’s there for BTC in February?
Bitcoin began the year with a double-digit decline, ending the month with a negative return of around 10%. According to Bitcoin’s historical data, BTC generally yielded the second-highest median returns of 11.68% in February. However, this optimistic outlook for this month should come with a recovery of ETF demand, crypto-favoring legislation passes, and improving investor risk appetite .
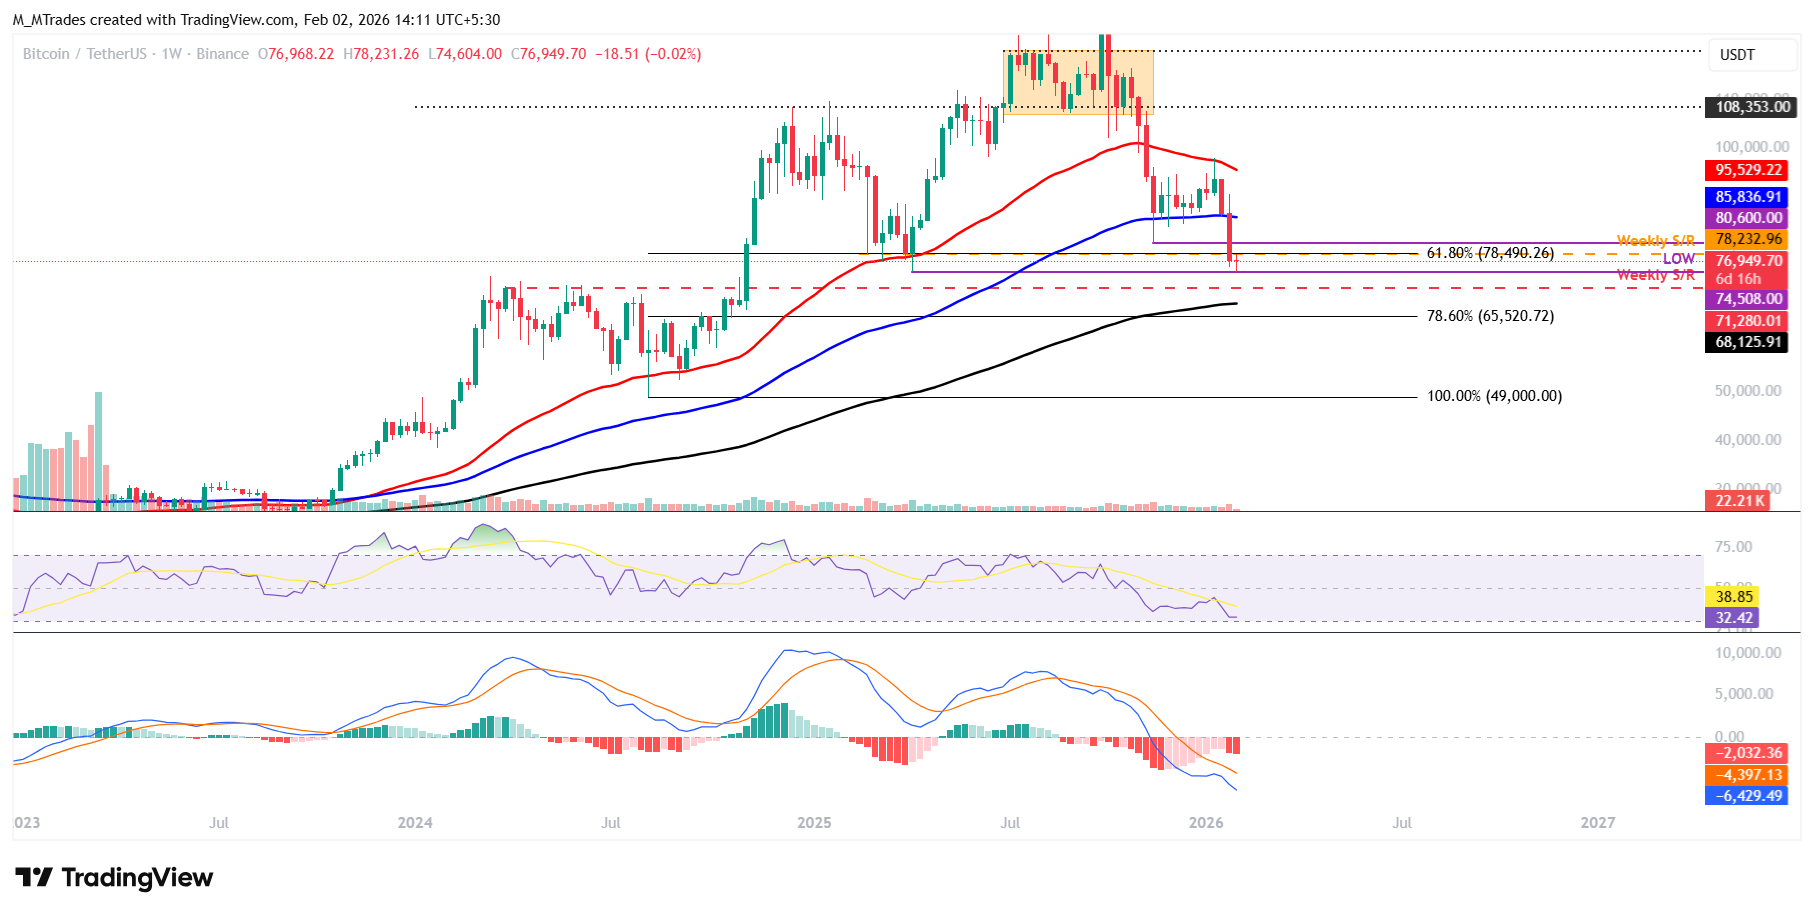
Bitcoin Price Forecast: Is a falling-knife scenario in play?
Bitcoin’s weekly chart closed below the 200-week Exponential Moving Average (EMA) at $85,836 and the the 61.8% Fibonacci retracement level (drawn from the August 2024 low of $49,000 to the October 2025 all-time high of $126,199) at $78,490 last week.
Since mid-January, the BTC price has been dropping sharply, by nearly 18% in two weeks. This market situation suggests a falling-knife scenario. Traders should be cautious: attempting to buy the dip remains risky, as the downside may not be complete yet. As of this week on Monday, BTC continued its correction, retesting the April 2025 low of $74,508.
If BTC continues its correction, it could extend the fall toward the next weekly support at $71,280.
The Relative Strength Index (RSI) on the weekly chart is at 32, nearing the oversold territory, indicating strong bearish momentum. Moreover, the Moving Average Convergence Divergence (MACD) indicator on the same chart also showed a bearish crossover in mid-August, which remains intact, further supporting the negative outlook.
On the daily chart, Bitcoin price closed below the lower boundary of the horizontal channel pattern at $85,569 on Thursday and corrected by over 9% through Sunday. At the time of writing on Monday, BTC is trading at $76,400.
If BTC continues its correction, it could extend the decline toward the key psychological level at $70,000.
The RSI on the daily chart reads 22, an extreme oversold condition, indicating strong bearish momentum. The MACD also showed a bearish crossover on January 20, which remains intact and thus further supports the negative outlook.
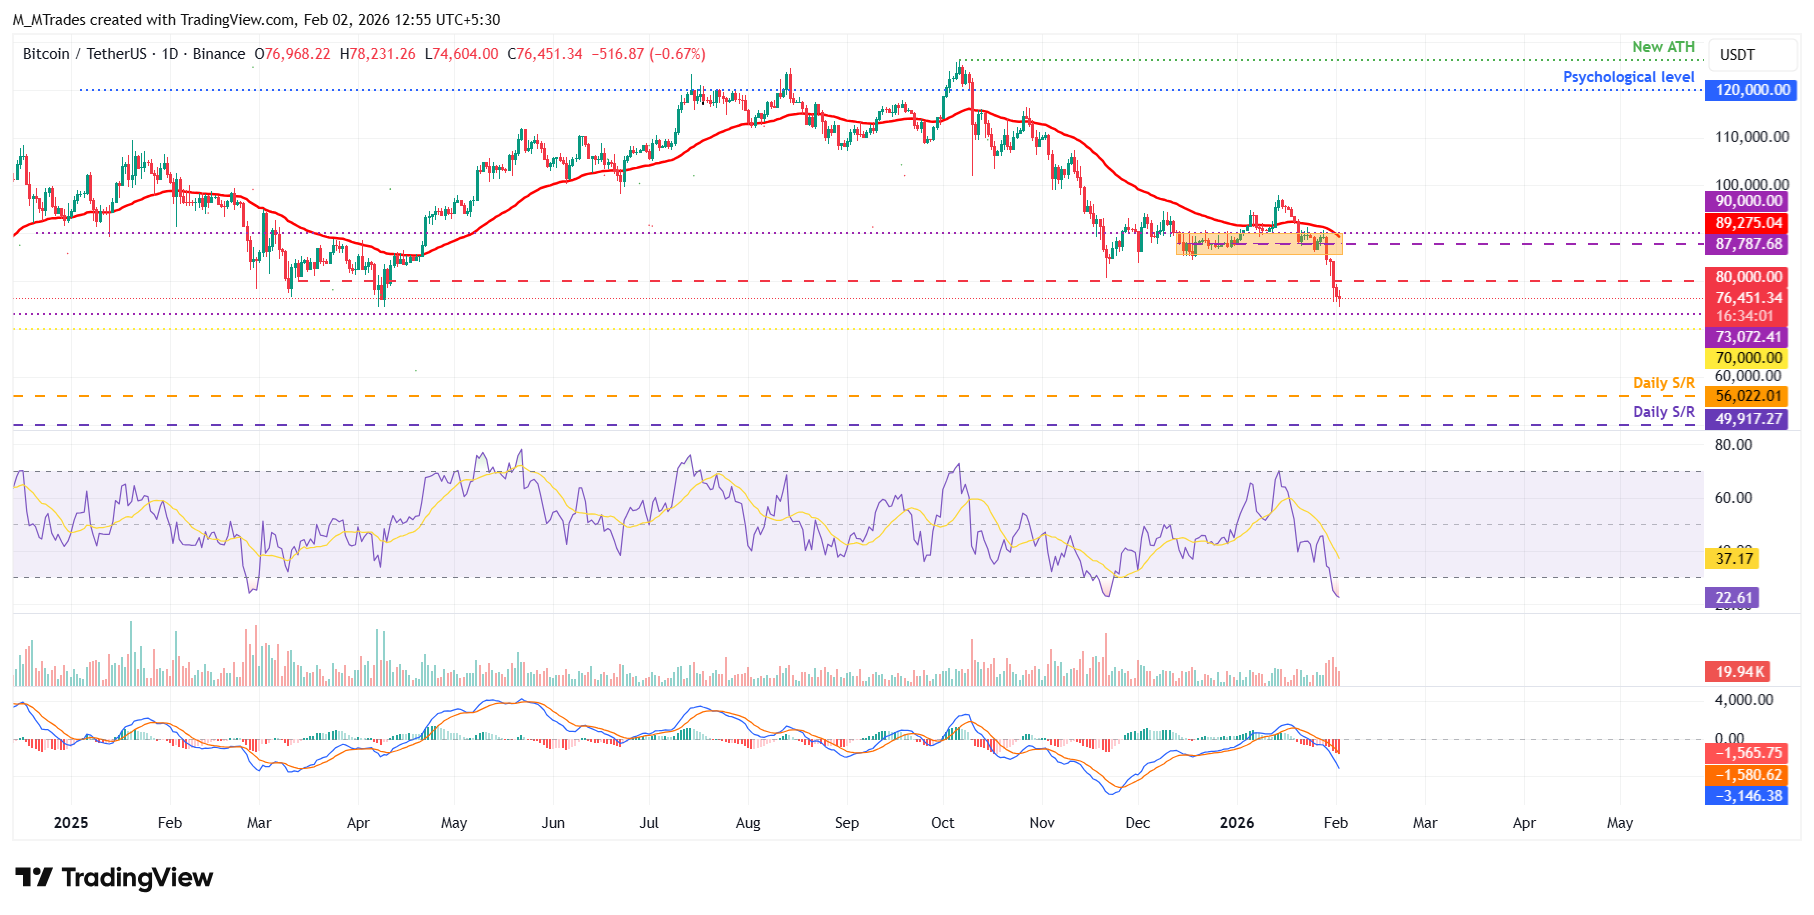
If BTC recovers, the first significant resistance emerges at $80,000, a key psychological threshold.

超過一百萬用戶依賴 FXStreet 獲取即時市場數據、圖表工具、專家洞見與外匯新聞。其全面的經濟日曆與教育網路研討會協助交易者保持資訊領先、做出審慎決策。FXStreet 擁有約 60 人的團隊,分布於巴塞隆納總部及全球各地。
閱讀更多


