
Crypto Today: Bitcoin, Ethereum, XRP extend sell-off amid negative funding rates
作者 John Isige
發布日期: 11 Feb 2026 | 修改日期: 11 Feb 2026


熱門文章

Bitcoin (BTC) is logging its third consecutive day of declines, trading slightly below $67,000 at the time of writing on Wednesday. The Crypto King is down 15% in February and looks poised to extend its losses toward the yearly low of $60,000.
- Bitcoin trades under pressure as the price slides below $67,000, weighed down by declining retail interest.
- Ethereum's upside is constrained below $2,152 resistance as traders increasingly pile into short positions.
- XRP extends losses to $1.36 as futures Open Interest fades and crypto market sentiment holds in extreme fear.
Bitcoin (BTC) is logging its third consecutive day of declines, trading slightly below $67,000 at the time of writing on Wednesday. The Crypto King is down 15% in February and looks poised to extend its losses toward the yearly low of $60,000.
Ethereum (ETH) and Ripple (XRP) are following in Bitcoin's footsteps, weighed down by a weak derivatives market. Risk-off sentiment has seen the Crypto Fear & Greed index plunge into extreme fear.
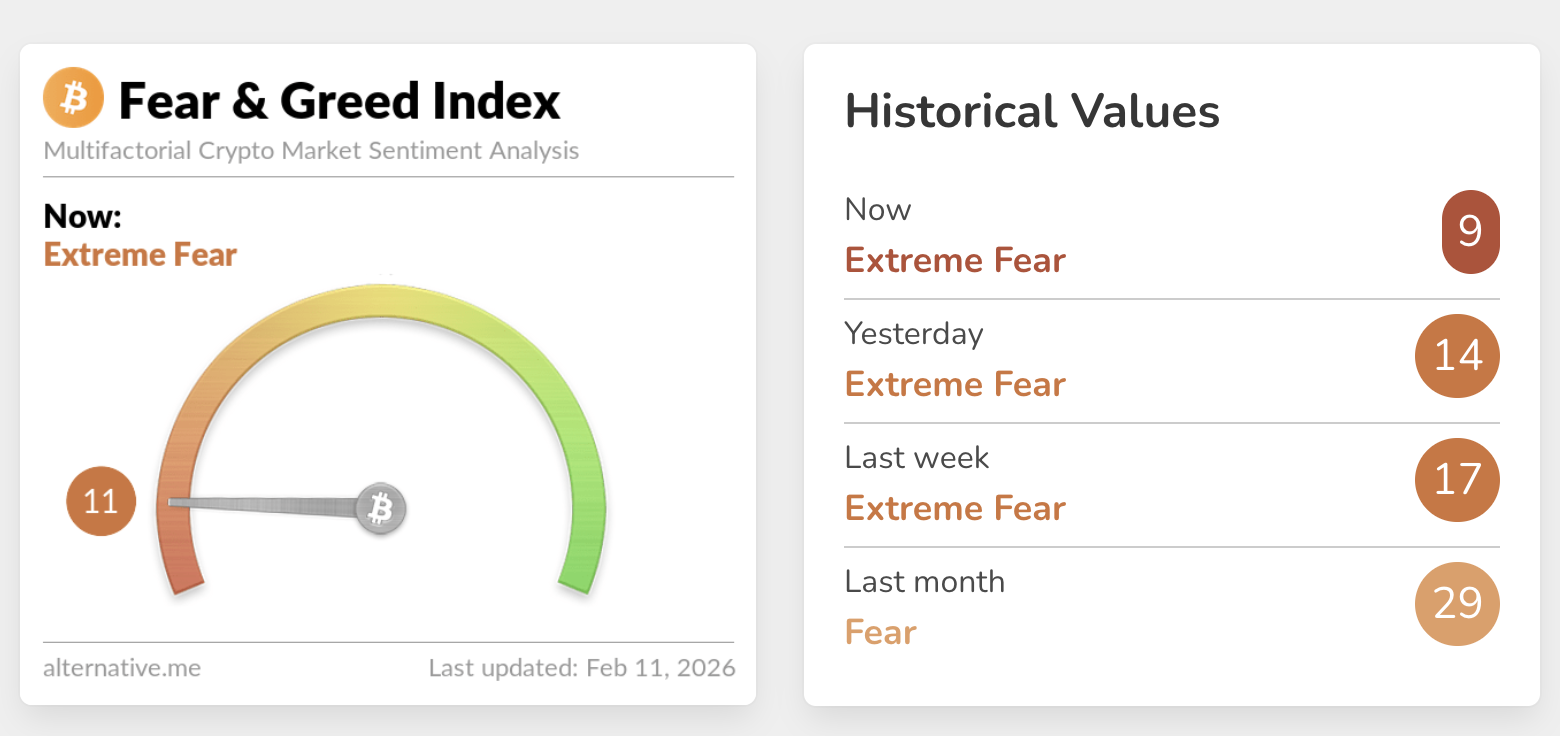
According to Alternative, extreme fear conditions are often a signal for the market bottoming and ushering in a new bullish phase. However, weak technicals, macroeconomic uncertainty, and negative funding rates are among the factors likely to keep investors on the sidelines.
Bitcoin, Ethereum and XRP slide, weighed down by weak derivatives
Investors are increasingly piling into short, leveraged positions, further destabilizing Bitcoin's price, which recovered to $72,271 on Sunday before correcting on Monday.
Weak derivatives characterise Bitcoin's micro-environment, as reflected in the futures Open Interest (OI) Weighted Funding Rate, which slumps to -0.0014% on Wednesday, down from 0.0031% on Tuesday. This dip suggests that traders remain cautious, largely unwilling to lean into risk.
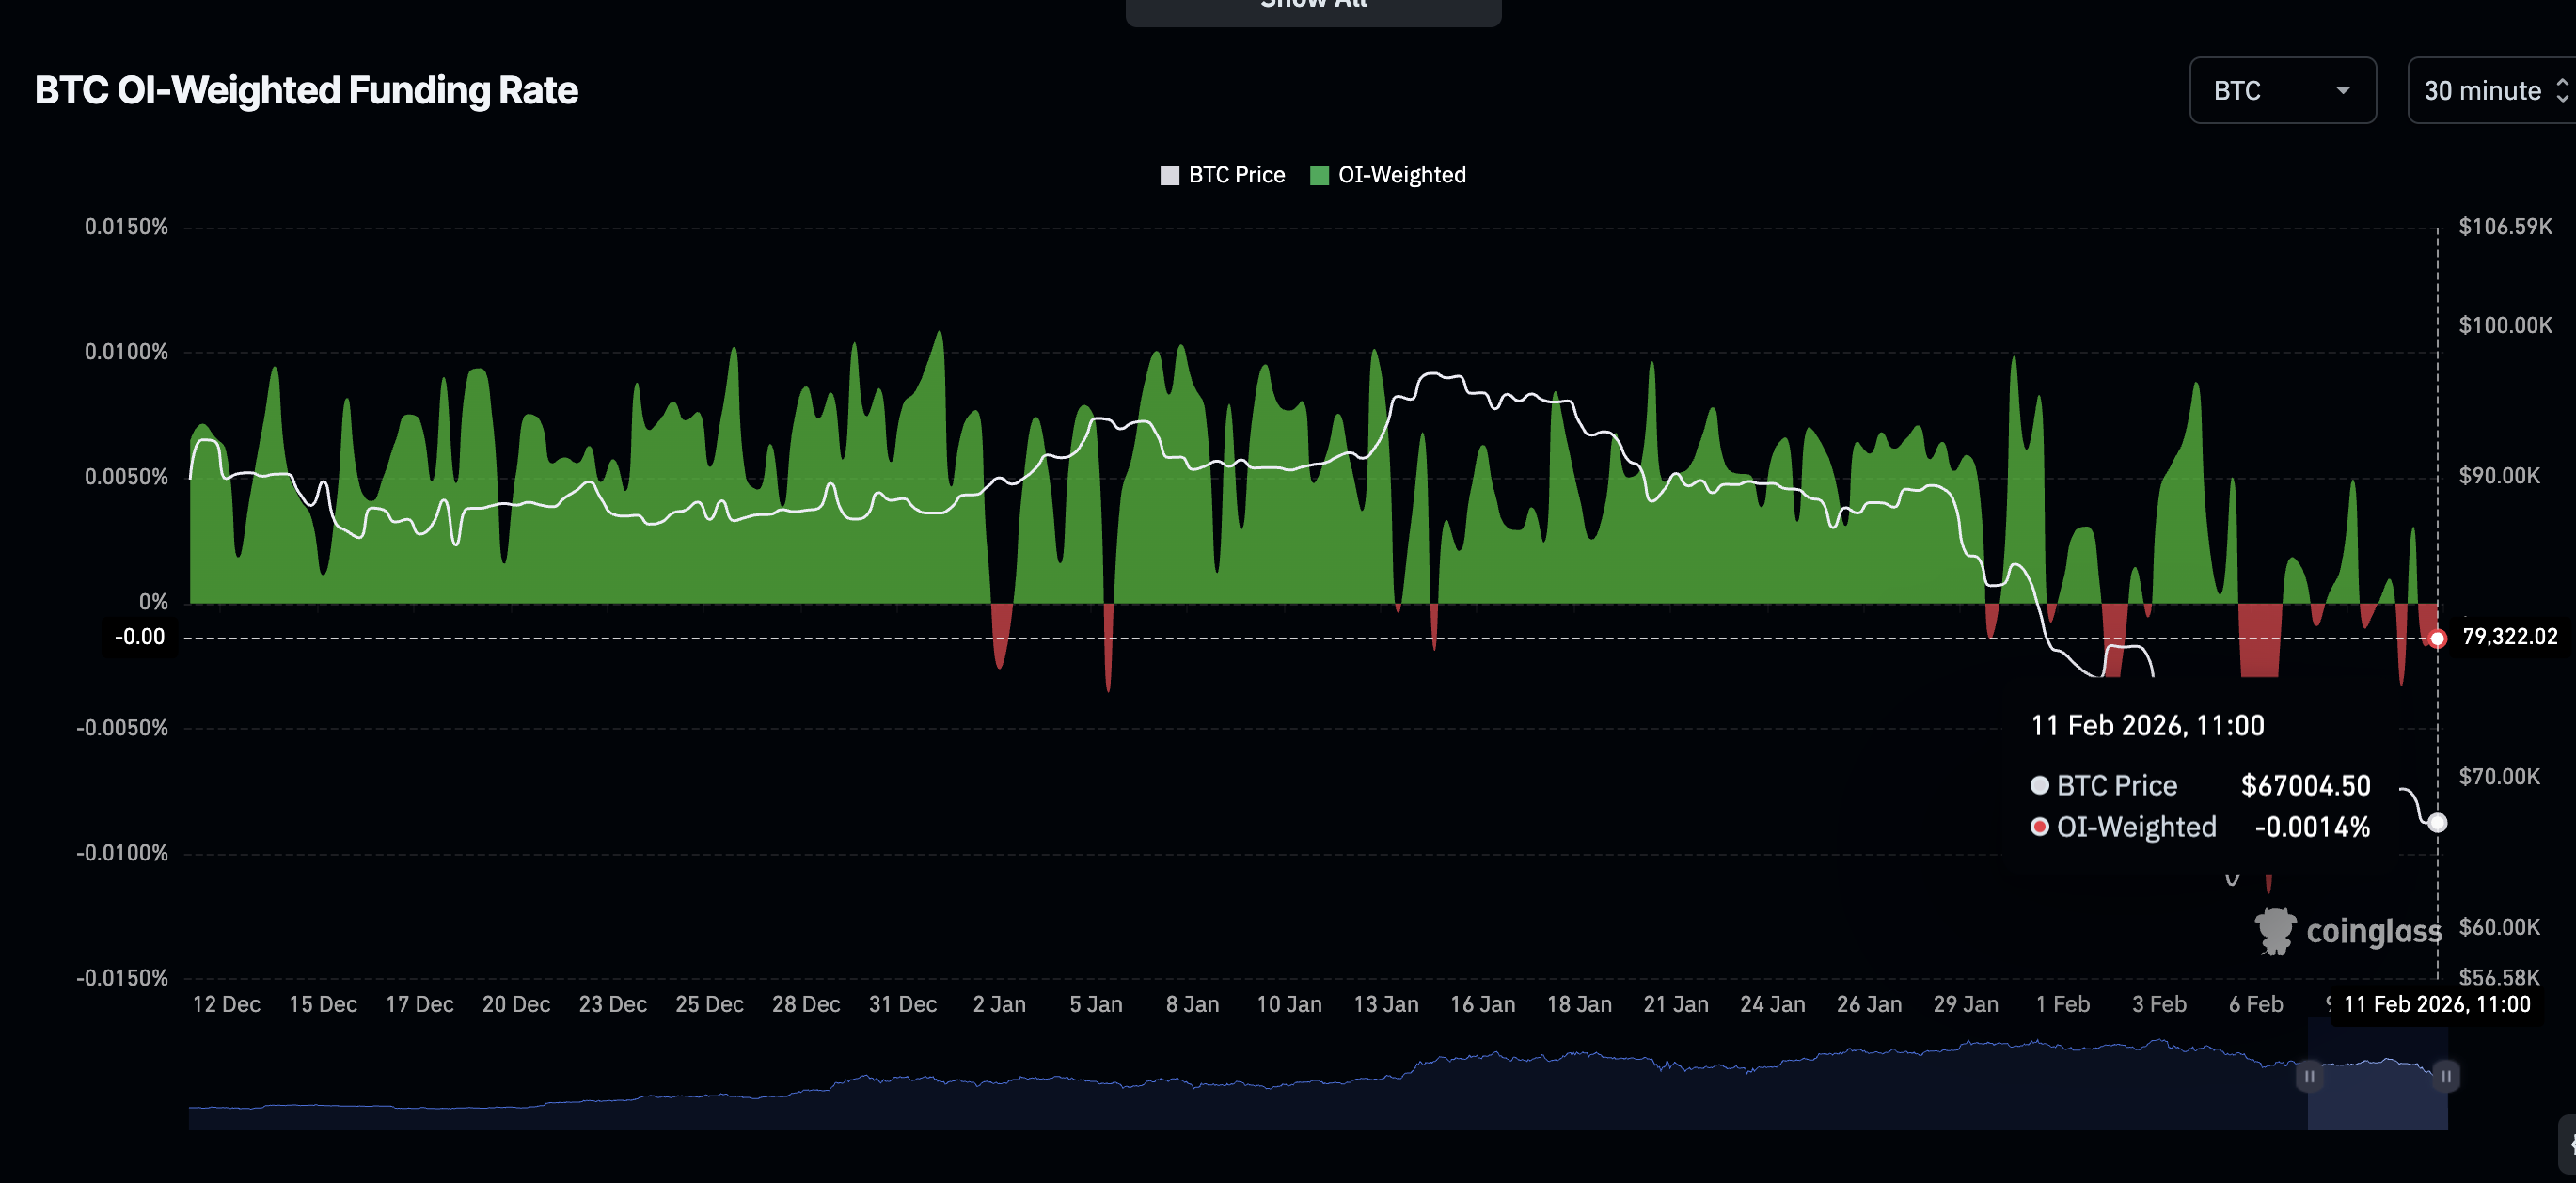
A K33 Research report released on Tuesday states that "BTC perpetual funding rates collapsed, hitting -15.5% on February 6 and pushing the 7-day average annualized funding rate to its lowest level since September 2024."
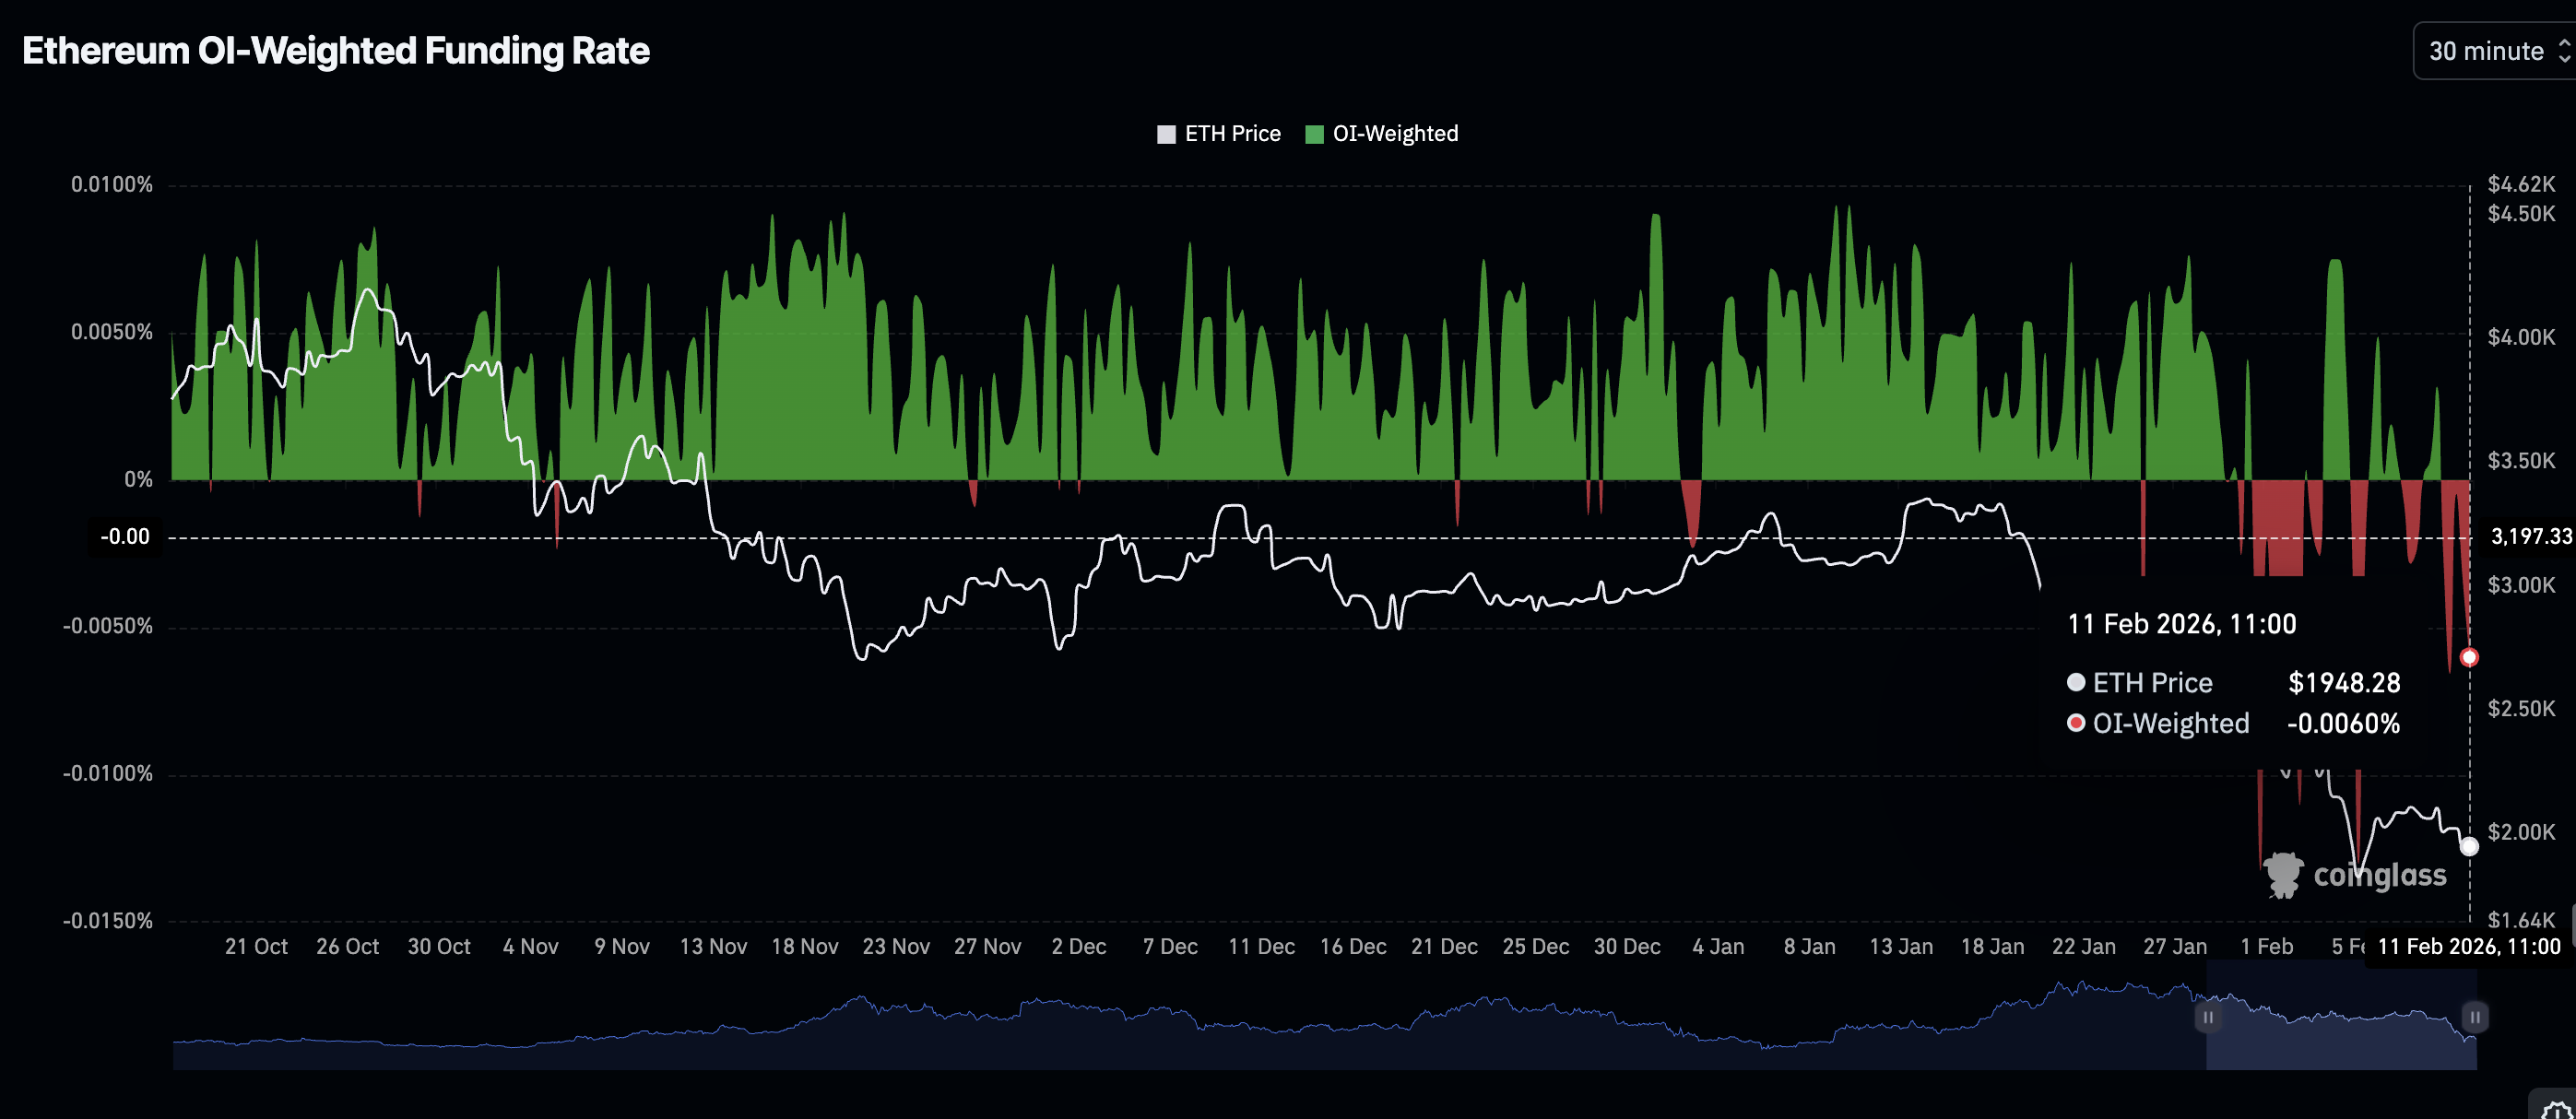
Ethereum paints a similar grim outlook, with the OI-Weighted Funding Rate remaining in negative territory at -0.0060% on Wednesday, a slight improvement from -0.0066% on Tuesday.
XRP, on the other hand, has incessantly fallen in the negative OI-Weighted Funding Rate region for five consecutive days from Sunday's -0.0092% to Wednesday's -0.0006%.
A sustained recovery could remain a pipe dream if traders increasingly pile into short, leveraged positions, leaving XRP's downside vulnerable amid the growing risk of another sell-off.
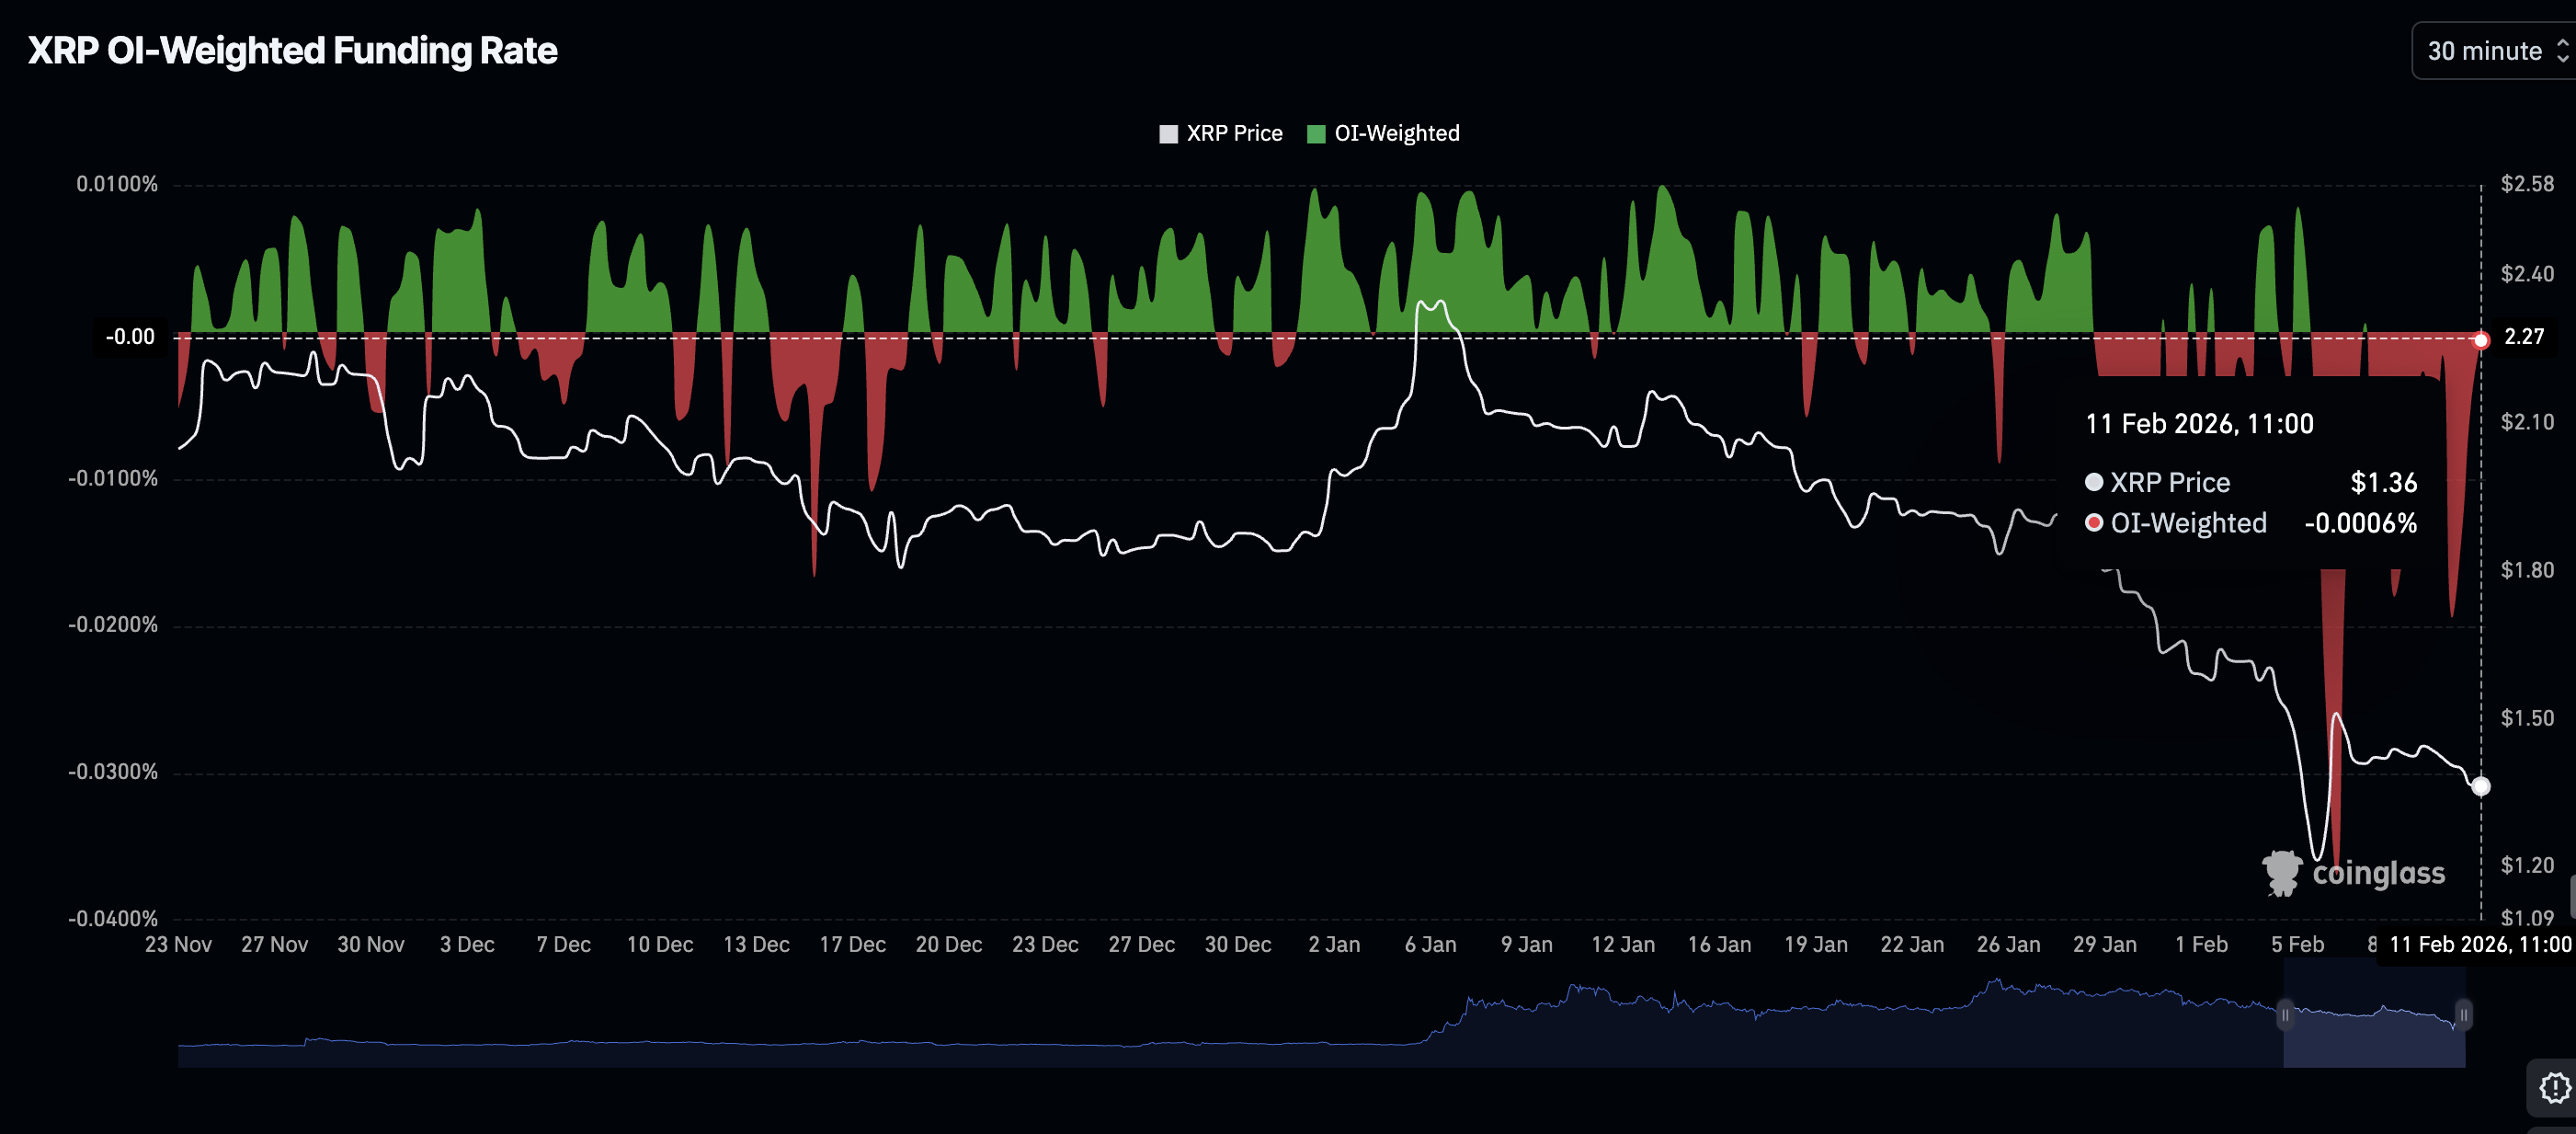
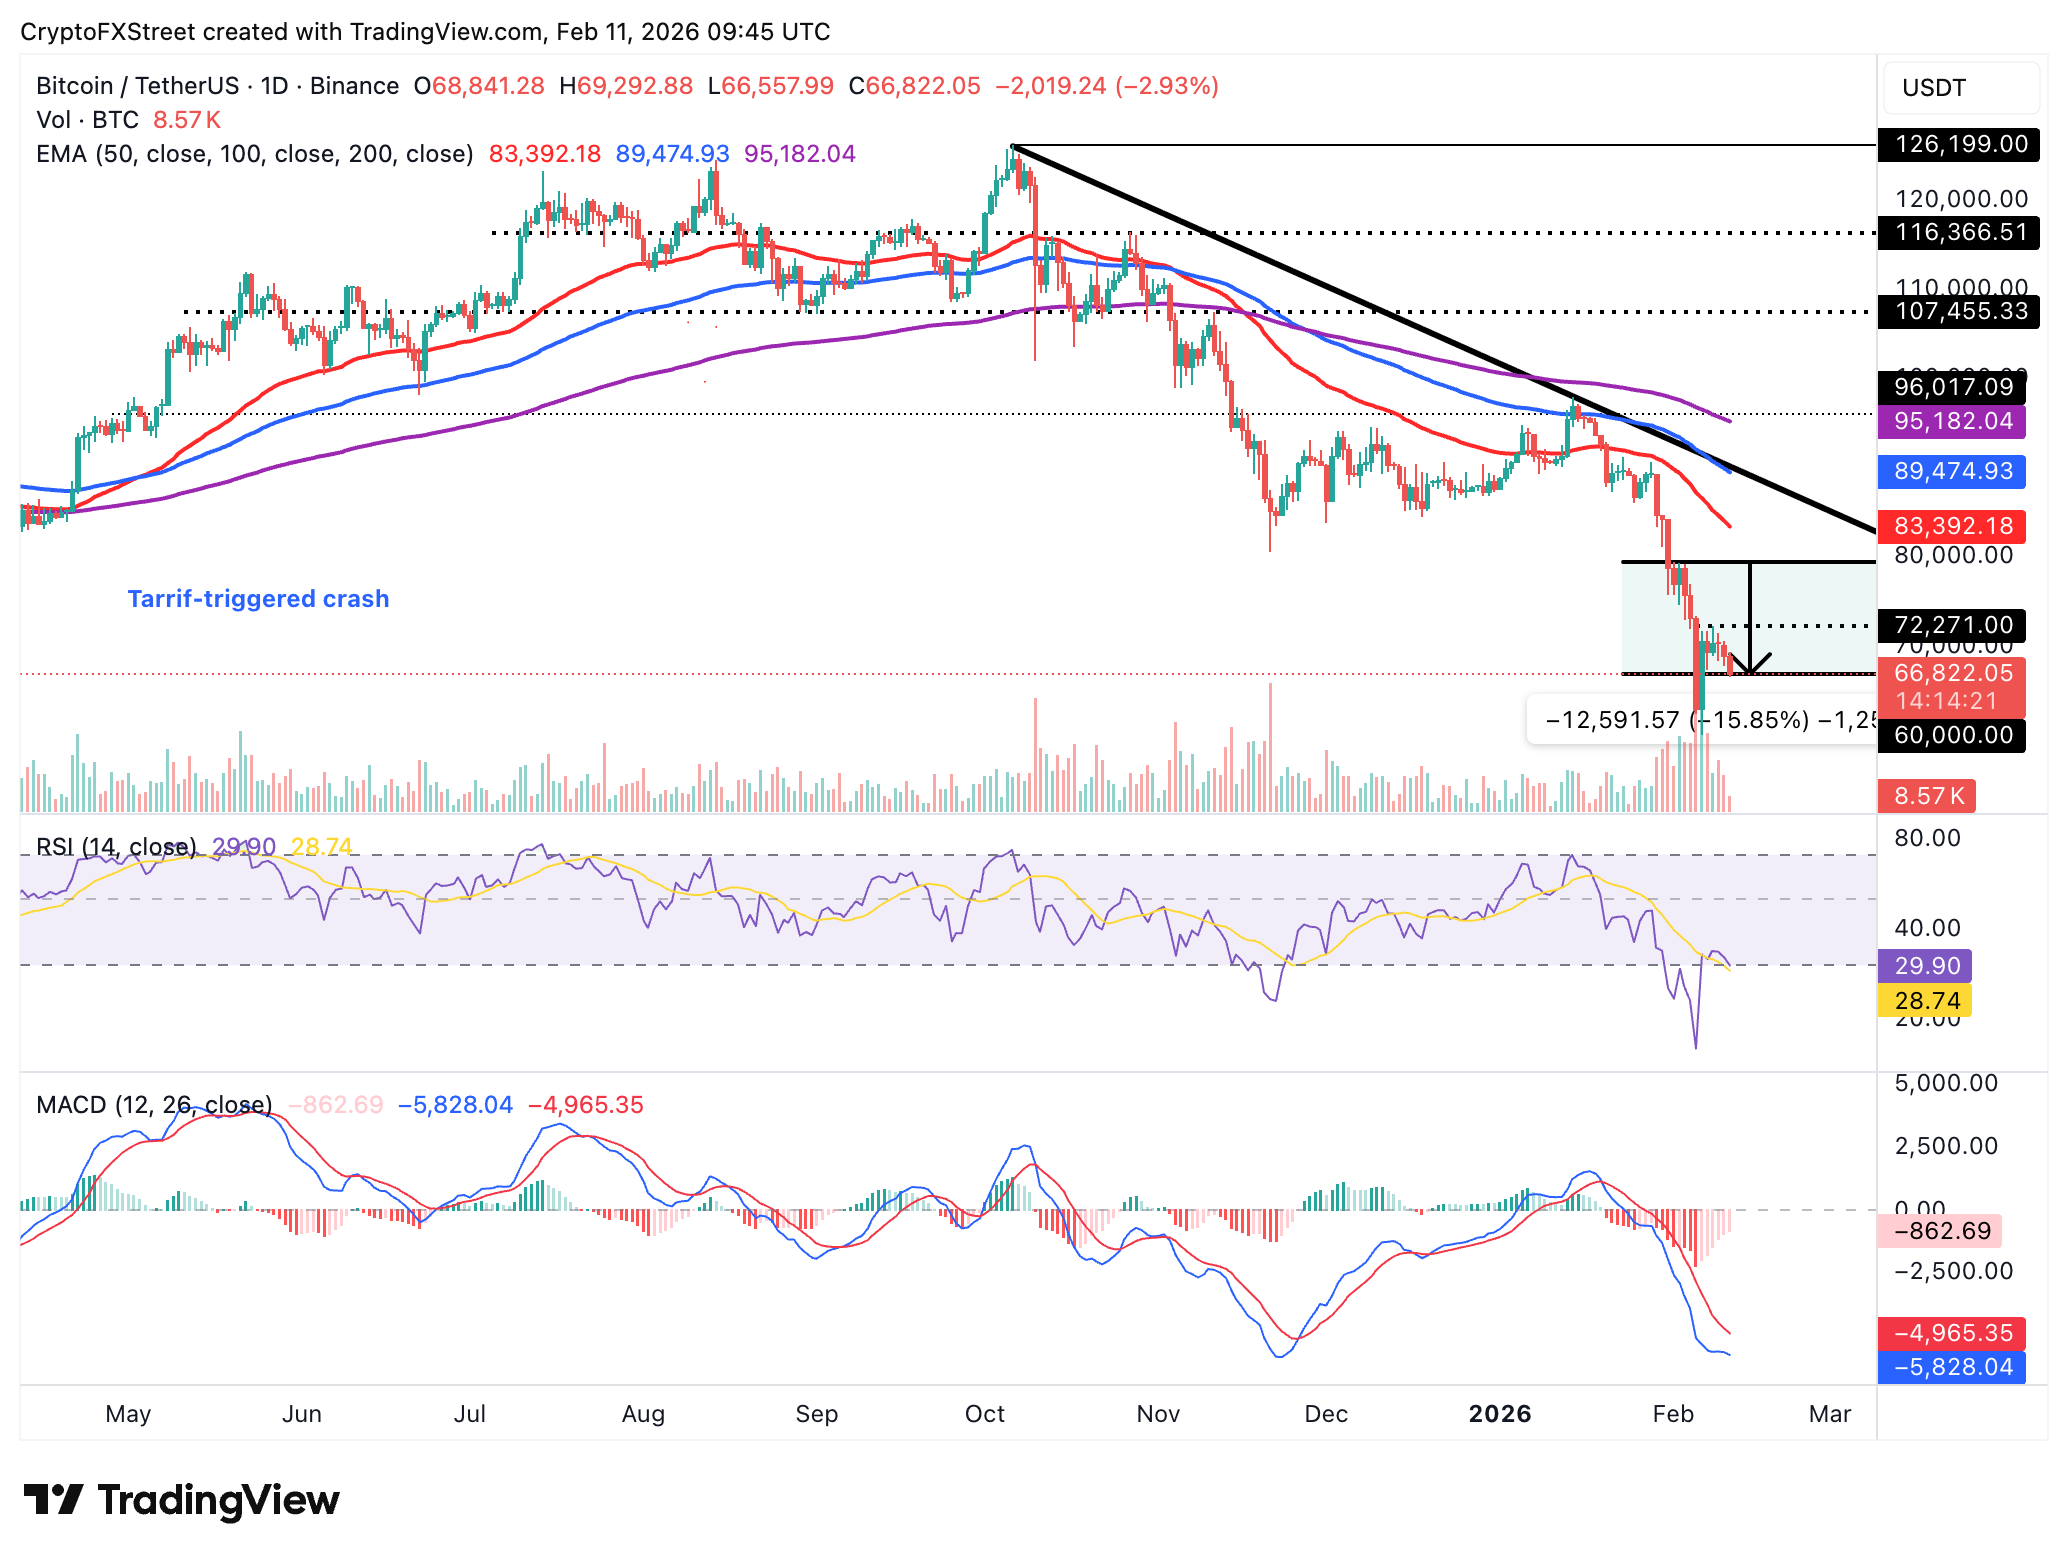
Chart of the day: Bitcoin's downtrend persists
Bitcoin falls below $67,000 as selling pressure intensifies across the crypto market on Tuesday. The downward-facing 50-day Exponential Moving Average (EMA) at $83,392, the 100-day EMA at $89,475 and the 200-day EMA at $95,182 uphold the overall bearish momentum.
At the same time, the Relative Strength Index (RSI) at 29 on the daily chart is back in oversold territory, indicating that sellers are largely in control. Meanwhile, the Moving Average Convergence Divergence (MACD) indicator remains below its signal line, suggesting investors may continue to sell BTC.
However, the red histogram bars are contracting, suggesting a shift into bullish momentum. A reversal above the $70,000 pivotal level remains critical for recovery. Short-term signals are negative, proposing Bitcoin is likely to retest the next support level around $65,000.
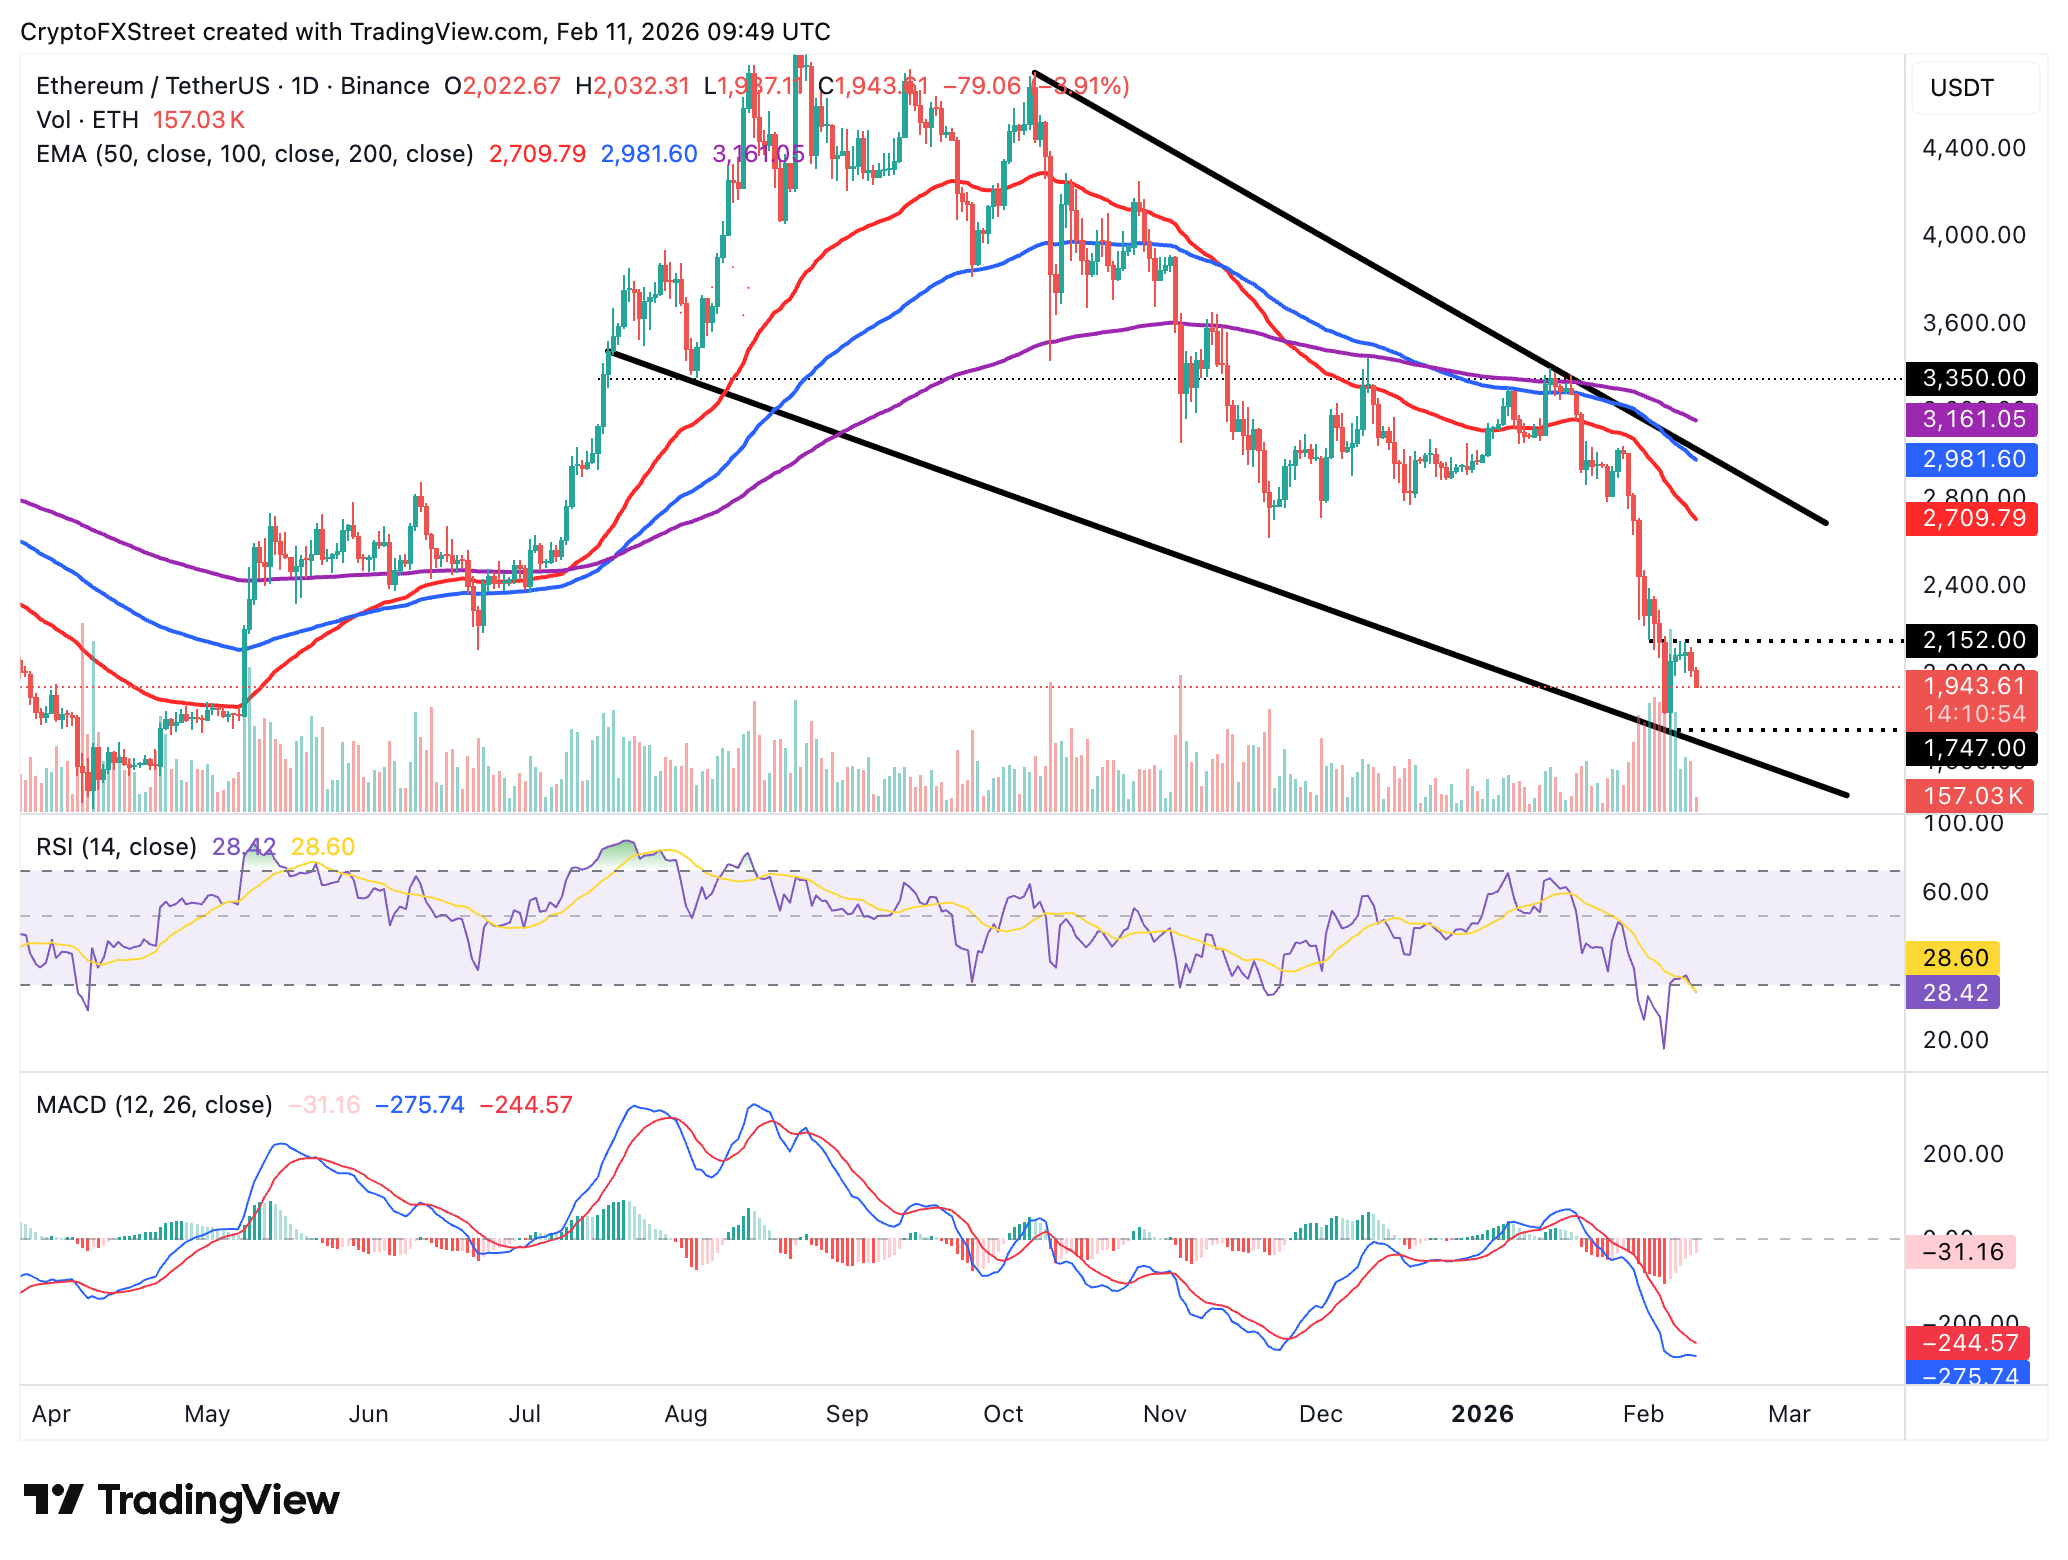
Altcoins technical outlook: Ethereum, XRP extend losses
Ethereum is trading down toward $1,900 while its upside is limited by resistance at $2,152, last tested on Monday. The primary outlook is bearish, as reflected by the RSI at 28 on the daily chart, which is in oversold territory. Failure to rebound at $1,900 could push ETH toward Friday's low at $1,747.
The path of least resistance remains downward, as the MACD indicator remains below its signal line on the same daily chart. If the contracting red histogram bars flip above the zero line, Ethereum's outlook may shift from defence mode into recovery. Key targets on the upside include the supply at $2,152 and the next hurdle at $2,400 if risk-on sentiment returns.
XRP, on the other hand, is trading under heavy selling pressure, down over 2% intraday to $1.36. The remittance token trades well below the downward-sloping 50-day EMA at $1.80, the 200-day EMA at $1.99, and the 200-day EMA at $2.18. All three moving averages signal a steady downtrend that could retest the October 10 low at $1.25 and Friday's low at $1.12.
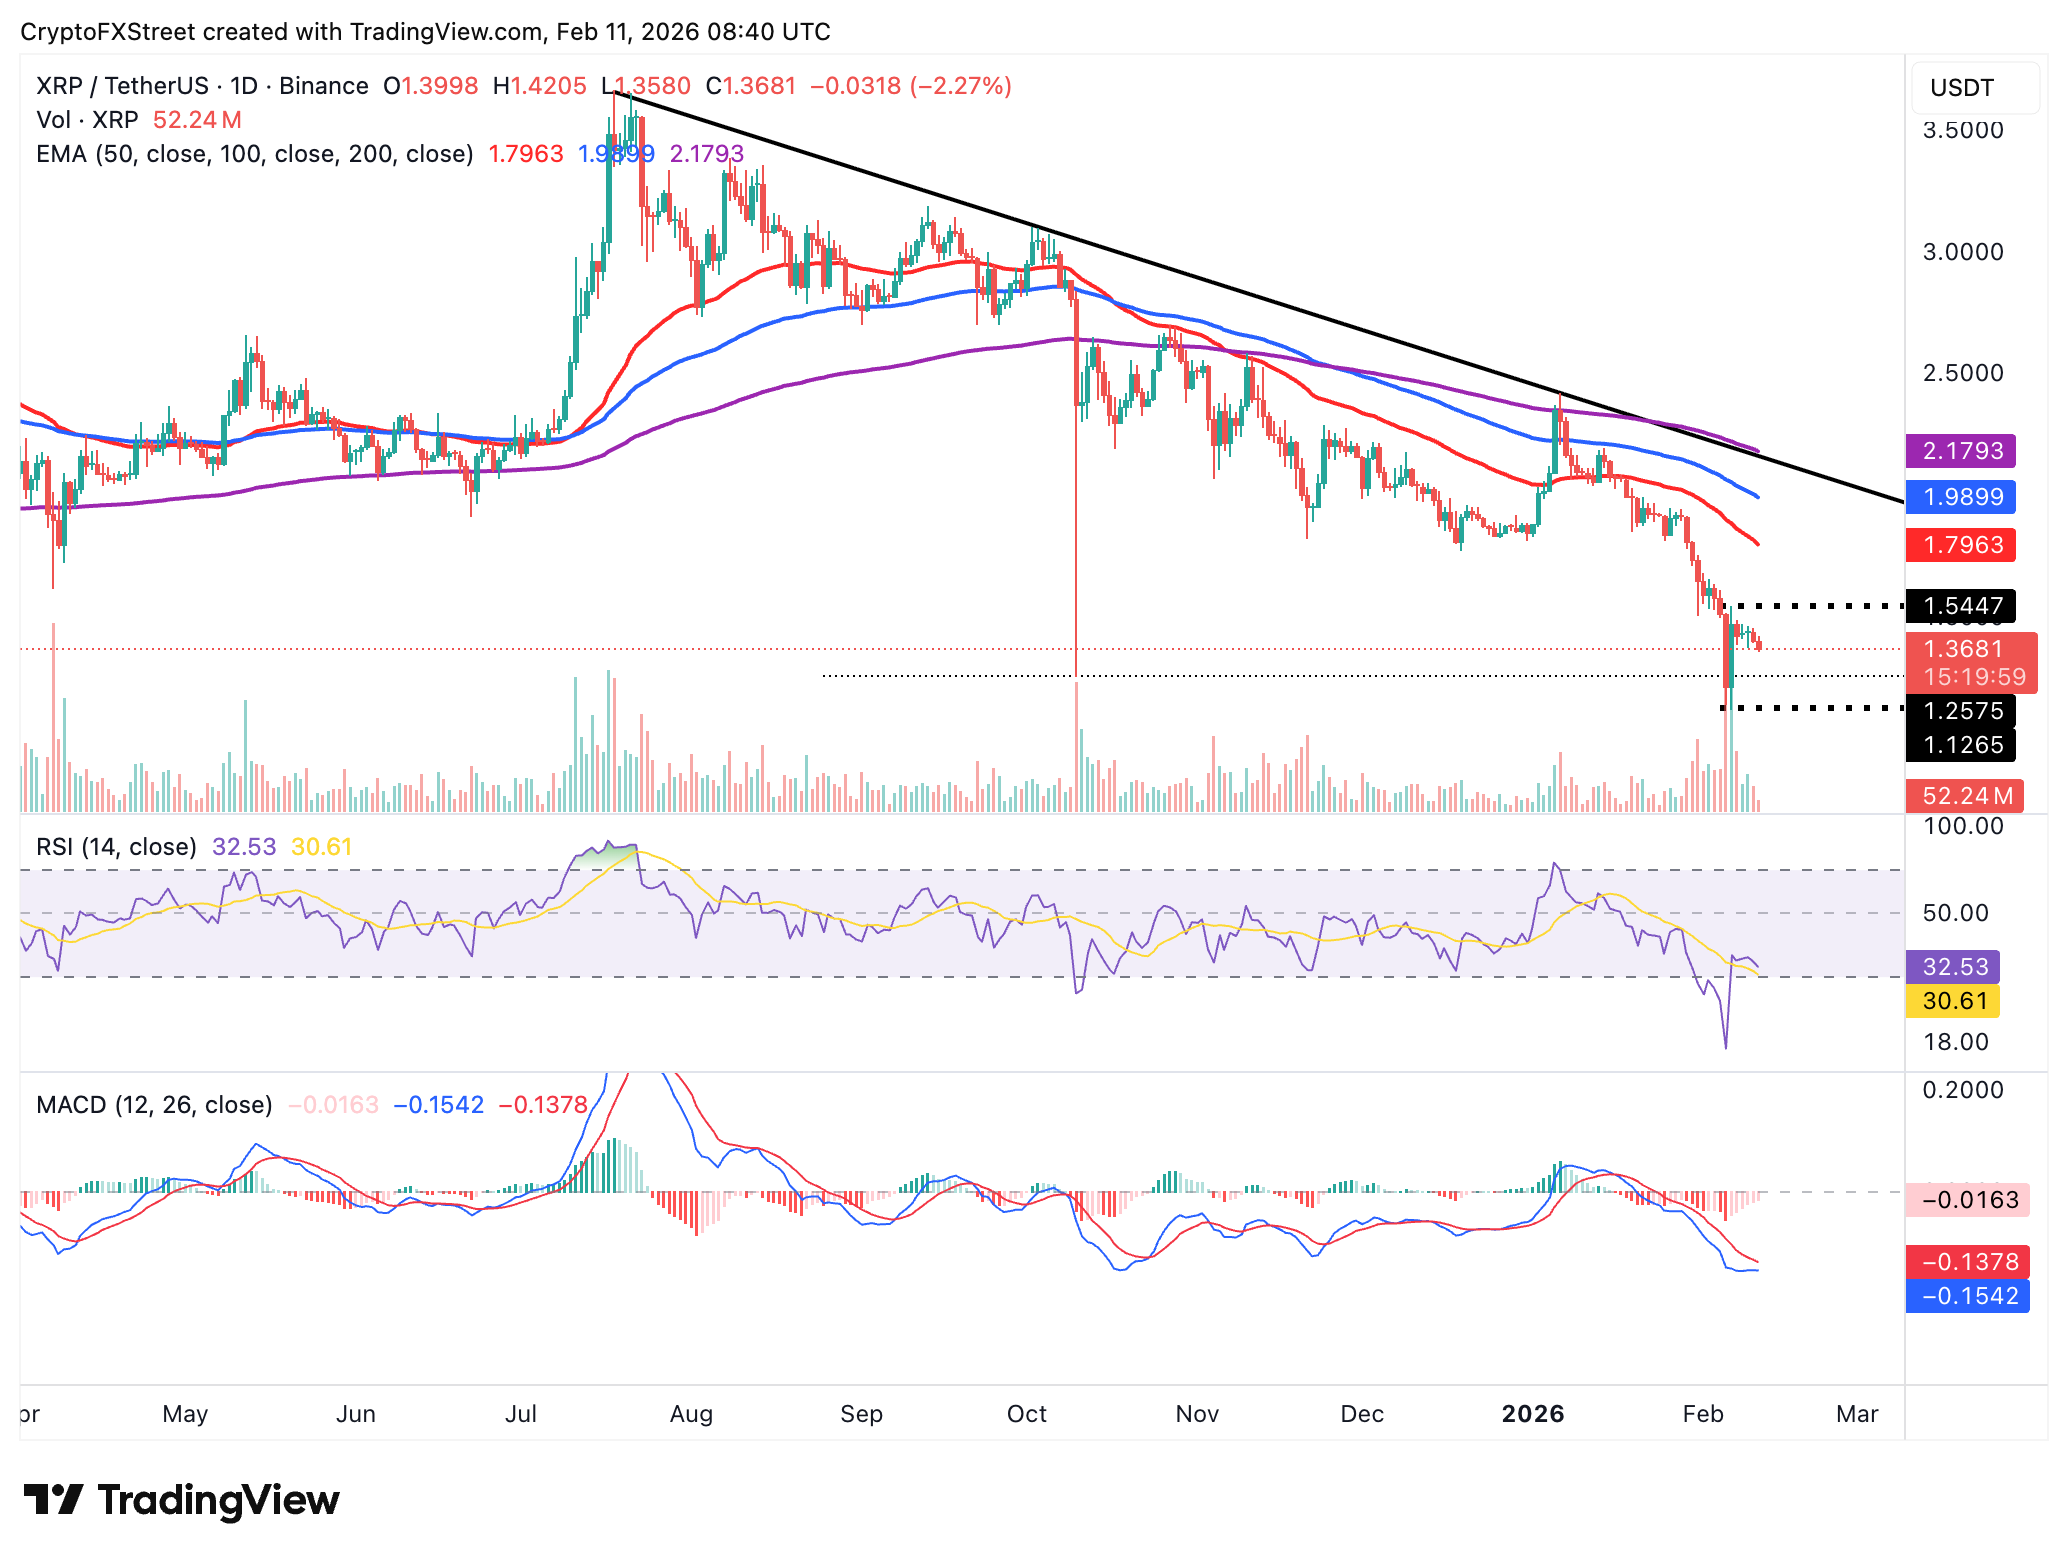
Conversely, the gap between the MACD and signal lines is narrowing on the daily chart, while the red histogram bars are contracting, suggesting that selling may be overextended and likely to usher in bullish momentum. Traders will watch out for the MACD line to cross above the signal line before increasing exposure, anticipating a reversal to $1.54 and the 50-day EMA at $1.80.
Open Interest, funding rate FAQs
Higher Open Interest is associated with higher liquidity and new capital inflow to the market. This is considered the equivalent of increase in efficiency and the ongoing trend continues. When Open Interest decreases, it is considered a sign of liquidation in the market, investors are leaving and the overall demand for an asset is on a decline, fueling a bearish sentiment among investors.
Funding fees bridge the difference between spot prices and prices of futures contracts of an asset by increasing liquidation risks faced by traders. A consistently high and positive funding rate implies there is a bullish sentiment among market participants and there is an expectation of a price hike. A consistently negative funding rate for an asset implies a bearish sentiment, indicating that traders expect the cryptocurrency’s price to fall and a bearish trend reversal is likely to occur.

超過一百萬用戶依賴 FXStreet 獲取即時市場數據、圖表工具、專家洞見與外匯新聞。其全面的經濟日曆與教育網路研討會協助交易者保持資訊領先、做出審慎決策。FXStreet 擁有約 60 人的團隊,分布於巴塞隆納總部及全球各地。
閱讀更多


