
NZD/USD Price Forecast: Kiwi hits 0.5755 support as bullish momentum eases
作者 Guillermo Alcala
發布日期: 18 Dec 2025 | 修改日期: 18 Dec 2025


熱門文章

The New Zealand Dollar has failed to draw any significant support from the strong New Zealand GDP figures and is losing ground against the US Dollar. The pair is hovering right above the 0.5755 support area at the time of writing, after having peaked at 0.5830 last week.
- NZD/USD drifts lower to test support at the 0.5755 area.
- The Kiwi remains on the back foot despite strong New Zealand GDP figures.
- Technical indicators suggest that the rally from late-November lows has lost momentum.
The New Zealand Dollar has failed to draw any significant support from the strong New Zealand GDP figures and is losing ground against the US Dollar. The pair is hovering right above the 0.5755 support area at the time of writing, after having peaked at 0.5830 last week.
Data released on Wednesday revealed that New Zealand’s economy bounced up to grow 1.1% in the third quarter, offsetting the 1% contraction in the first and beating expectations of a 0.9% growth. The pair, however, has remained vulnerable this week, amid a firmer US Dollar, with investors wary of selling US Dollars ahead of the release of November’s US CPI, due later on the day.
Technical Analysis: Indicators show a growing bearish momentum
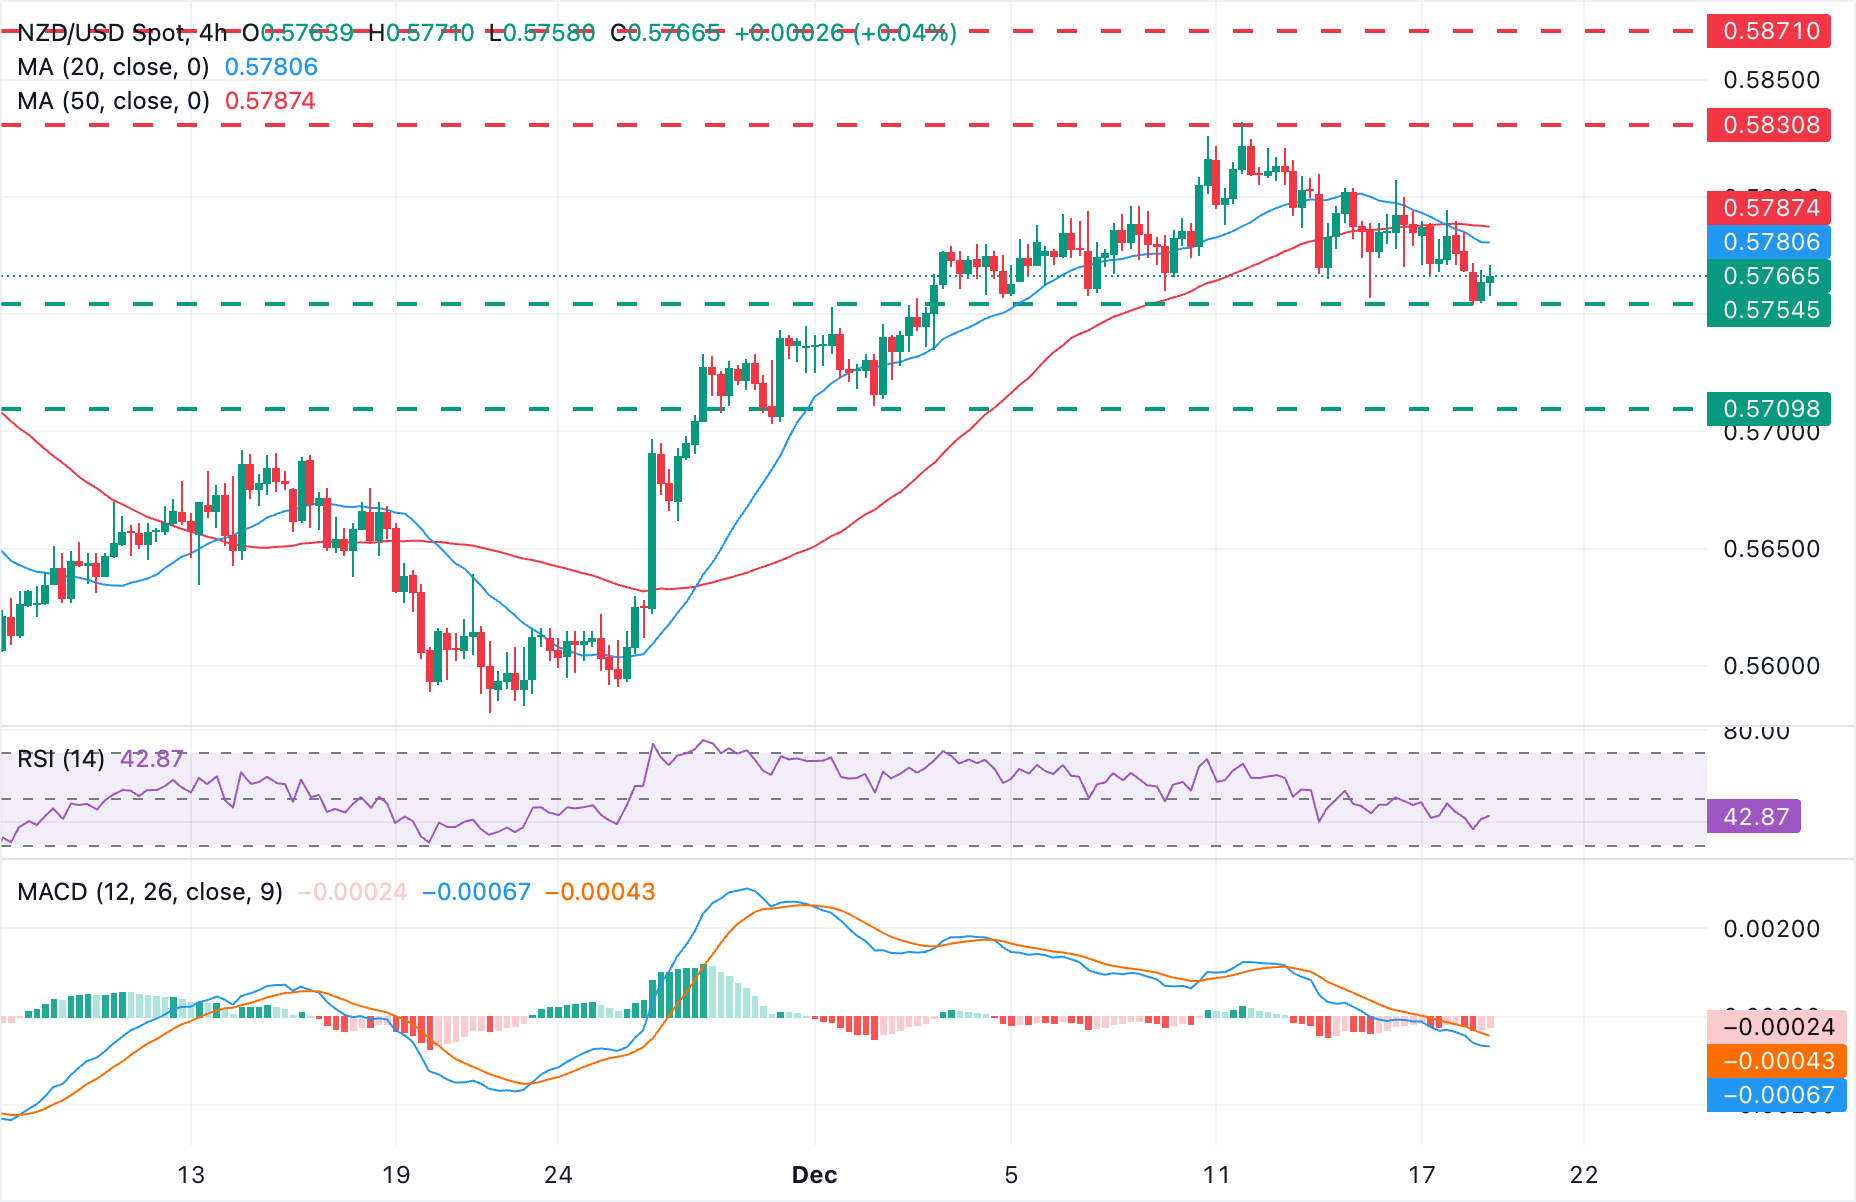
The 4-hour chart shows the NZD/USD trading at 0.5767 after falling in five out of the last six trading days. The 20-period Simple Moving Average (SMA) has slipped beneath the 50-period SMA, pointing to a soft bearish bias. The Moving Average Convergence Divergence (MACD) histogram stays marginally negative while the Relative Strength Index (RSI) consolidates below the 50 midline, suggesting that sellers have taken control.
The pair is now hovering above a key support area at 0.5755, where bears were contained on December 4, 8, 10, and 16. Further down, the next target is the 0.5700-0.5710 area (November 28, December 2 low). On the upside, immediate resistance is at the 50-period SMA, near 0.5790, ahead of the December 11 high, at 0.5830, and the September 23 high, at 0.5870.
(The technical analysis of this story was written with the help of an AI tool)
US Dollar Price Today
The table below shows the percentage change of US Dollar (USD) against listed major currencies today. US Dollar was the strongest against the Euro.
| USD | EUR | GBP | JPY | CAD | AUD | NZD | CHF | |
|---|---|---|---|---|---|---|---|---|
| USD | 0.14% | -0.07% | 0.05% | -0.01% | -0.10% | 0.11% | -0.09% | |
| EUR | -0.14% | -0.21% | -0.13% | -0.16% | -0.23% | -0.02% | -0.24% | |
| GBP | 0.07% | 0.21% | 0.10% | 0.05% | -0.03% | 0.18% | -0.03% | |
| JPY | -0.05% | 0.13% | -0.10% | -0.06% | -0.13% | 0.06% | -0.13% | |
| CAD | 0.01% | 0.16% | -0.05% | 0.06% | -0.08% | 0.11% | -0.08% | |
| AUD | 0.10% | 0.23% | 0.03% | 0.13% | 0.08% | 0.21% | -0.00% | |
| NZD | -0.11% | 0.02% | -0.18% | -0.06% | -0.11% | -0.21% | -0.22% | |
| CHF | 0.09% | 0.24% | 0.03% | 0.13% | 0.08% | 0.00% | 0.22% |
The heat map shows percentage changes of major currencies against each other. The base currency is picked from the left column, while the quote currency is picked from the top row. For example, if you pick the US Dollar from the left column and move along the horizontal line to the Japanese Yen, the percentage change displayed in the box will represent USD (base)/JPY (quote).

超過一百萬用戶依賴 FXStreet 獲取即時市場數據、圖表工具、專家洞見與外匯新聞。其全面的經濟日曆與教育網路研討會協助交易者保持資訊領先、做出審慎決策。FXStreet 擁有約 60 人的團隊,分布於巴塞隆納總部及全球各地。
閱讀更多


