
Pi Network Price Forecast: PI hits record low despite plans to deploy KYC validator rewards in March
作者 Vishal Dixit
發布日期: 6 Feb 2026 | 修改日期: 6 Feb 2026


熱門文章

Pi Network (PI) trades above $0.1400 at press time on Friday, recovering from a record low of $0.1300 registered earlier in the day.
- Pi Network hovers above $0.1400 on Friday, up from the $0.1300 record low seen earlier in the day.
- The sell-off continues even as Pi Network has announced that it will distribute KYC validator rewards by the end of March.
- The technical outlook for PI remains bearish, consistent with the broader cryptocurrency market correction.
Pi Network (PI) trades above $0.1400 at press time on Friday, recovering from a record low of $0.1300 registered earlier in the day. The PI token's price extends its recent decline amid the broader cryptocurrency market crash and despite the recent announcement of plans to distribute rewards to Know-Your-Customer (KYC) validators.
Holder confidence declines despite plans to reward KYC validators in March
Pi Network announced plans to deploy Pi-based rewards to KYC validators for processing millions of applications by late March. As of Friday, the design is being tested following completion and mainnet implementation. The validator rewards could boost the network participation and retail sentiment.

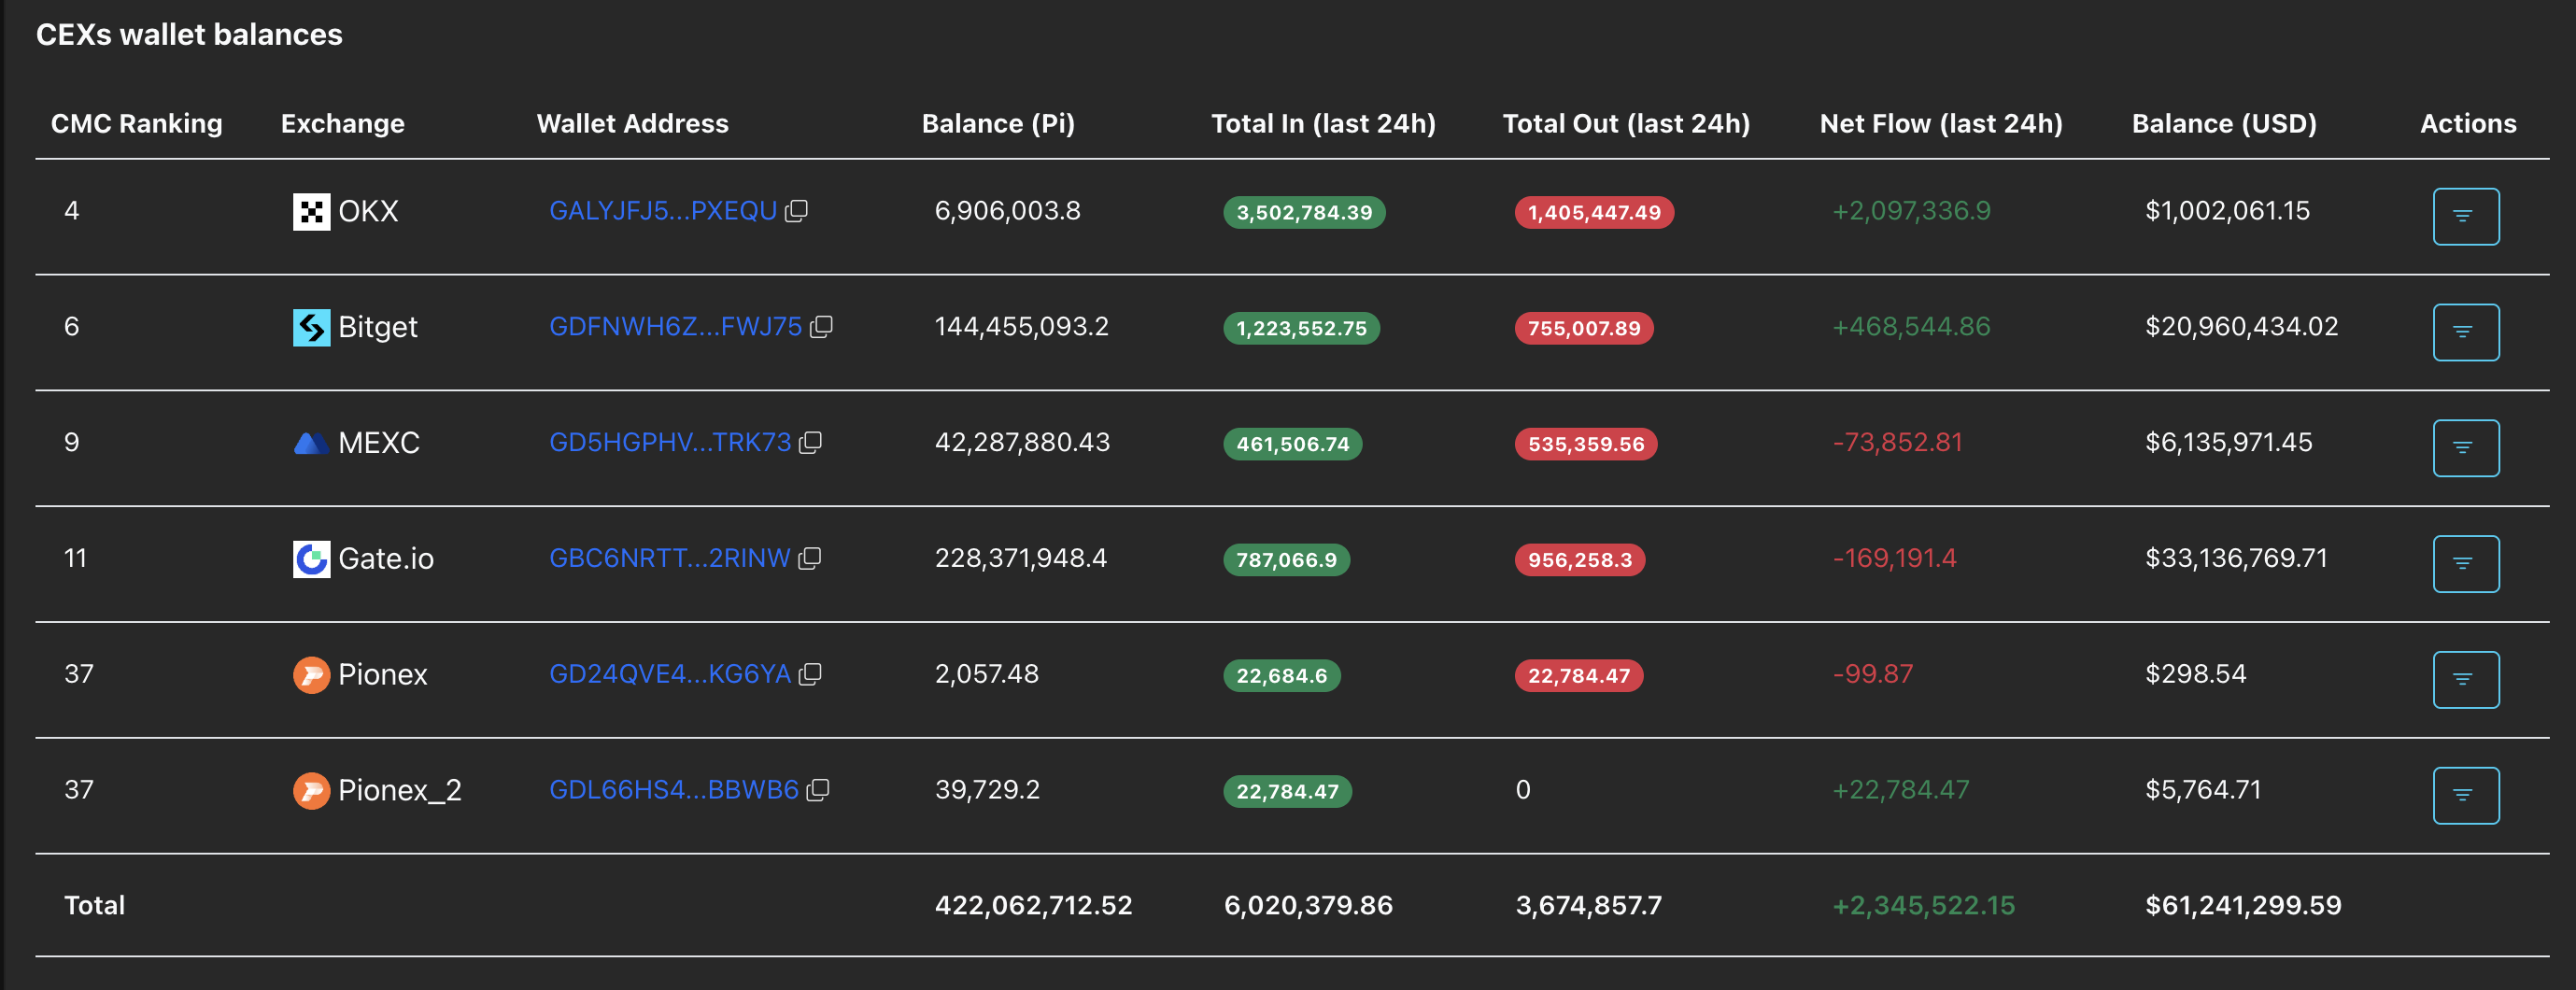
Still, the announcement didn't significantly lift the near-term outlook for PI. Investor confidence continues to decline, as PiScan data show that holders deposited more than 2.34 million PI tokens on exchanges in the last 24 hours. Typically, net inflows into exchanges are associated with holders reducing their exposure, thereby adding to supply pressure.
Pi Network in a freefall targets listing price
Pi Network dropped 9% on Thursday, breaking below the $0.1533 support level, which coincided with the October 10 low. At the time of writing, the intraday reversal from a record low of $0.1300 indicates a minor ease in downside pressure.
However, the technical indicators on the daily chart reflect sell-side dominance. The relative strength index (RSI) at 20 consolidates into the oversold zone, indicating intense selling pressure. At the same time, the Moving Average Convergence Divergence (MACD) and signal line decline into the negative territory as the histogram below the zero line widens, suggesting intense bearish momentum.
In this scenario, PI looks set to enter into a price-discovery mode, with the $0.1000 listing price being the remaining known price level.
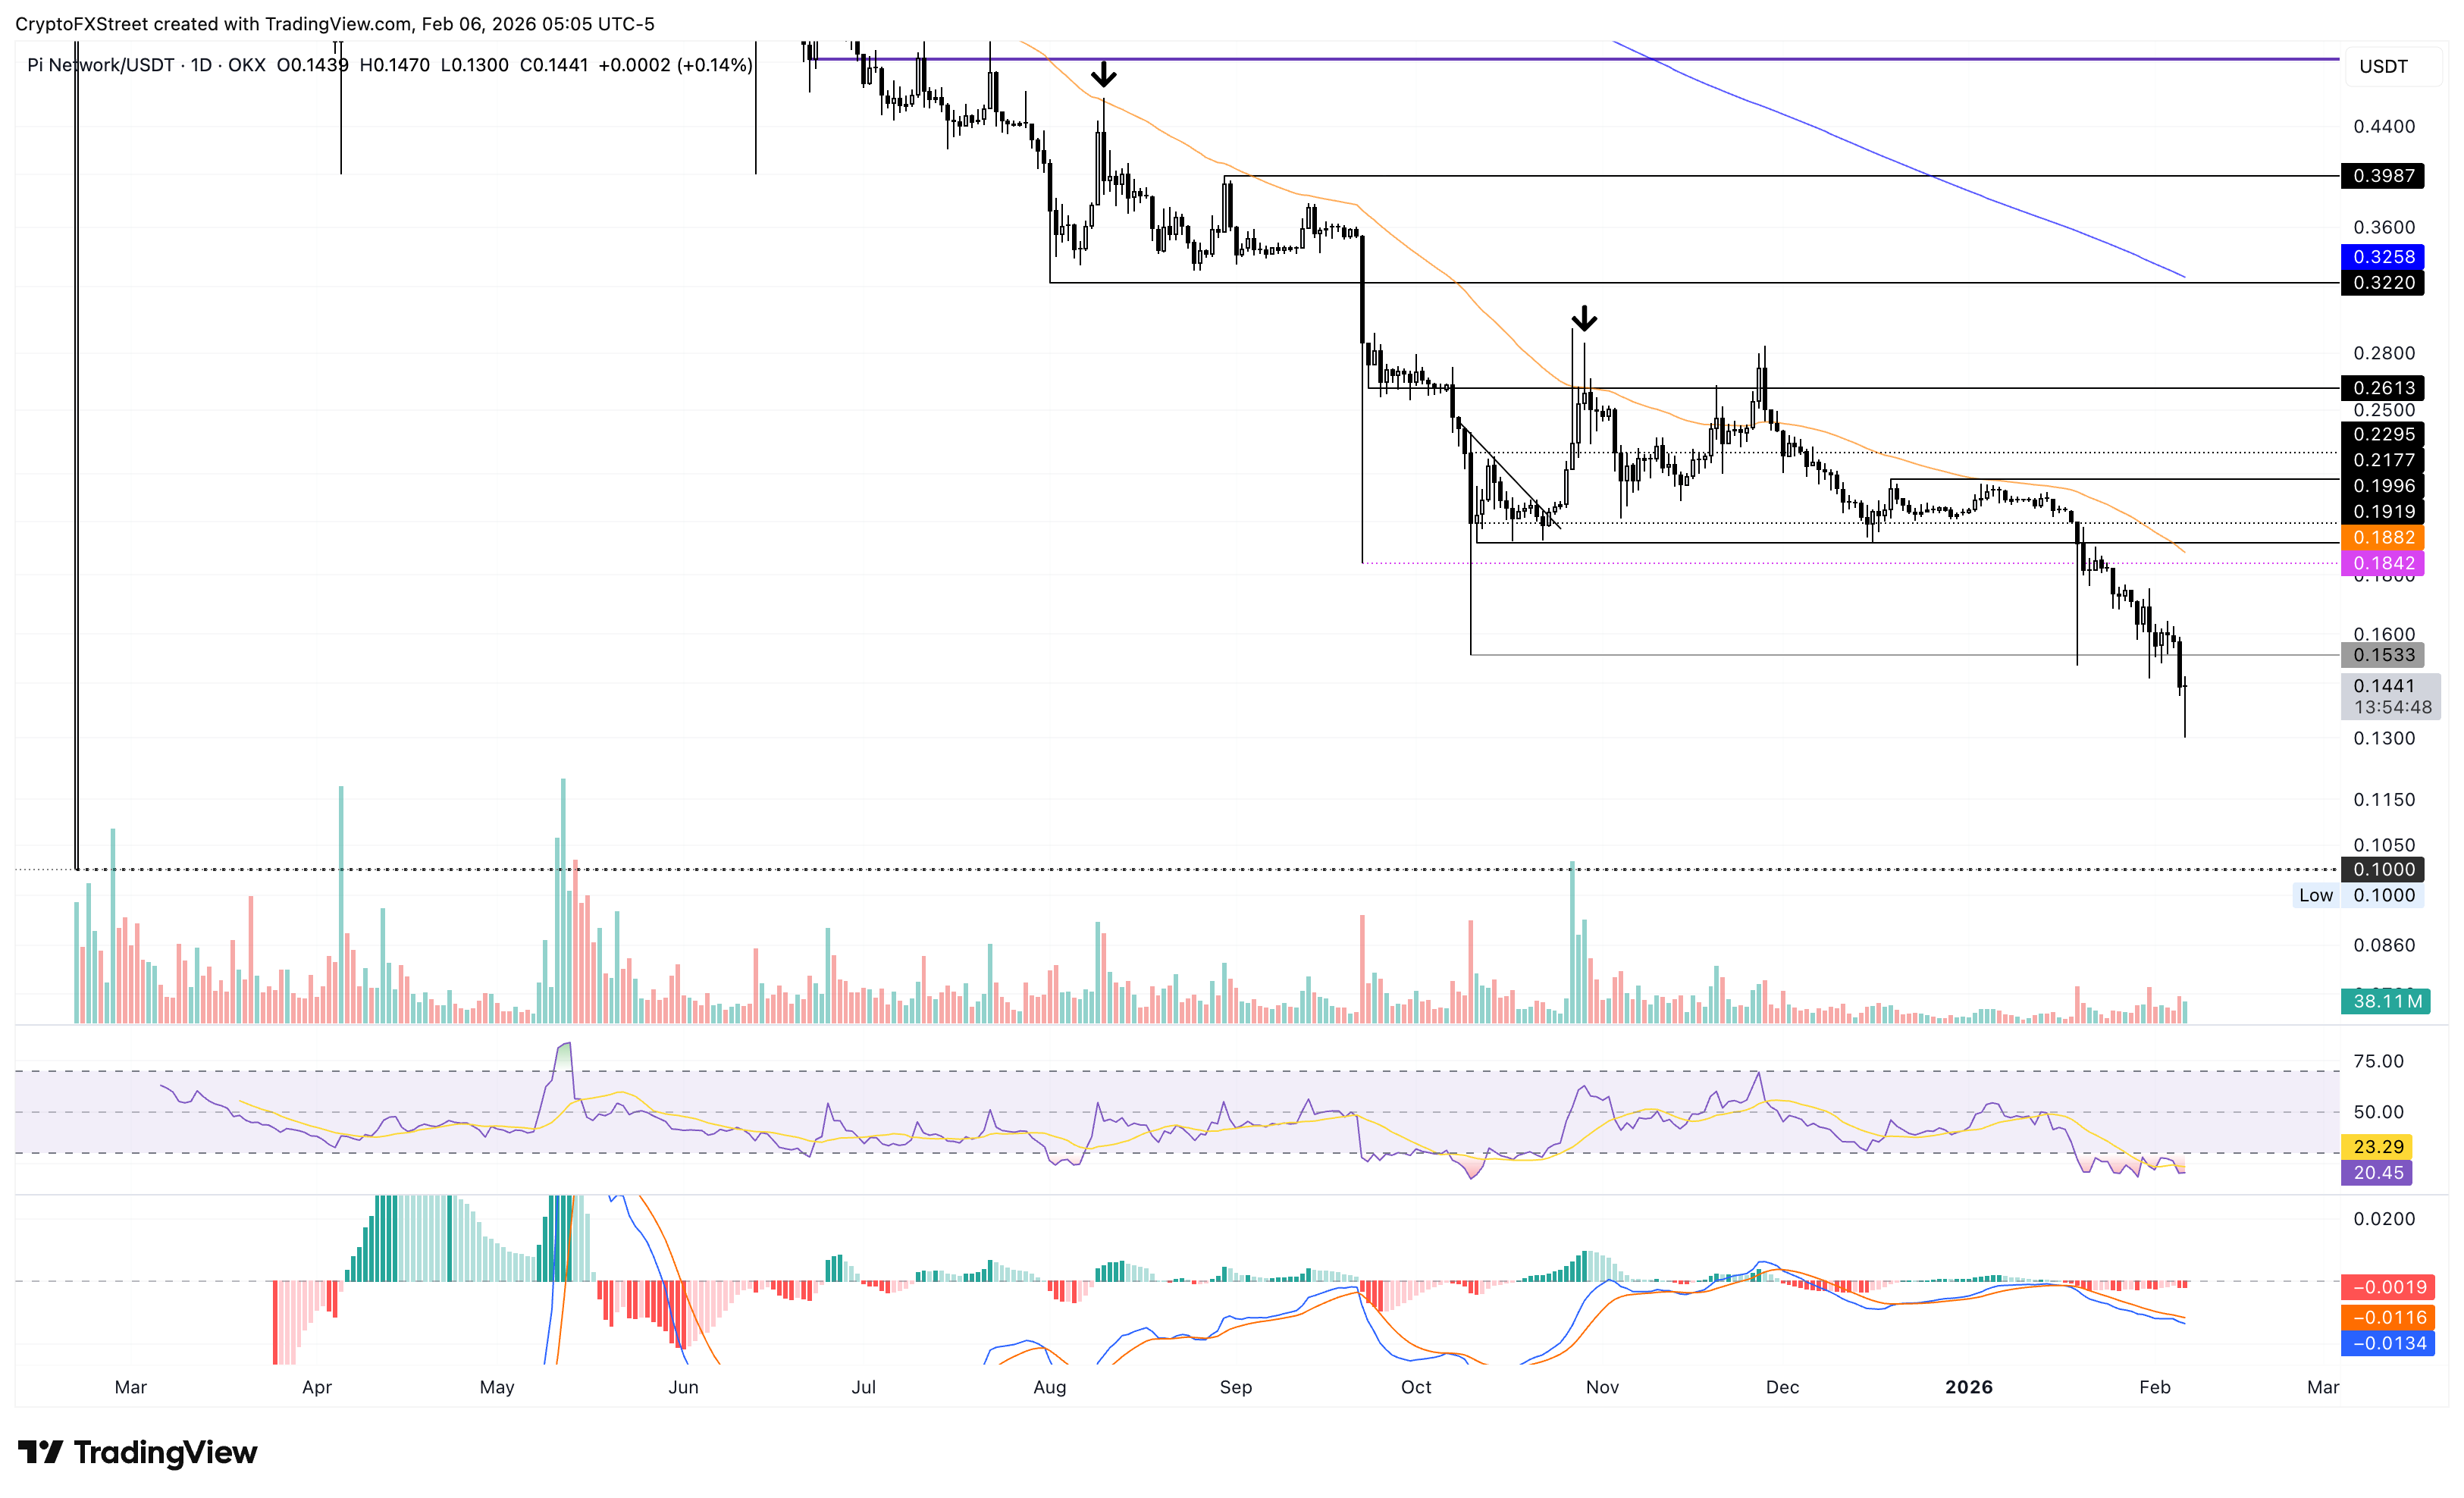
On the upside, PI should reclaim the $0.1533 level to ease headwinds and start a recovery.

超過一百萬用戶依賴 FXStreet 獲取即時市場數據、圖表工具、專家洞見與外匯新聞。其全面的經濟日曆與教育網路研討會協助交易者保持資訊領先、做出審慎決策。FXStreet 擁有約 60 人的團隊,分布於巴塞隆納總部及全球各地。
閱讀更多


