
Tron Price Forecast: TRX slides for fifth consecutive day despite treasury expansion
作者 Vishal Dixit
發布日期: 2 Feb 2026 | 修改日期: 2 Feb 2026


熱門文章

Tron (TRX) remains in a steady decline for the fifth straight day, recording nearly 1% loss on Monday. Tron Inc., formerly SRM Entertainment Inc., acquired roughly 175,000 TRX tokens on Monday, reflecting its buy-the-dip strategy.
- Tron extends its decline for the fifth consecutive day on Monday, falling below $0.2900.
- Tron Inc. announced a purchase of approximately 175,000 TRX tokens on Monday, expanding its holdings at a discount.
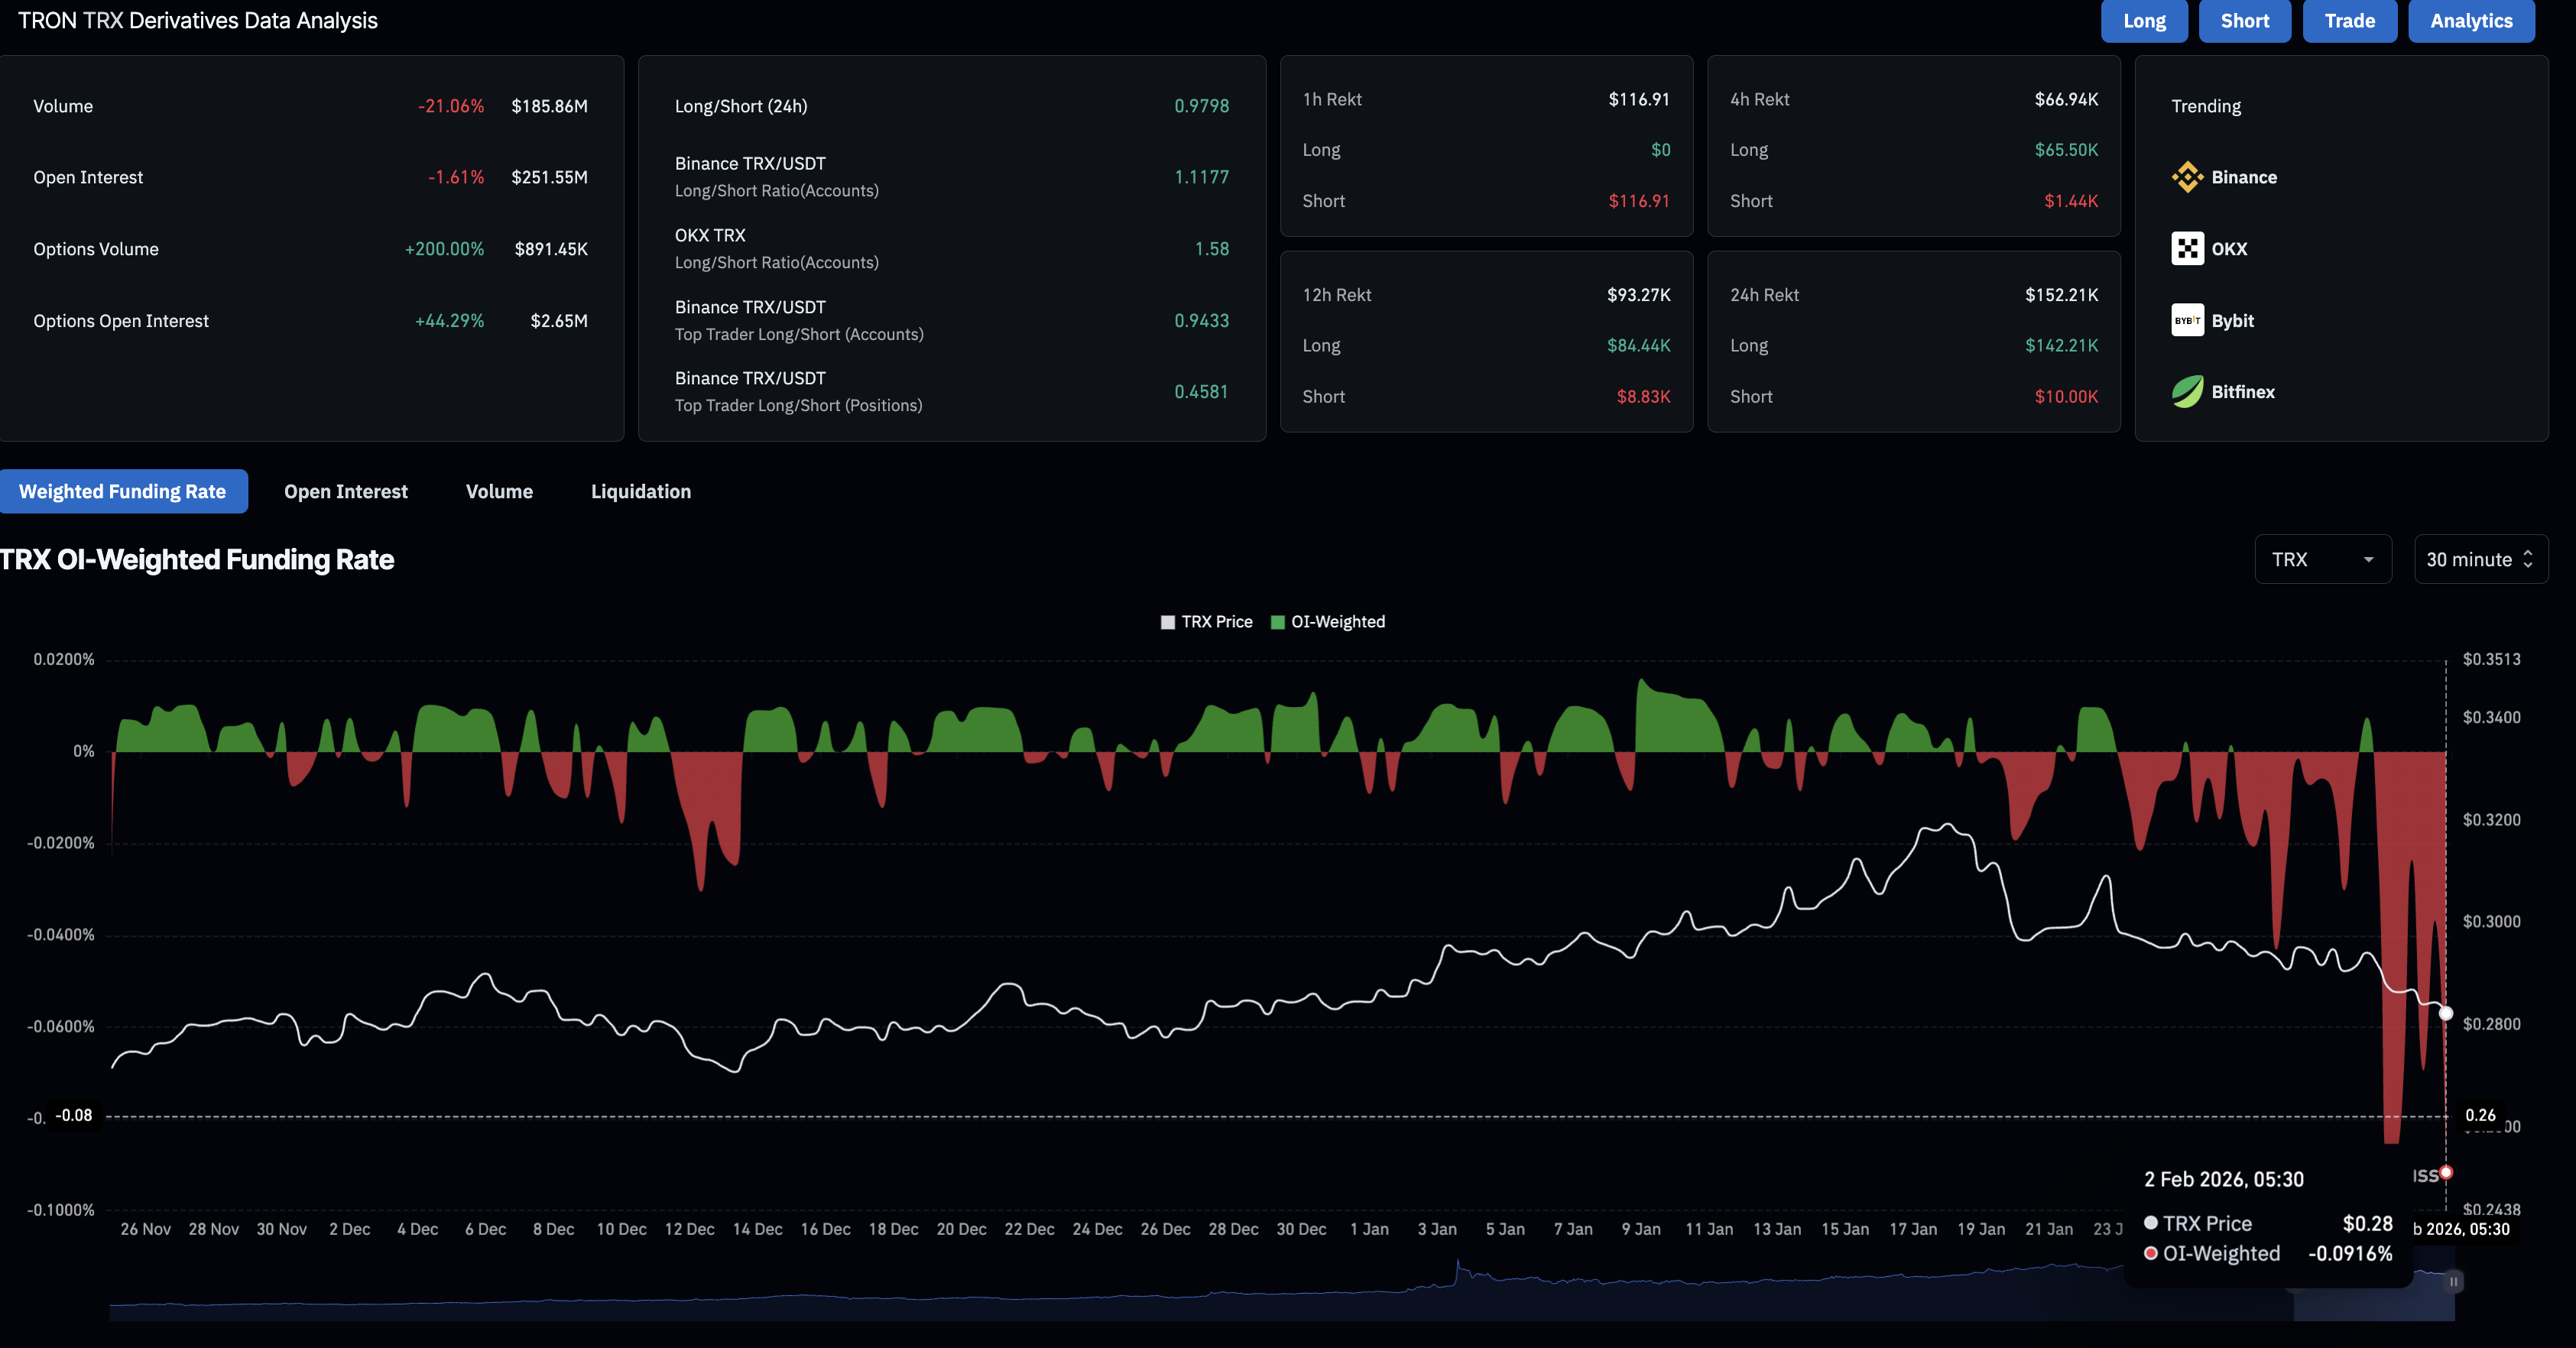
- Derivatives data suggests a significant rise in bearish interest amid massive positional wipeout.
Tron (TRX) remains in a steady decline for the fifth straight day, recording nearly 1% loss on Monday. Tron Inc., formerly SRM Entertainment Inc., acquired roughly 175,000 TRX tokens on Monday, reflecting its buy-the-dip strategy. Still, broader market pressures are shifting risk-off sentiment among altcoin investors, evidenced by bullish positional wipeout and negative funding rates.
Tron Inc’s TRX holding expansion fails to boost retail sentiment
Tron Inc., a TRX-focused Digital Asset Treasury (DAT), acquired 174,740 TRX tokens on Monday at an average price of $0.29 to boost its holdings to over 679 million tokens in total. Typically, a purchase from DAT relieves pressure on retail sentiment, but in the current market, Tron remains under pressure.

On the derivatives side, Tron futures Open Interest (OI) is down 1.61% over the last 24 hours, reaching $251.55 million, indicating reduced trader participation. Meanwhile, the existing trend indicates a bearish trend, as the funding rate is at -0.0916%, suggesting that traders are willing to pay a premium to hold short positions.
Tron risks further decline amid intense selling pressure
Tron trades below $0.2900 at press time on Monday, extending the decline below the 50-day Exponential Moving Average (EMA) at $0.2945 and the 200-day EMA at $0.2954, reinforcing a bearish bias.
The Moving Average Convergence Divergence (MACD) indicator stays below the signal line and under the zero mark on the daily chart, while a widening negative histogram suggests strengthening bearish momentum. The Relative Strength Index (RSI) at 35 on the same time frame indicates rising selling pressure, with the indicator remaining right above the oversold zone.
Looking down, the nearest support for Tron lies at the November 4 low of $0.2764, followed by a deeper zone at $0.2631.
To reinstate an uprising, TRX should reclaim the $0.3000 round figure.
(The technical analysis of this story was written with the help of an AI tool.)

超過一百萬用戶依賴 FXStreet 獲取即時市場數據、圖表工具、專家洞見與外匯新聞。其全面的經濟日曆與教育網路研討會協助交易者保持資訊領先、做出審慎決策。FXStreet 擁有約 60 人的團隊,分布於巴塞隆納總部及全球各地。
閱讀更多


