
WTI rallies into $65 on Iran risk premium despite massive EIA inventory build
作者 Joshua Gibson
發布日期: 12 Feb 2026 | 修改日期: 12 Feb 2026


熱門文章

West Texas Intermediate (WTI) crude oil surged above $65.00 per barrel on Wednesday, gaining over 1% as escalating US-Iran tensions continued to inject a geopolitical risk premium into energy markets.
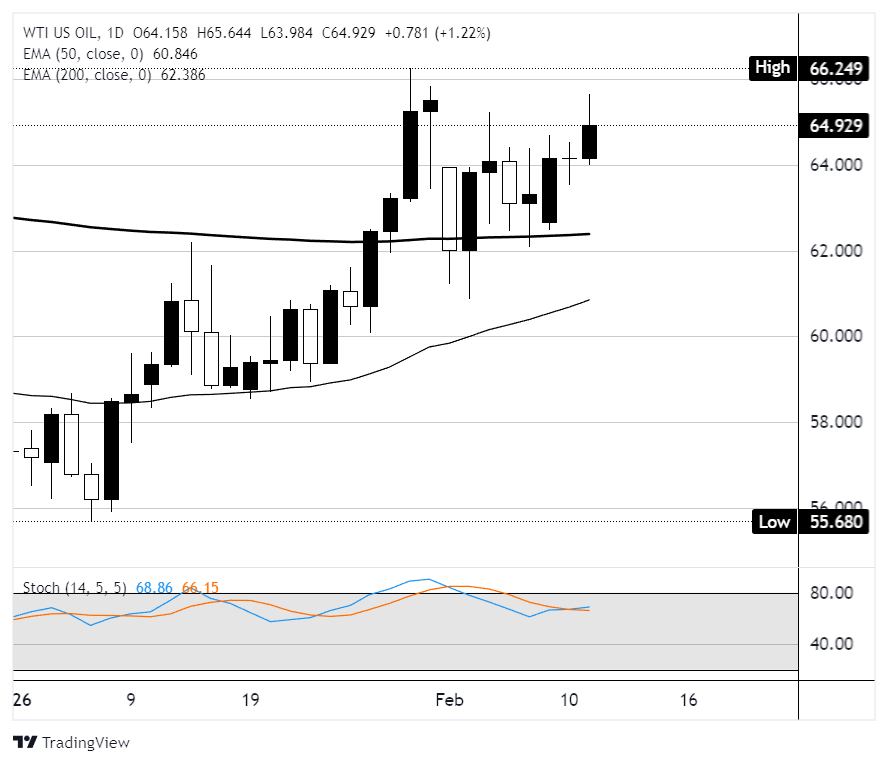
- Price is holding above both the 50 and 200 Exponential Moving Averages (EMA) on the daily chart, confirming a bullish structure shift from the January lows
- A surprise 8.53 million barrel EIA inventory build cap upside potential near the $66.25 swing high
West Texas Intermediate (WTI) crude oil surged above $65.00 per barrel on Wednesday, gaining over 1% as escalating US-Iran tensions continued to inject a geopolitical risk premium into energy markets. The daily chart shows price trading firmly above both the 50 EMA at $60.85 and the 200 EMA at $62.39, confirming the bullish reversal from the $55.68 swing low printed in early January. The rally has carved out a series of higher highs and higher lows since that base, with today's push toward $65.64 testing the $66.25 resistance zone that marks the recent swing high.
Fundamentally, the move higher is being driven by fears that US-Iran nuclear talks could collapse, potentially triggering military action that would disrupt crude flows through the Strait of Hormuz. Adding to the geopolitical noise, Bloomberg reported that President Trump is privately weighing an exit from the US-Mexico-Canada Agreement (USMCA) ahead of the July 1 mandatory review, a move that would upend North American energy trade and expose Canadian crude exports to significantly higher tariffs. On the data front, January Non-Farm Payrolls (NFP) printed at 130K against a 70K consensus, while the unemployment rate ticked down to 4.3%, suggesting the US labor market is holding steady enough to support energy demand in the near term.
Inventory shock meets geopolitical bid at key resistance
Despite the bullish momentum, the Energy Information Administration (EIA) Crude Oil Stocks Change came in at a staggering +8.53 million barrels against expectations of a -0.2 million barrel draw, the largest weekly build in months. The Stochastic Oscillator (14,5,5) is sitting in neutral-bullish territory but approaching the overbought threshold at 80. This suggests the current rally still has room to extend, though the combination of bloated inventories and the $66.25 resistance overhead creates a natural stalling point. If bulls can push through $66.25 on a daily close, the measured move from the January base projects toward the $68.00 to $69.00 zone.
A failure to clear that level, particularly if the USMCA withdrawal narrative gains traction and threatens Canadian oil supply chains, could see WTI retreat toward the 200 EMA at $62.39. Traders should also watch for Thursday's International Energy Agency (IEA) Natural Gas Storage report, which has already warned of a sizeable supply surplus for 2026, alongside OPEC's monthly outlook released earlier today that pointed to lower demand from the group in Q2; both carry the potential to shift the supply-demand narrative and pressure prices lower despite the prevailing geopolitical bid.
WTI daily chart
WTI Oil FAQs
WTI Oil is a type of Crude Oil sold on international markets. The WTI stands for West Texas Intermediate, one of three major types including Brent and Dubai Crude. WTI is also referred to as “light” and “sweet” because of its relatively low gravity and sulfur content respectively. It is considered a high quality Oil that is easily refined. It is sourced in the United States and distributed via the Cushing hub, which is considered “The Pipeline Crossroads of the World”. It is a benchmark for the Oil market and WTI price is frequently quoted in the media.
Like all assets, supply and demand are the key drivers of WTI Oil price. As such, global growth can be a driver of increased demand and vice versa for weak global growth. Political instability, wars, and sanctions can disrupt supply and impact prices. The decisions of OPEC, a group of major Oil-producing countries, is another key driver of price. The value of the US Dollar influences the price of WTI Crude Oil, since Oil is predominantly traded in US Dollars, thus a weaker US Dollar can make Oil more affordable and vice versa.
The weekly Oil inventory reports published by the American Petroleum Institute (API) and the Energy Information Agency (EIA) impact the price of WTI Oil. Changes in inventories reflect fluctuating supply and demand. If the data shows a drop in inventories it can indicate increased demand, pushing up Oil price. Higher inventories can reflect increased supply, pushing down prices. API’s report is published every Tuesday and EIA’s the day after. Their results are usually similar, falling within 1% of each other 75% of the time. The EIA data is considered more reliable, since it is a government agency.
OPEC (Organization of the Petroleum Exporting Countries) is a group of 12 Oil-producing nations who collectively decide production quotas for member countries at twice-yearly meetings. Their decisions often impact WTI Oil prices. When OPEC decides to lower quotas, it can tighten supply, pushing up Oil prices. When OPEC increases production, it has the opposite effect. OPEC+ refers to an expanded group that includes ten extra non-OPEC members, the most notable of which is Russia.

超過一百萬用戶依賴 FXStreet 獲取即時市場數據、圖表工具、專家洞見與外匯新聞。其全面的經濟日曆與教育網路研討會協助交易者保持資訊領先、做出審慎決策。FXStreet 擁有約 60 人的團隊,分布於巴塞隆納總部及全球各地。
閱讀更多


