
Trade The World
AUD/USD Price Forecast: Aussie eases to 0.6700 after failure at at 0.6725
作者 Guillermo Alcala
發布日期: 13 Jan 2026 | 修改日期: 13 Jan 2026


POPULAR ARTICLES

The Australian Dollar remains trading within previous ranges against its US counterpart, as the pair’s recovery from the 0.6660 area was capped at 0.6725 on Monday before pulling back to 0.6700.
- AUD/USD trims gains and dips to 0.6700 after rejection at a reverse trendline around 0.6725.
- The lower high and bearish divergence in the 4-hour RSI point to a trend reversal.
- Price action is completing the right shoulder of a potential H&S pattern.
The Australian Dollar remains trading within previous ranges against its US counterpart, as the pair’s recovery from the 0.6660 area was capped at 0.6725 on Monday before pulling back to 0.6700. The Greenback is trading moderately higher on Tuesday, as investors brace for the US inflation report due later today.
U.S. consumer prices are expected to have grown at a steady 2.7% year-on-year pace in December. Core inflation, however, is forecasted to have accelerated to 2.7% from 2.6% in November. Barring a surprise, these figures are likely to strengthen the case for a steady Federal Reserve (Fed) policy in the coming months and provide support to the USD.
Technical Analysis: Key support, at 0.6560, remains in play
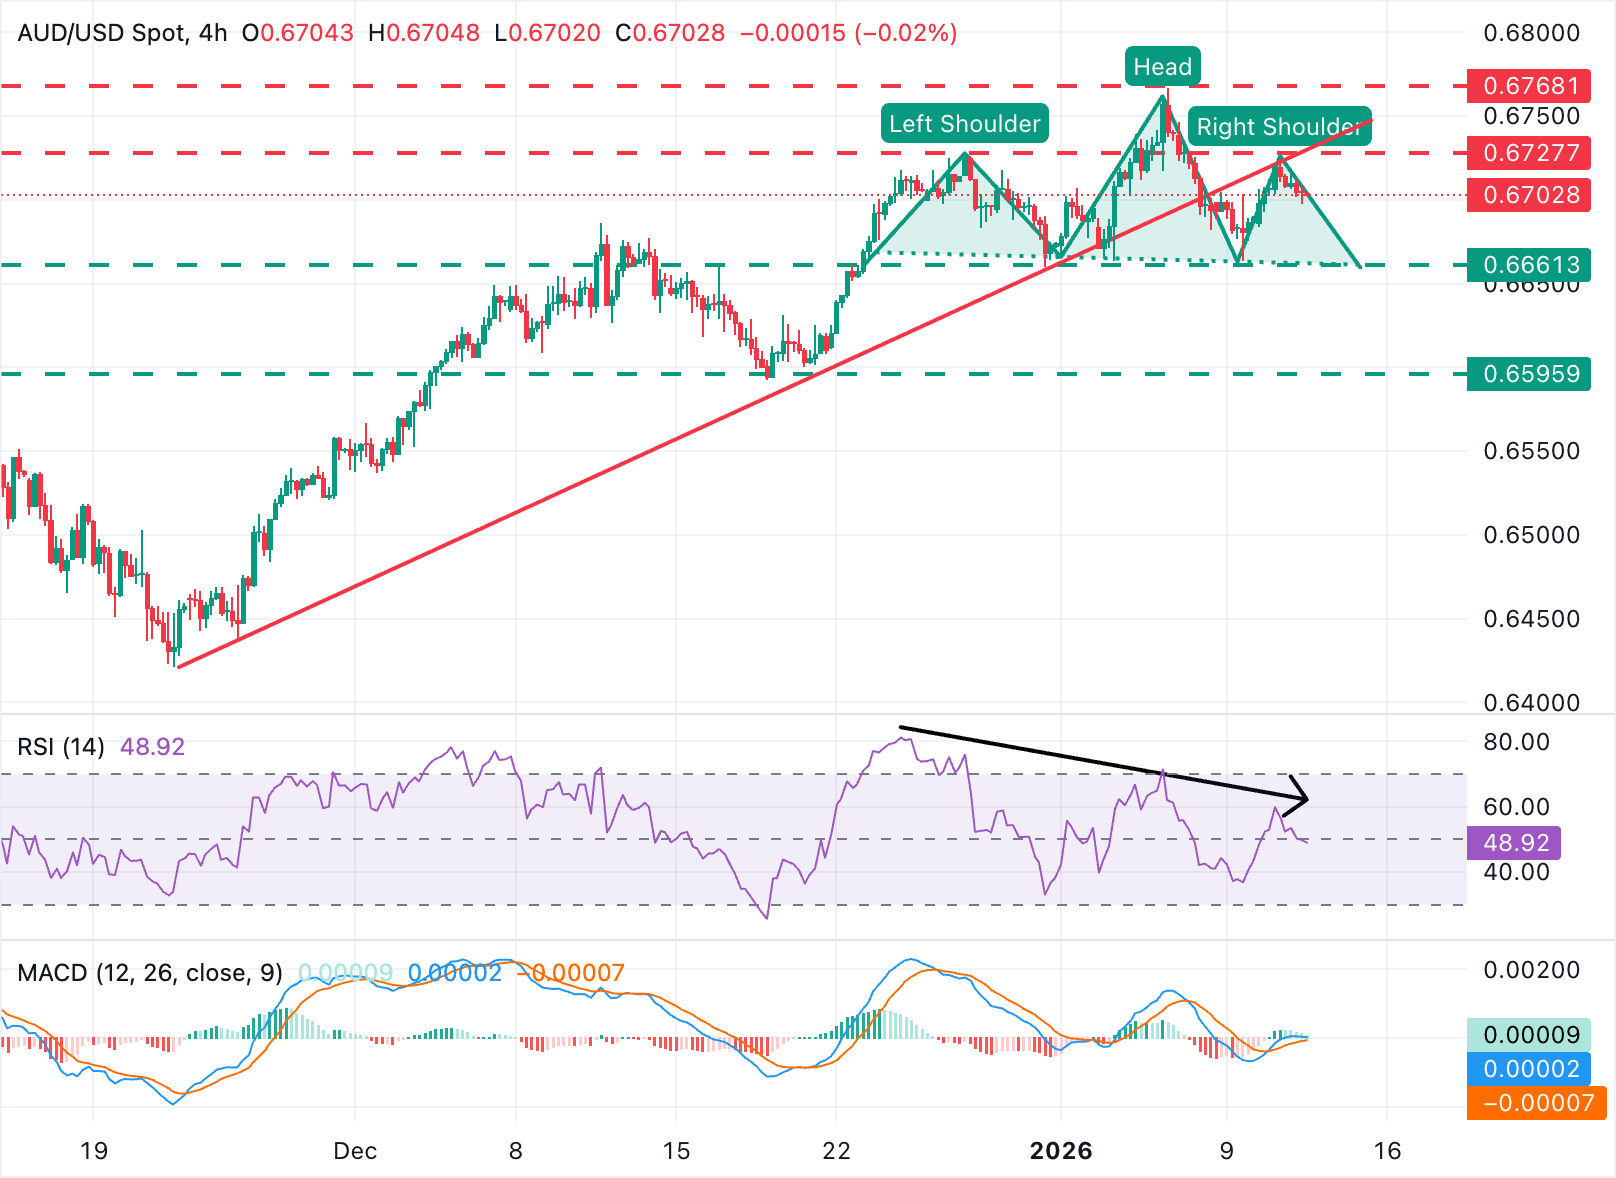
In the 4-hour chart, AUD/USD trades at 0.6703, with technical indicators showing a fading bullish momentum. The Relative Strength Index (RSI) sits at 49 and highlights a bearish divergence with recent price action. The Moving Average Convergence Divergence (MACD) hovers around the zero line with a slight positive tilt, reinforcing a neutral tone.
Monday's rejection at the reverse trendline, near 0.6725, adds to the case of a potential bearish Head & Shoulder's pattern, a common figure to anticipate trend reversals. This figure would be confirmed on the breach of the neckline, at 0.6660 (December 31, January 5 low), adding pressure towards the December 18 low, at 0.6595.
On the upside, bulls should break above the confluence of Monday's high and the reverse trendline, in the area of 0.6730 now, to resume the broader bullish trend and shift the focus towards the three-month high, 0.6770, hit last week.
(The technical analysis of this story was written with the help of an AI tool.)
US Dollar Price Today
The table below shows the percentage change of US Dollar (USD) against listed major currencies today. US Dollar was the strongest against the Japanese Yen.
| USD | EUR | GBP | JPY | CAD | AUD | NZD | CHF | |
|---|---|---|---|---|---|---|---|---|
| USD | 0.00% | -0.04% | 0.46% | 0.00% | 0.18% | 0.10% | 0.11% | |
| EUR | -0.00% | -0.03% | 0.46% | 0.01% | 0.17% | 0.10% | 0.11% | |
| GBP | 0.04% | 0.03% | 0.49% | 0.05% | 0.22% | 0.14% | 0.14% | |
| JPY | -0.46% | -0.46% | -0.49% | -0.44% | -0.27% | -0.36% | -0.34% | |
| CAD | -0.01% | -0.01% | -0.05% | 0.44% | 0.17% | 0.08% | 0.09% | |
| AUD | -0.18% | -0.17% | -0.22% | 0.27% | -0.17% | -0.08% | -0.06% | |
| NZD | -0.10% | -0.10% | -0.14% | 0.36% | -0.08% | 0.08% | 0.00% | |
| CHF | -0.11% | -0.11% | -0.14% | 0.34% | -0.09% | 0.06% | -0.01% |
The heat map shows percentage changes of major currencies against each other. The base currency is picked from the left column, while the quote currency is picked from the top row. For example, if you pick the US Dollar from the left column and move along the horizontal line to the Japanese Yen, the percentage change displayed in the box will represent USD (base)/JPY (quote).

FXStreet
超過一百萬用戶依賴 FXStreet 獲取即時市場數據、圖表工具、專家洞見與外匯新聞。其全面的經濟日曆與教育網路研討會協助交易者保持資訊領先、做出審慎決策。FXStreet 擁有約 60 人的團隊,分布於巴塞隆納總部及全球各地。
Read More


