
Trade The World
Bitcoin Price Forecast: BTC steadies around $92,000 as signs of undervaluation emerge
作者 Manish Chhetri
發布日期: 20 Nov 2025 | 修改日期: 20 Nov 2025


POPULAR ARTICLES

Bitcoin (BTC) price steadies near $92,000 at the time of writing on Thursday, holding firmly above the key psychological level of $90,000 — a zone that could support a short-term recovery if preserved.
- Bitcoin price holds above the key psychological $90,000 level, which could suggest a short-term recovery.
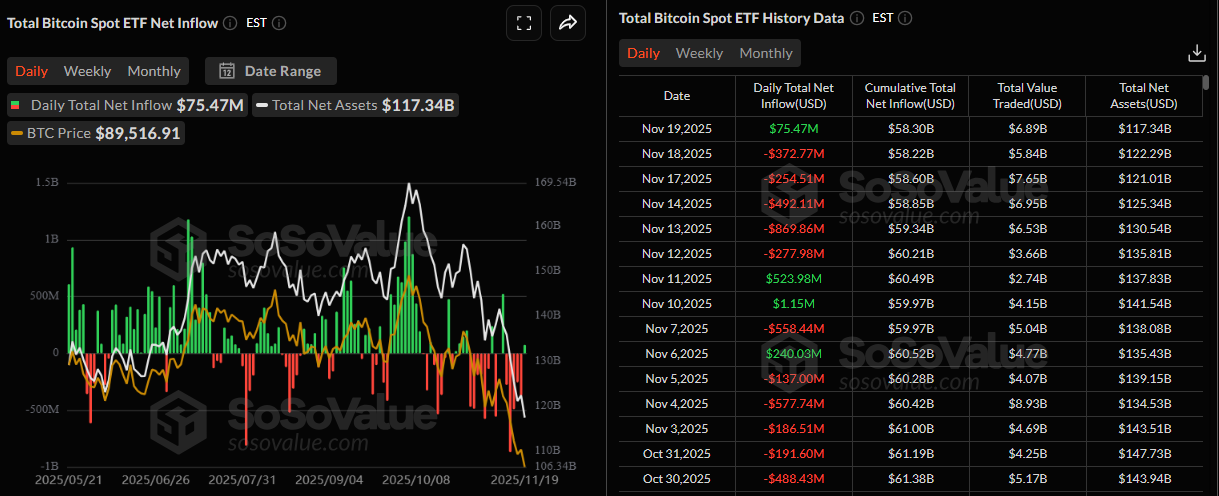
- US-listed spot Bitcoin ETFs record a mild inflow of $75.4 million on Wednesday, breaking the outflow streak since November 12.
- BTC’s 30-day MVRV drops to levels last seen during the March dip, suggesting Bitcoin may be undervalued and positioned for a potential short-term bounce.
Bitcoin (BTC) price steadies near $92,000 at the time of writing on Thursday, holding firmly above the key psychological level of $90,000 — a zone that could support a short-term recovery if preserved. Market sentiment improved slightly after US-listed spot Bitcoin Exchange Traded Funds (ETFs) recorded a mild inflow of over $75 million on Wednesday, breaking the streak of withdrawals since November 12. Meanwhile, on-chain data suggests Bitcoin may be undervalued and poised for a near-term bounce.
Bitcoin spot ETF records mild inflow
Bitcoin’s institutional demand shows a mild sign of strength. SoSoValue data showed that spot Bitcoin ETFs recorded inflows of $75.4 million on Wednesday, breaking their streak of outflows since November 12. If these inflows continue and intensify, the largest cryptocurrency by market capitalization could see a price recovery in the coming days.
Why BTC could be undervalued around the current trading levels?
Santiment’s Market Value to Realized Value (MVRV) metric is used to identify whether a token is undervalued or overvalued in a given time frame. The 30-day MVRV ratio for BTC stands at -8.95% on Thursday, recovering from -11.61% earlier in the week, levels last seen during the March correction.
This negative MVRV reading indicates that Bitcoin is currently undervalued, as holders are sitting on unrealized losses. Such conditions are often seen as a potential buy signal, generally increasing buying pressure across exchanges. Historically, when BTC’s MVRV has fallen to similar levels, the price has tended to rebound in the short term.
 [13-1763636290353-1763636290355.05.30, 20 Nov, 2025].png)
Apart from this, the current trading range aligns closely with the average cost basis of BTC ETF holders at around $89,651, a level where Bitcoin previously bottomed in Q1 before staging a recovery, as explained in the previous report.
Some signs to watch for
Despite the currently undervalued conditions and key support zones, traders should remain cautious, as multiple on-chain indicators continue to reflect lingering bearish pressure.
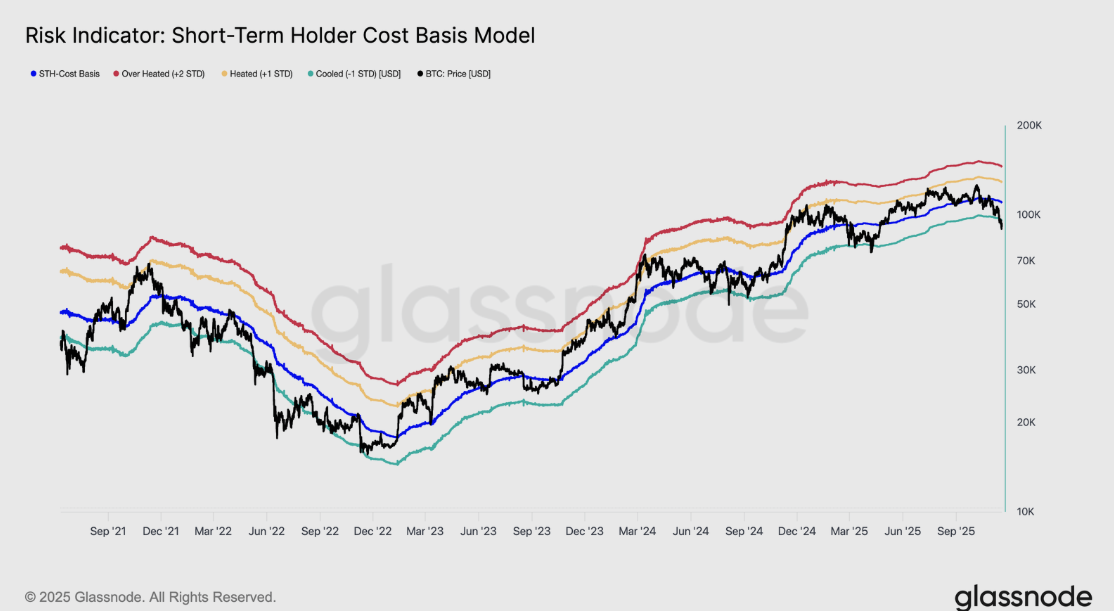
Glassnode’s weekly report on Wednesday highlighted a clear shift in Bitcoin’s market structure, with a decisive breakdown below $97,000. BTC then plunged to $89,000, marking a new local low below the one standard deviation band ($95,400) relative to the short-term holder (STH) cost basis, now near $109,500 as shown in the chart below.
This breakdown confirms that losses now dominate nearly all recent investor cohorts, a structure that has historically triggered panic selling and weakened momentum, requiring time for the market to heal. In the short term, the $95,000–$97,000 range has flipped into resistance, and reclaiming this zone would be the first sign the market is inching back toward equilibrium, according to the Glassnode analyst.
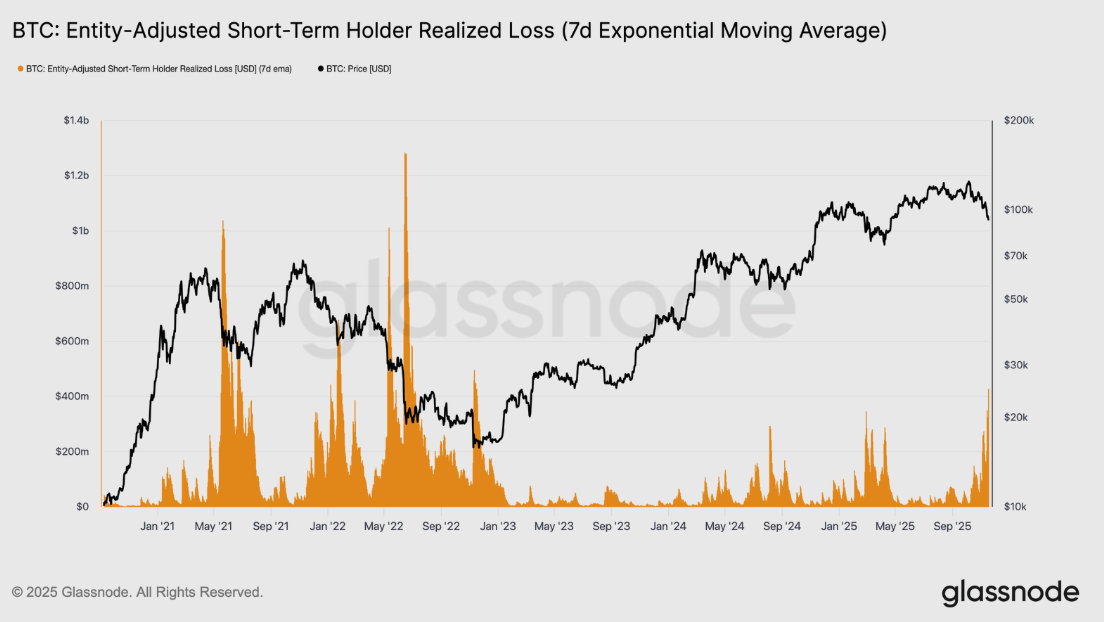
The report further explained that a sharp rise in investor capitulation. This is the third instance since early 2024 where BTC has broken below the lower band of the STH cost-basis model, but the scale of distress is significantly greater. The 7-day EMA of STH realized losses has spiked to $523 million per day, the highest level recorded since the FTX collapse.
“Such elevated loss realization highlights the heavier top structure built between $106,000–$118,000, far denser than previous cycle peaks. This means either stronger demand must emerge to absorb distressed sellers, or the market will require a longer, deeper accumulation phase before regaining equilibrium,” said the analyst.
Bitcoin Price Forecast: BTC consolidates above $90,000 support
Bitcoin began the week on a bearish footing, extending its decline by 2% and closing below the 61.8% Fibonacci retracement level at $94,253 (drawn from the April 7 low of $74,508 to the all-time high of $126,299 set on October 6). The correction intensified on Tuesday as BTC briefly dipped to $89,253, but found support around the key psychological $90,000 level, closing the day above $92,960. Similarly, price action was seen the next day, with Bitcoin sliding to an intraday low of $88,608 before recovering to close above $91,555. At the time of writing on Wednesday, BTC is holding above the $90,000 threshold and trades near $92,000.
If the psychological level at $90,000 continues to hold, BTC could extend the recovery toward the 61.8% Fibonacci retracement at $94,253.
The Relative Strength Index (RSI) on the daily chart is hovering near oversold territory, suggesting bearish momentum may be slowing and a potential short-term rebound could emerge.
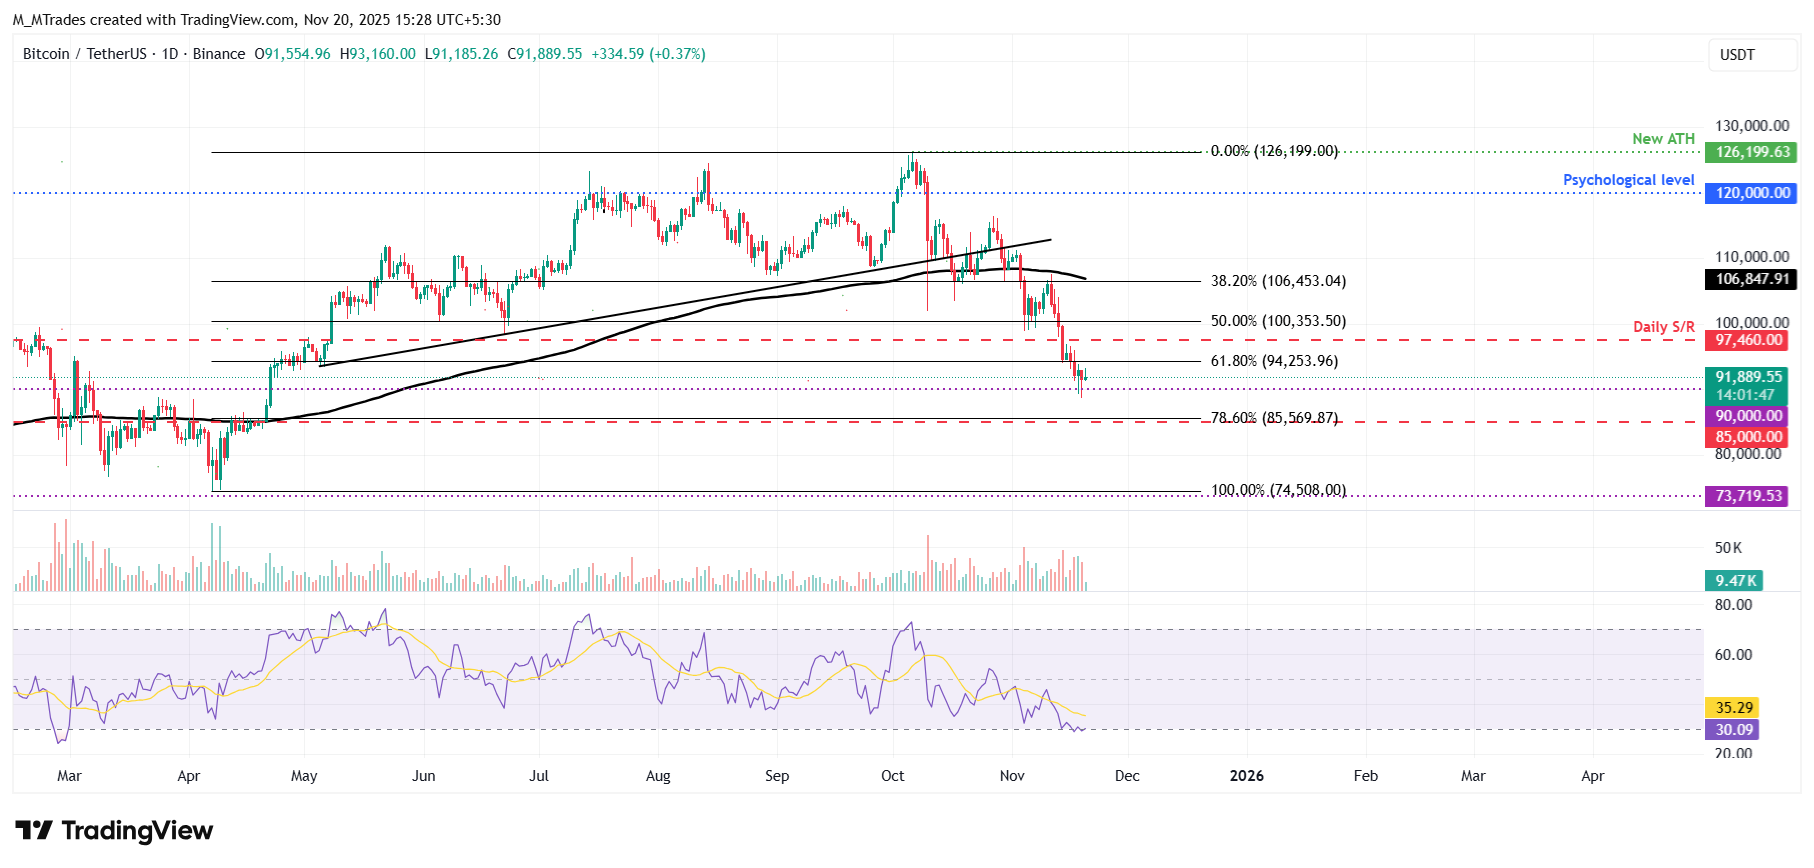
On the other hand, if BTC closes below $90,000, it could extend the correction toward the next daily support at $85,000.
Bitcoin, altcoins, stablecoins FAQs
Bitcoin is the largest cryptocurrency by market capitalization, a virtual currency designed to serve as money. This form of payment cannot be controlled by any one person, group, or entity, which eliminates the need for third-party participation during financial transactions.
Altcoins are any cryptocurrency apart from Bitcoin, but some also regard Ethereum as a non-altcoin because it is from these two cryptocurrencies that forking happens. If this is true, then Litecoin is the first altcoin, forked from the Bitcoin protocol and, therefore, an “improved” version of it.
Stablecoins are cryptocurrencies designed to have a stable price, with their value backed by a reserve of the asset it represents. To achieve this, the value of any one stablecoin is pegged to a commodity or financial instrument, such as the US Dollar (USD), with its supply regulated by an algorithm or demand. The main goal of stablecoins is to provide an on/off-ramp for investors willing to trade and invest in cryptocurrencies. Stablecoins also allow investors to store value since cryptocurrencies, in general, are subject to volatility.
Bitcoin dominance is the ratio of Bitcoin's market capitalization to the total market capitalization of all cryptocurrencies combined. It provides a clear picture of Bitcoin’s interest among investors. A high BTC dominance typically happens before and during a bull run, in which investors resort to investing in relatively stable and high market capitalization cryptocurrency like Bitcoin. A drop in BTC dominance usually means that investors are moving their capital and/or profits to altcoins in a quest for higher returns, which usually triggers an explosion of altcoin rallies.

FXStreet
超過一百萬用戶依賴 FXStreet 獲取即時市場數據、圖表工具、專家洞見與外匯新聞。其全面的經濟日曆與教育網路研討會協助交易者保持資訊領先、做出審慎決策。FXStreet 擁有約 60 人的團隊,分布於巴塞隆納總部及全球各地。
Read More


