
Trade The World
Pi Network Price Forecast: PI technical indicators flash bullish potential
作者 Vishal Dixit
發布日期: 20 Oct 2025 | 修改日期: 20 Oct 2025


POPULAR ARTICLES

Pi Network (PI) trades north of the $0.20 psychological level at press time on Monday, preparing for a W-shaped reversal as selling pressure wanes. However, the on-chain data indicates mixed signals, keeping PI on the edge.
- Pi Network forms a W-shaped pattern, bouncing off the $0.1996 support level.
- A fresh uptrend in the MACD after a crossover on Saturday suggests renewed bullish momentum.
- Outflows from CEXs and Pi Foundation wallet flash mixed on-chain signals.
Pi Network (PI) trades north of the $0.20 psychological level at press time on Monday, preparing for a W-shaped reversal as selling pressure wanes. However, the on-chain data indicates mixed signals, keeping PI on the edge.
CEXs and Foundation token flows remain divided
The retail demand of PI token on the Know Your Business (KYB) verified Centralized Exchanges (CEXs) is on the rise. PiScan data shows that in the last 24 hours, CEXs wallet balances have experienced an outflow of 1.23 million PI tokens. This amounts for nearly 0.01% of the PI total supply or 0.29% of the CEXs wallet balances which is 411.41 million PI tokens.
While the demand increases on exchanges, the Pi Foundation wallet #2 registers an outflow of 1.28 million PI tokens. The near equal but opposite token flows keep the Pi Network on edge.
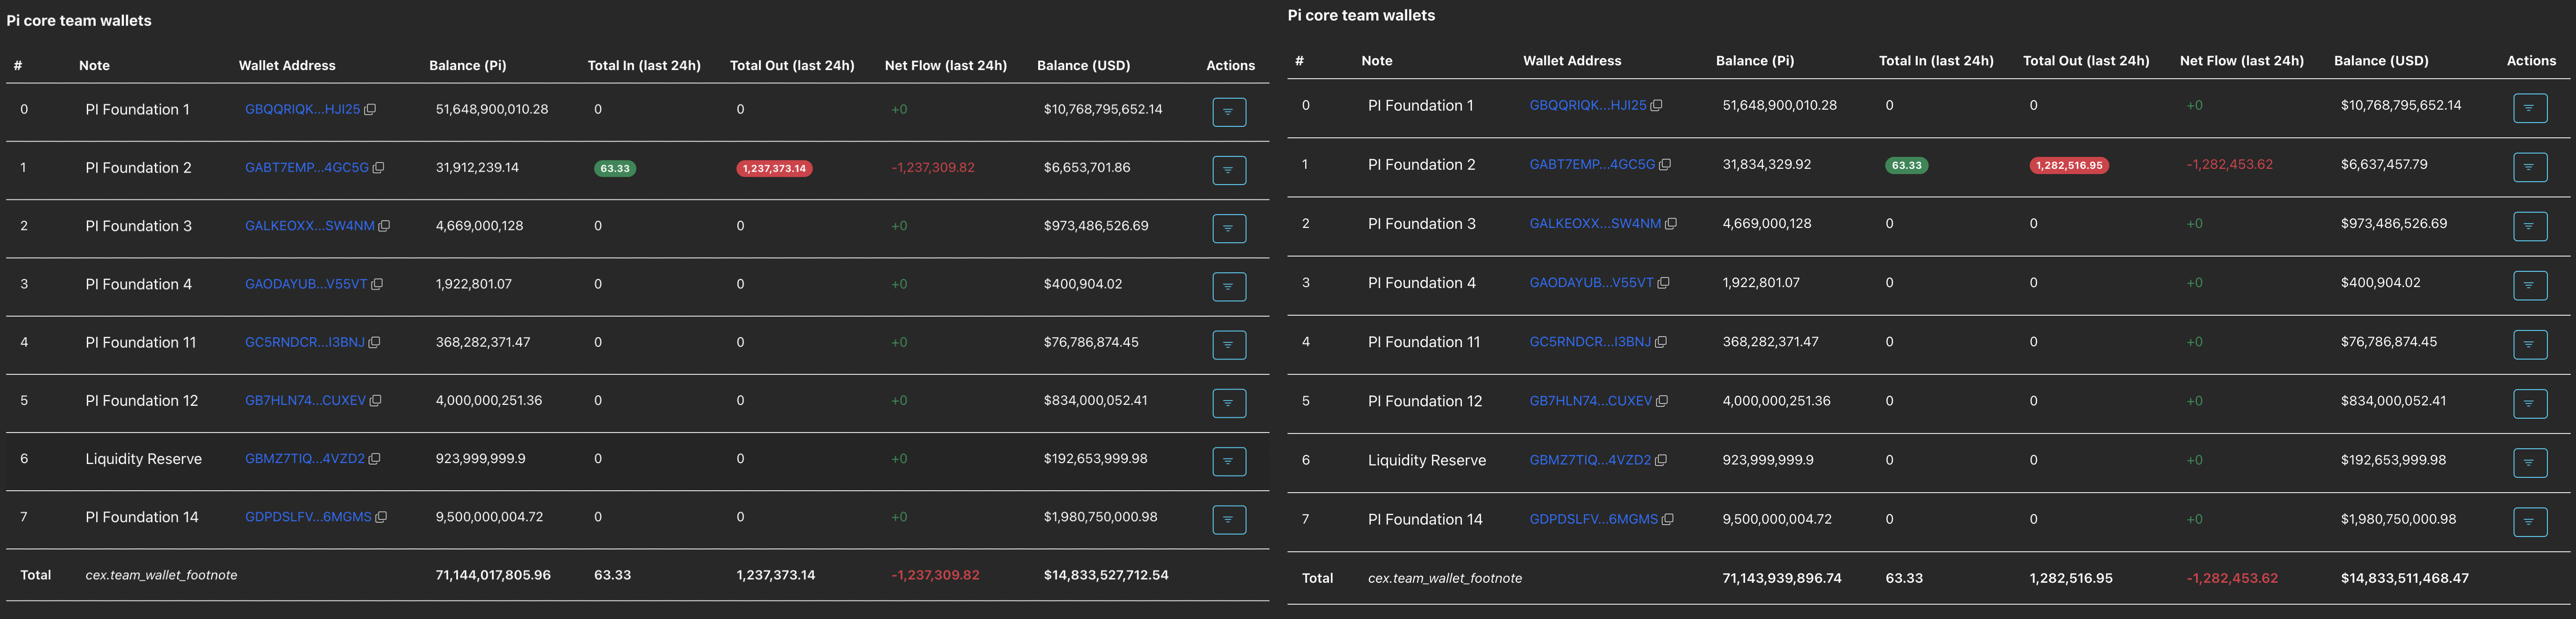
PI CEXs and Foundation wallets balances. PiScan.
Pi Network’s technical indicators flash optimism
Pi Networks ticks higher by 1% at press time on Monday, for the third consecutive day as the broader cryptocurrency market recovers gradually. The mobile mining cryptocurrency expanding to Web3 use cases consolidates between a range extending from $0.2295 and $0.1996, aligning with the open and close of October 10, respectively.
If the recovery run shatters the upper ceiling at $0.2295, confirming the W-shaped pattern breakout, it could target the centre Pivot Point level at $0.2755.
The techncial indicators on the daily chart suggest a renewal in bullish momentum as bears lose grip over trend control. The Moving Average Convergence Divergence (MACD) extends the uptrend after crossing above its signal line on Saturday, indicating the bullish momentum renewal.
At the same time, the Relative Strength Index (RSI) reads 31 on the same chart, rising from the oversold zone, with an upward trend, suggesting a decline in bearish pressure.
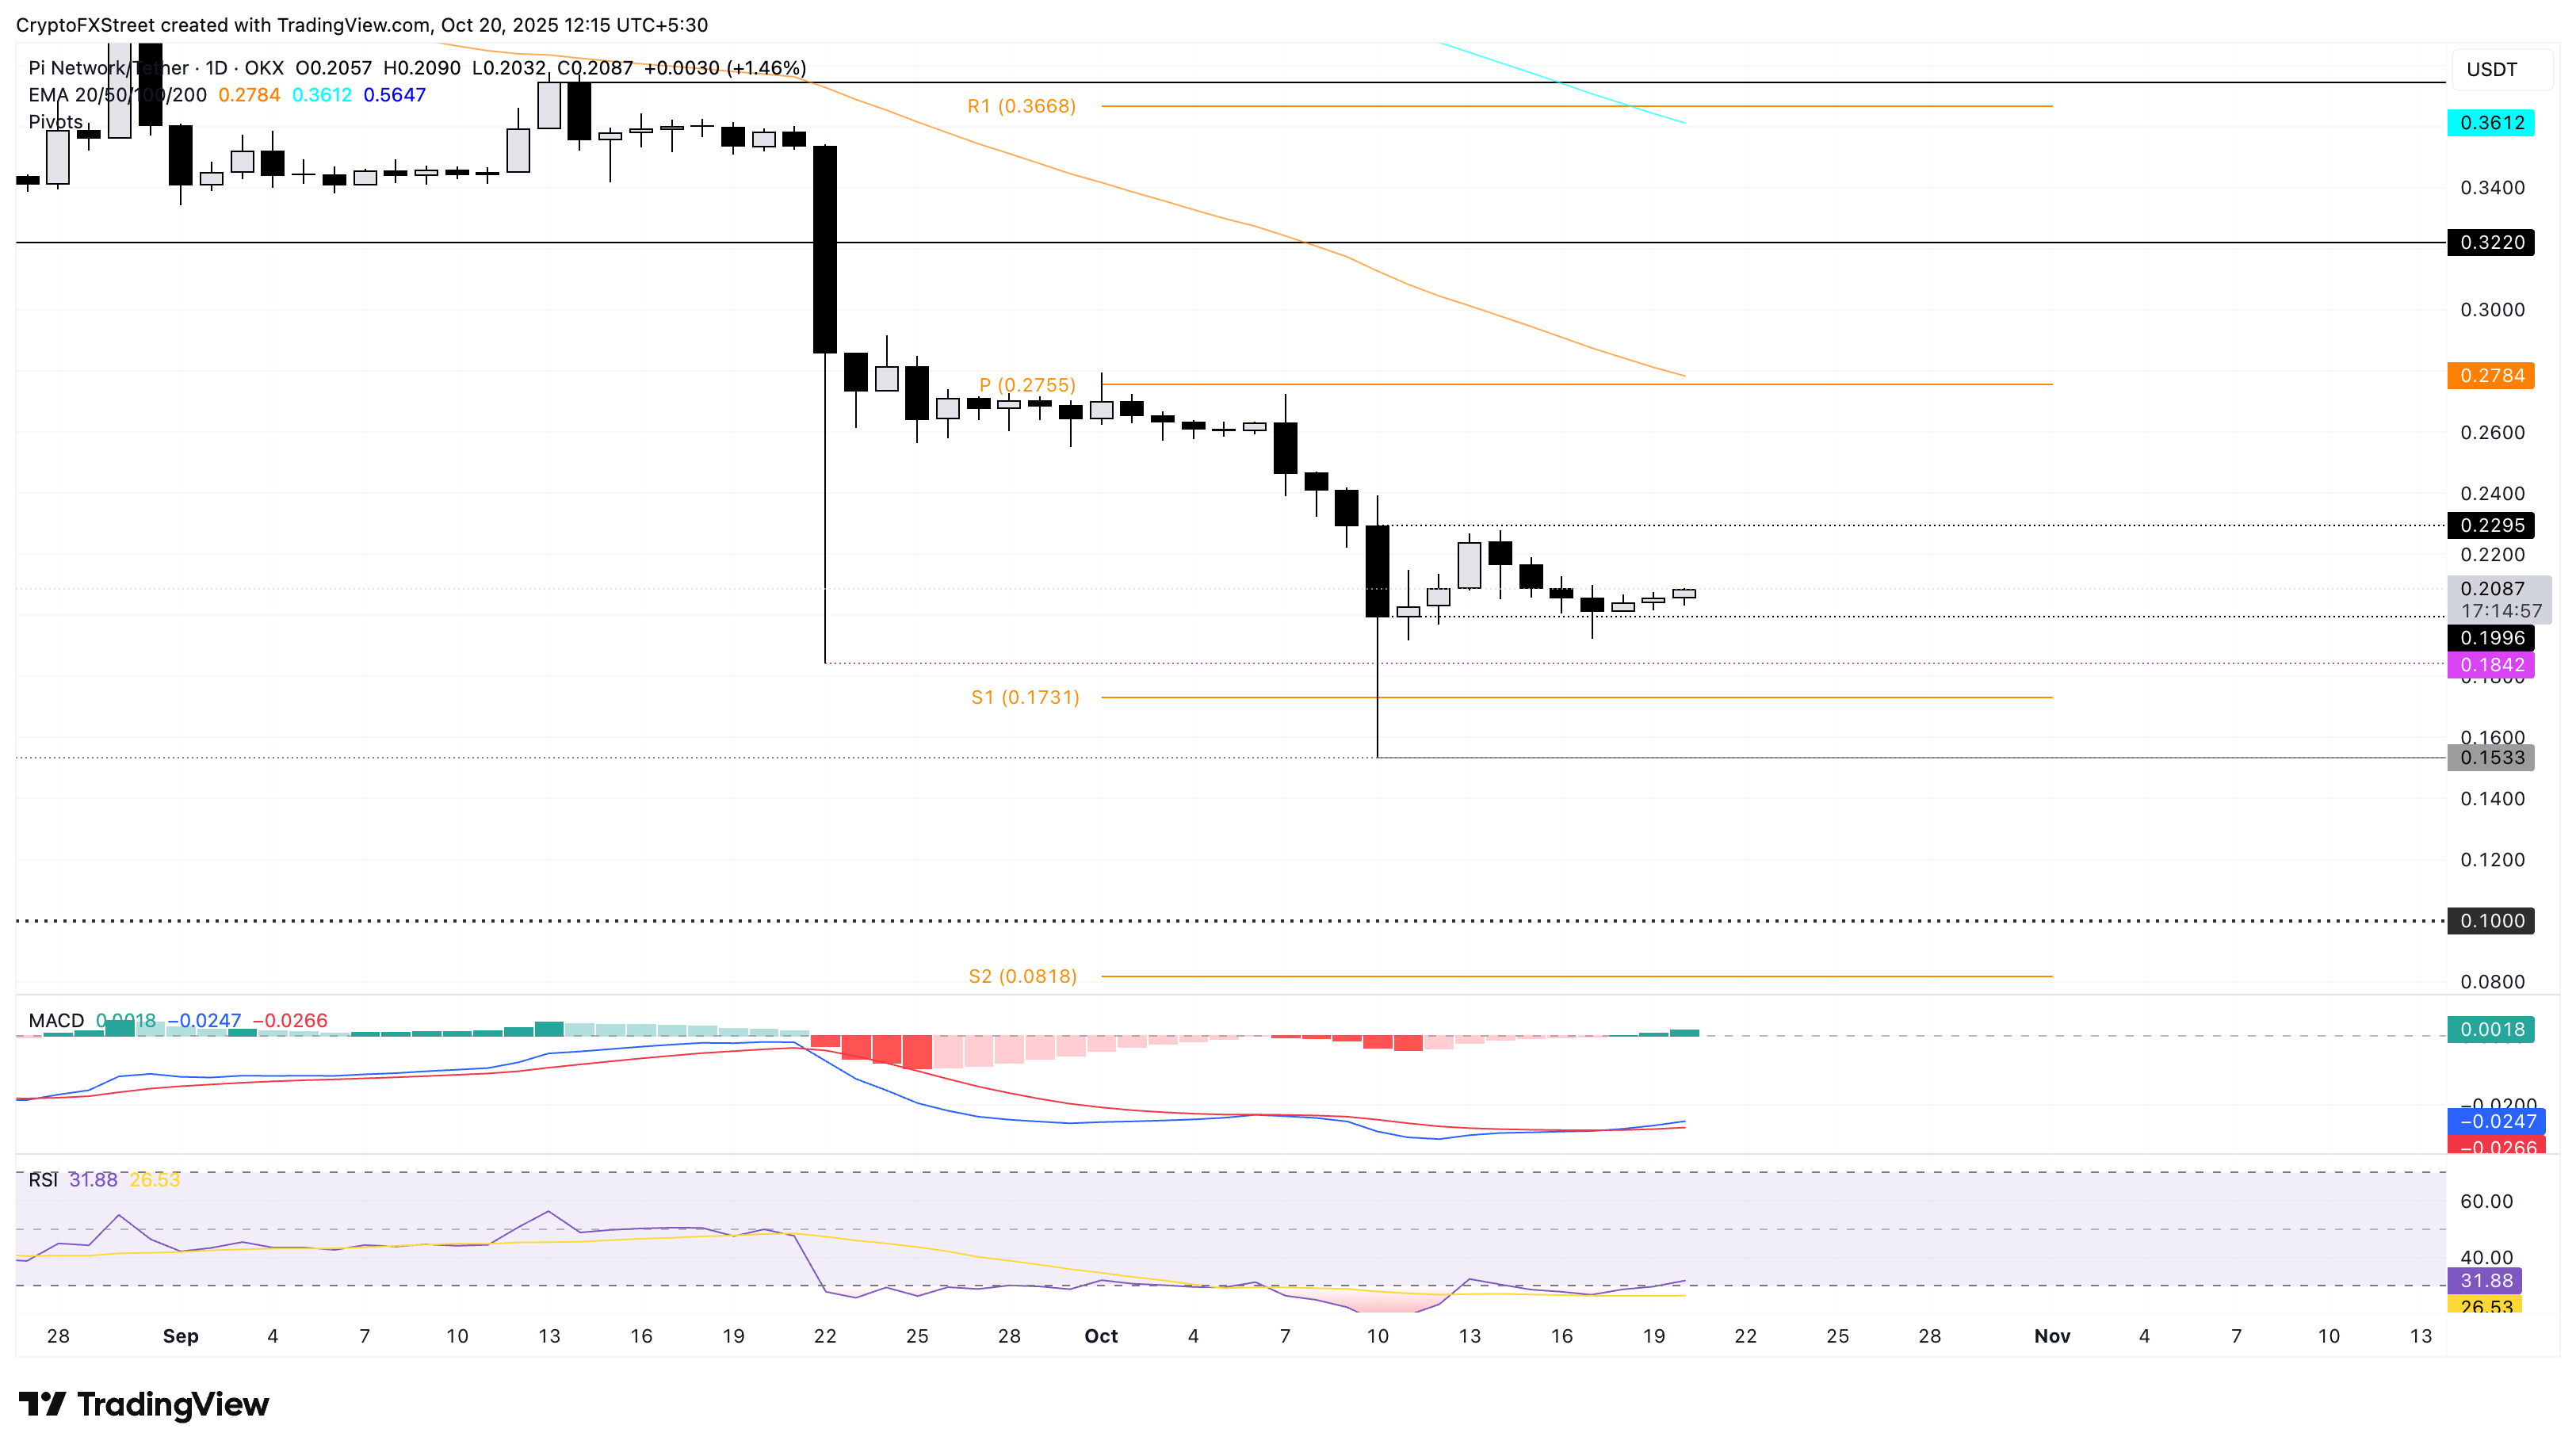
PI/USDT daily price chart.
Still, if PI fails to sustain above the $0.1996 level, it could extend the decline to the S1 Pivot Point level at $0.1731.
Cryptocurrency prices FAQs
Token launches influence demand and adoption among market participants. Listings on crypto exchanges deepen the liquidity for an asset and add new participants to an asset’s network. This is typically bullish for a digital asset.
A hack is an event in which an attacker captures a large volume of the asset from a DeFi bridge or hot wallet of an exchange or any other crypto platform via exploits, bugs or other methods. The exploiter then transfers these tokens out of the exchange platforms to ultimately sell or swap the assets for other cryptocurrencies or stablecoins. Such events often involve an en masse panic triggering a sell-off in the affected assets.
Macroeconomic events like the US Federal Reserve’s decision on interest rates influence crypto assets mainly through the direct impact they have on the US Dollar. An increase in interest rate typically negatively influences Bitcoin and altcoin prices, and vice versa. If the US Dollar index declines, risk assets and associated leverage for trading gets cheaper, in turn driving crypto prices higher.
Halvings are typically considered bullish events as they slash the block reward in half for miners, constricting the supply of the asset. At consistent demand if the supply reduces, the asset’s price climbs.

FXStreet
超過一百萬用戶依賴 FXStreet 獲取即時市場數據、圖表工具、專家洞見與外匯新聞。其全面的經濟日曆與教育網路研討會協助交易者保持資訊領先、做出審慎決策。FXStreet 擁有約 60 人的團隊,分布於巴塞隆納總部及全球各地。
Read More


