
Trade The World
Solana Price Forecast: SOL bears are in control of the momentum
作者 Manish Chhetri
發布日期: 24 Sep 2025 | 修改日期: 24 Sep 2025


POPULAR ARTICLES

Solana (SOL) is trading in the red, currently below $209 at the time of writing on Wednesday, having declined by more than 10% so far this week. On-chain and derivatives data further support the bearish view, as declines in daily active addresses, rises in short positions, and seller dominance.
- Solana price trades in red on Wednesday, down more than 10% so far this week.
- Metrics indicate a bearish setup with declining daily active addresses, rising short positions, and seller dominance.
- Momentum indicators flash weakness, suggesting SOL could extend its correction further.
Solana (SOL) is trading in the red, currently below $209 at the time of writing on Wednesday, having declined by more than 10% so far this week. On-chain and derivatives data further support the bearish view, as declines in daily active addresses, rises in short positions, and seller dominance. The technical outlook also suggests weakness in the momentum indicators, indicating a deeper correction on the horizon.
On-chain data and derivatives show signs of a bearish outlook
Santiment’s Daily Active Addresses index, which tracks network activity over time, also paints a bearish picture for Solana. A rise in the metric signals greater blockchain usage, while declining addresses point to lower demand for the network.
In SOL’s case, Daily Active Addresses have been constantly falling since mid-June and currently stand at 2.43 million as of Tuesday. This indicates that demand for SOL’s blockchain usage is decreasing, which doesn’t bode well for the Solana price.
 [09-1758689412785-1758689412786.02.29, 24 Sep, 2025].png)
Solana daily active addresses chart. Source: Santiment
Apart from falling network usage, CryptoQuant data highlights selling pressure on Solana. The Futures Taker CVD (Cumulative Volume Delta) for SOL turned from neutral to negative on September 13, and the value has been steadily decreasing since then. This indicator measures the cumulative difference between market buy and sell volumes over a three-month period. When the 90-day CVD is positive and increasing, it suggests the Taker Buy Dominant Phase, while a negative and decreasing value indicates the Taker Sell Dominant Phase.
-1758689438357-1758689438358.png)
Solana Futures Taker CVD chart. Source: CryptoQuant
On the derivatives side, the Coinglass long-to-short ratio for Solana reads 0.80 on Tuesday. This ratio, below one, reflects bearish sentiment in the markets, as more traders are betting on the asset price to fall.
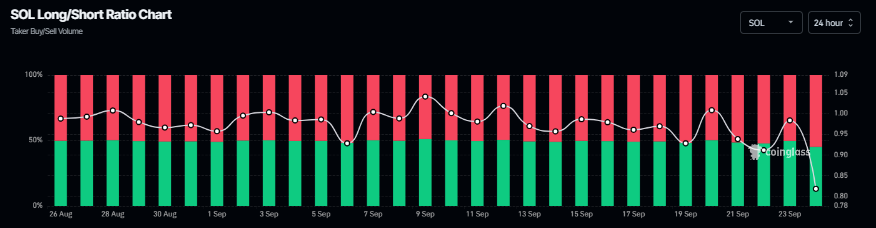
Solana long-to-short ratio chart. Source: Coinglass
Some signs of optimism
Despite these bearish signs from on-chain and derivatives data, Solana shows some signs of optimism.
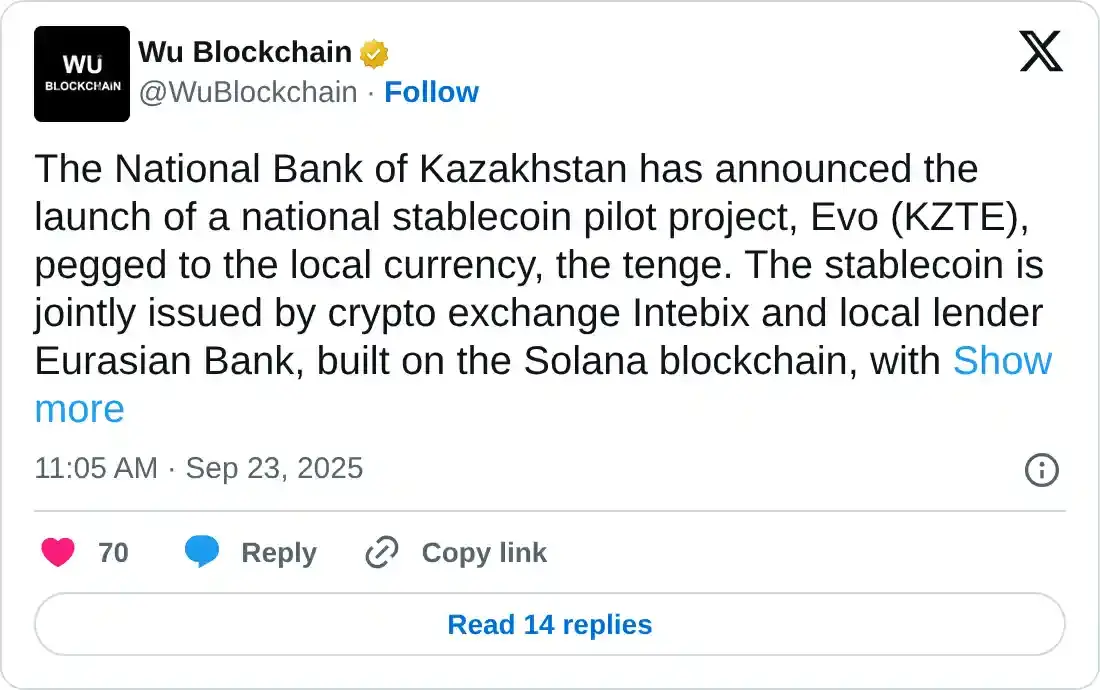
On Tuesday, Kazakhstan’s central bank launched a pilot project with a new stablecoin called Evo, pegged to the local fiat currency in collaboration with Solana and Mastercard.
“Today, we are launching Kazakhstan’s first stablecoin, denominated in our national currency, the tenge, within the National Bank’s regulatory sandbox. This opens up new prospects for the development of financial services, increased financial inclusion, the creation of innovative products, and, overall, the advancement of our country,” said Timur Suleimenov, Chairman of the National Bank of Kazakhstan.
Earlier on Monday, Helius Medical Technologies, Inc. (HSDT) announced its first acquisition of Solana (SOL) tokens as part of its digital asset treasury strategy. The company now holds more than 760,190 SOL at an average cost basis of $231, bringing its total SOL stake to approximately $167 million. It also revealed an excess of $335 million in cash reserves, which the company plans to allocate toward advancing its digital asset treasury strategy.
Growing partnerships and corporate settings are increasingly Solana-based treasuries, highlighting the rising adoption and wider acceptance. Furthermore, growing institutional interest further enhances its credibility and long-term adoption prospects.
Solana Price Forecast: SOL bears tighten grip as momentum slows
Solana price failed to find support around the daily level at $230 on Monday and declined by nearly 10% by Tuesday. At the time of writing on Wednesday, it continues to trade down at around $208.
If SOL continues its correction and closes below the 50-day Exponential Moving Average (EMA) at $209.58 on a daily basis, it could extend the decline toward its next daily support at $184.13.
The Relative Strength Index (RSI) on the daily chart reads 42, below its neutral level of 50, indicating strong bearish momentum. The Moving Average Convergence Divergence (MACD) indicator also showed a bearish crossover on Monday, giving sell signals. Moreover, the rising red histogram bars below the neutral level also suggest a bearish momentum and continuation of the downward trend.
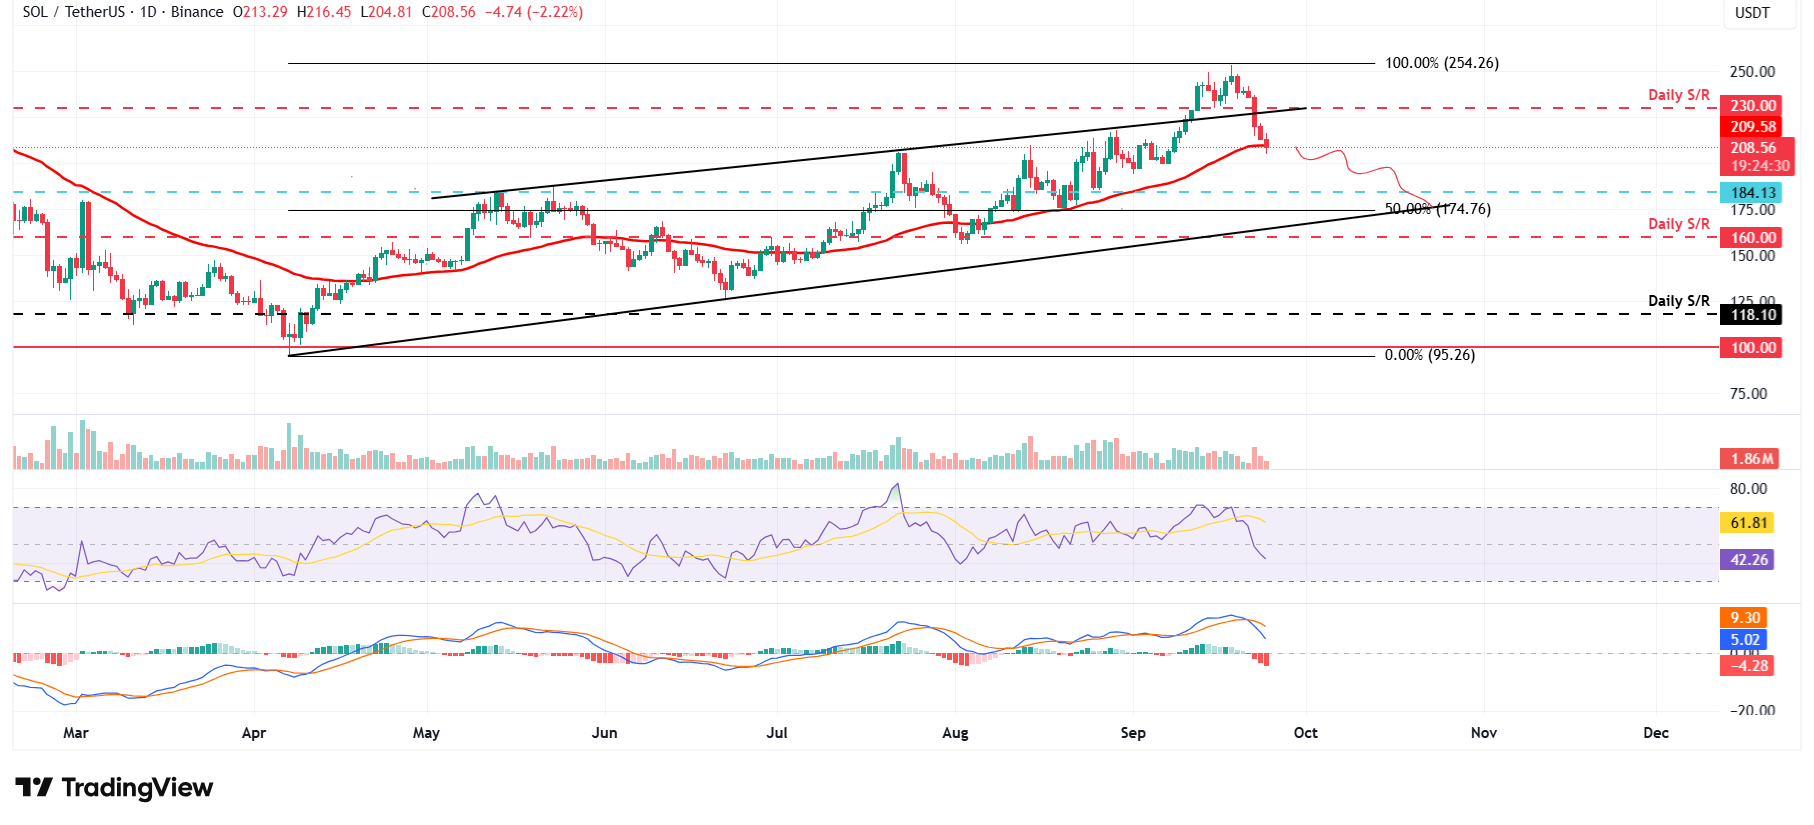
SOL/USDT daily chart
However, if SOL finds support around the 50-day EMA at $209.58 and recovers, it could extend the recovery toward its daily resistance level at $230.

FXStreet
超過一百萬用戶依賴 FXStreet 獲取即時市場數據、圖表工具、專家洞見與外匯新聞。其全面的經濟日曆與教育網路研討會協助交易者保持資訊領先、做出審慎決策。FXStreet 擁有約 60 人的團隊,分布於巴塞隆納總部及全球各地。
Read More


