
Trade The World
Sui Price Forecast: Extends rally with bullish indicators targeting $2.34
作者 Manish Chhetri
發布日期: 6 Jan 2026 | 修改日期: 6 Jan 2026


POPULAR ARTICLES

Sui (SUI) price trades above $1.95 near a two-month high at the time of writing on Tuesday, extending its rally after printing six consecutive green candlesticks.
- Sui price extends gains above $1.95 on Tuesday, printing six consecutive green candlesticks.
- On-chain and derivatives data support a positive outlook, with rising trading volume, TVL, and open interest.
- The technical outlook suggests further gains, with bulls aiming for levels above $2.34.
Sui (SUI) price trades above $1.95 near a two-month high at the time of writing on Tuesday, extending its rally after printing six consecutive green candlesticks. Positive on-chain and derivatives data further support the bullish momentum, while technical analysis suggests further gains, targeting the immediate resistance at $2.34.
On-chain and derivatives data suggest growing market participation
Santiment data indicates that the Sui ecosystem’s trading volume (the aggregate trading volume generated by all exchange applications on the chain) reached $967.43 million on Tuesday, the highest since early December, and has been steadily rising since then. This volume rise indicates a surge in traders’ interest and liquidity in Sui, boosting its bullish outlook.
 [07-1767669449622-1767669449624.35.14, 06 Jan, 2026].png)
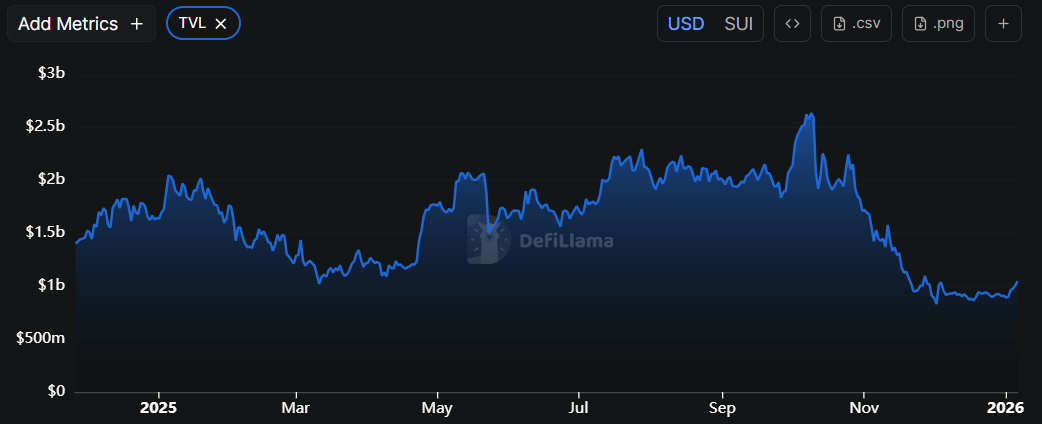
Data from crypto intelligence tracker DefiLlama shows that Sui’s Total Value Locked (TVL) has been steadily rising since the end of December, reaching $1.04 billion on Tuesday. This increase in TVL indicates growing activity and interest in Sui’s ecosystem, suggesting that more users are depositing or using assets on SUI-based protocols.
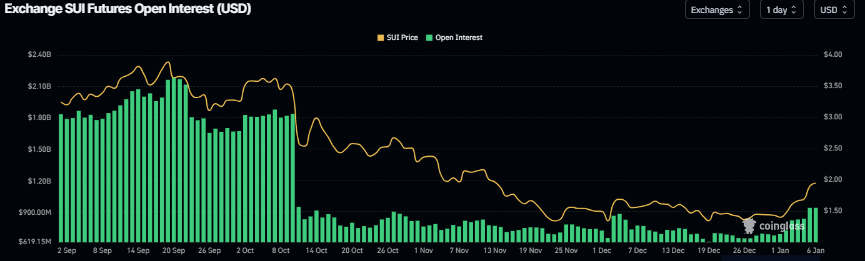
On the derivatives side, CoinGlass’ data shows that SUI futures Open Interest (OI) at exchanges rose to $947.26 million on Tuesday, up from $685 million on Wednesday, the highest level since October 10. An increasing OI represents new or additional money entering the market and new buying, which could fuel the current SUI price rally.
Sui Price Forecast: SUI bulls aiming for levels above $2.34
Sui price broke above the falling wedge pattern (formed by connecting multiple highs and lows since October) on December 26 and rose by more than 35% through Monday. At the time of writing on Tuesday, SUI continues to trade higher above $1.94.
If SUI continues its upward trend, it could extend the rally toward the weekly resistance level at $2.34.
The Relative Strength Index (RSI) on the daily chart is 73, above the overbought threshold, indicating strong bullish momentum. In addition, the Moving Average Convergence Divergence (MACD) indicator shows a bullish crossover and rising green histogram bars above the neutral level, further supporting the bullish outlook.
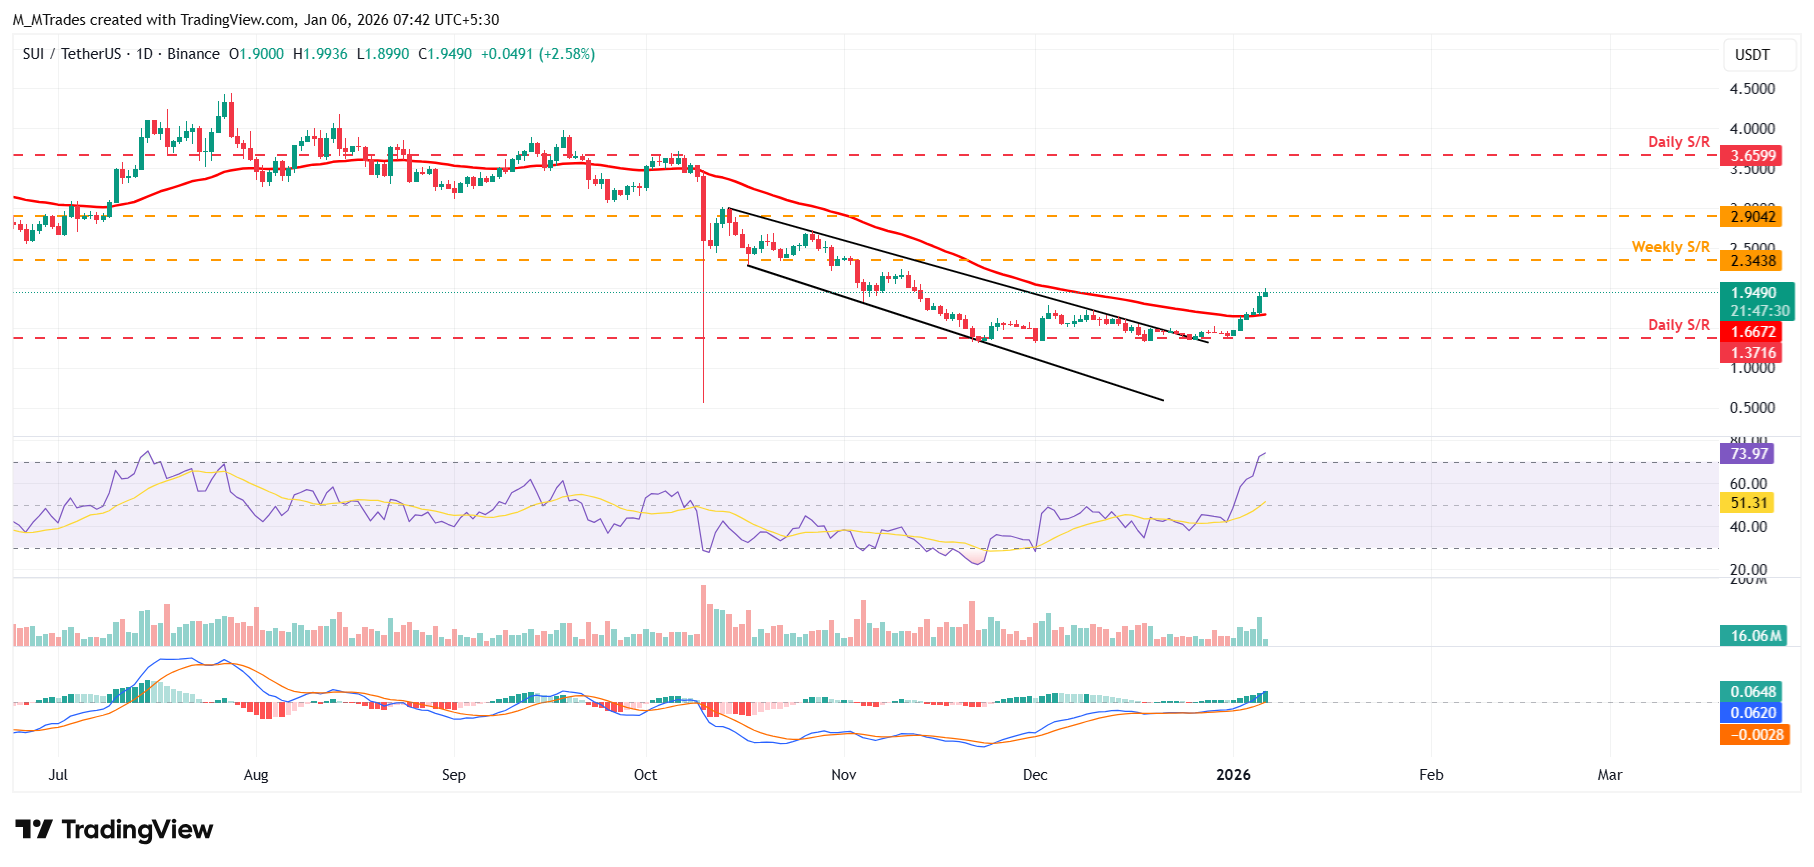
On the other hand, if SUI corrects, it could extend the decline toward the 50-day Exponential Moving Average (EMA) at $1.66.

FXStreet
超過一百萬用戶依賴 FXStreet 獲取即時市場數據、圖表工具、專家洞見與外匯新聞。其全面的經濟日曆與教育網路研討會協助交易者保持資訊領先、做出審慎決策。FXStreet 擁有約 60 人的團隊,分布於巴塞隆納總部及全球各地。
Read More


