
Trade The World
US Dollar Index (DXY) recovery loses steam at 97.80
作者 Guillermo Alcala
發布日期: 12 Sep 2025 | 修改日期: 12 Sep 2025


POPULAR ARTICLES

The US Dollar bounced up from lows earlier on Friday, but upside attempts remain limited below the 98.00 level so far, which keeps price action trapped within the previous day’s range, and maintains the broader bearish trend intact.
- The US Dollar Index loses steam at 97.80 and keeps the broader bearish trend intact.
- Weak US employment and moderate inflation figures pave the path for Fed cuts.
- The DXY is approaching a key support area above 97.00.
The US Dollar bounced up from lows earlier on Friday, but upside attempts remain limited below the 98.00 level so far, which keeps price action trapped within the previous day’s range, and maintains the broader bearish trend intact.
Data released on Thursday showed a moderate acceleration in consumer inflation, but the sharp increase in the weekly jobless claims gathered more interest. The largest increase in claims in the last four years confirms the weak momentum of the US labour market and paves the path to a Fed rate cut next week, and at least another one before the year-end.
Technical Analysis: The 97.10-97.25 is a key support area
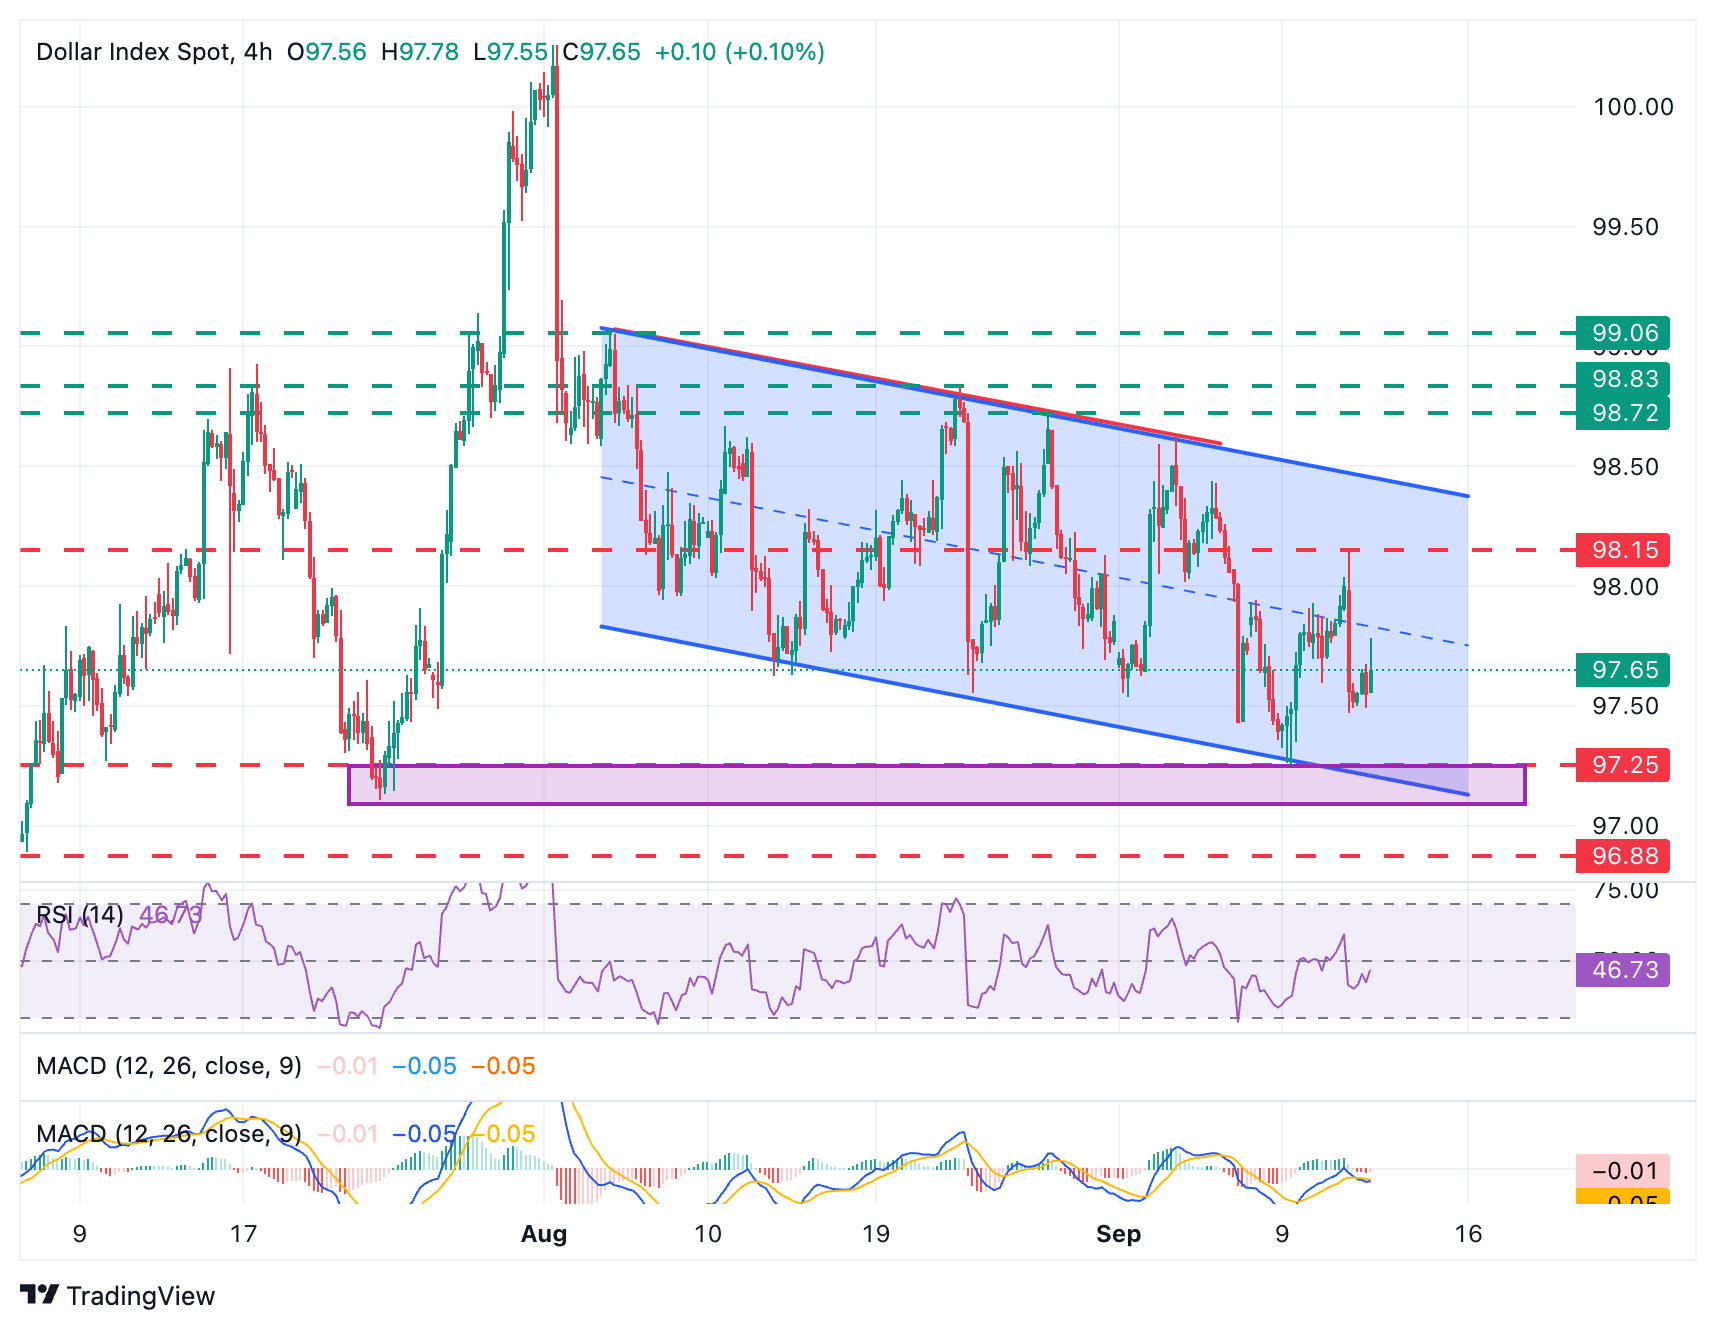
The technical picture remains bearish. The Daily and the 4-hour Relative Strength Index remain below the 50 levels, suggesting that rallies are likely to find buyers. Recent price action shows a descending channel from the August 5 high, underpinning the bearish view.
The recent US Dollar’s recovery has found resistance at the 97.80 level, below Thursday’s high, at 98.15. This level and the channel top, now at the 98.50 area, need to be broken to confirm a trend shift.
To the downside, immediate support is at the intraday low of 97.50, with key support area at the 9710-9725 area, which encloses the lows of July 24 and August 8, and the bottom of the descending channel. Further down, the July 4 and 7 lows, near 96.90, will come into focus.
US Dollar Price This week
The table below shows the percentage change of US Dollar (USD) against listed major currencies this week. US Dollar was the strongest against the Canadian Dollar.
| USD | EUR | GBP | JPY | CAD | AUD | NZD | CHF | |
|---|---|---|---|---|---|---|---|---|
| USD | -0.15% | -0.35% | -0.28% | 0.06% | -1.44% | -1.02% | -0.21% | |
| EUR | 0.15% | -0.21% | -0.05% | 0.19% | -1.29% | -0.83% | -0.06% | |
| GBP | 0.35% | 0.21% | 0.08% | 0.41% | -1.08% | -0.59% | 0.16% | |
| JPY | 0.28% | 0.05% | -0.08% | 0.27% | -1.18% | -0.89% | 0.10% | |
| CAD | -0.06% | -0.19% | -0.41% | -0.27% | -1.40% | -1.03% | -0.26% | |
| AUD | 1.44% | 1.29% | 1.08% | 1.18% | 1.40% | 0.46% | 1.24% | |
| NZD | 1.02% | 0.83% | 0.59% | 0.89% | 1.03% | -0.46% | 0.78% | |
| CHF | 0.21% | 0.06% | -0.16% | -0.10% | 0.26% | -1.24% | -0.78% |
The heat map shows percentage changes of major currencies against each other. The base currency is picked from the left column, while the quote currency is picked from the top row. For example, if you pick the US Dollar from the left column and move along the horizontal line to the Japanese Yen, the percentage change displayed in the box will represent USD (base)/JPY (quote).

FXStreet
超過一百萬用戶依賴 FXStreet 獲取即時市場數據、圖表工具、專家洞見與外匯新聞。其全面的經濟日曆與教育網路研討會協助交易者保持資訊領先、做出審慎決策。FXStreet 擁有約 60 人的團隊,分布於巴塞隆納總部及全球各地。
Read More


