
Trade The World
Bitcoin Weekly Forecast: BTC rides the US inflation rollercoaster
作者 Manish Chhetri
發布日期: 15 Aug 2025 | 修改日期: 15 Aug 2025


POPULAR ARTICLES

Bitcoin (BTC) price experiences a whirlwind week, surging to a new all-time high of $124,474 before sharply retreating to hover around $118,800 at the time of writing on Friday.
- Bitcoin hits an all-time high of $124,474 and then retreats sharply in a volatile week.
- US inflation data fueled BTC’s surge to record highs but also triggered the subsequent pullback.
- On-chain data shows $1.89 billion in long positions unwound as BTC fell below $118,000, signaling a sentiment shift from bullish to cautious.
Bitcoin (BTC) price experiences a whirlwind week, surging to a new all-time high of $124,474 before sharply retreating to hover around $118,800 at the time of writing on Friday. This market volatility was mainly driven by mixed signals from US inflation data, which initially ignited bullish momentum and later triggered a market pullback. On-chain data shows over $1.8 billion in long positions were unwound due to the recent pullback, highlighting a notable shift in sentiment from bullish to cautious.
Bitcoin sees volatility amid mixed US inflation data
Bitcoin price reached a new all-time high of $124,474 on Thursday, but failed to maintain the upward trend and declined 4% that day and stabilized around $118,900 on Friday.
During the first half of this week, BTC broadly traded high as the market participants' risk appetite got boosted by the US Consumer Price Index (CPI) data on Tuesday. The US CPI data came slightly softer than expected, strengthening the case for a September Fed rate cut.
Following the data release, US Treasury Secretary Scott Bessent said in an interview on Fox Business on Tuesday that the Fed should go for a larger, 50-basis-point rate cut. Expectations of swift and large Fed rate cuts cheered risk markets.
However, this optimism waned somewhat on Thursday after the US Producer Price Index (PPI) data was released by the Bureau of Labor Statistics (BLS). The PPI figures significantly exceeded economists’ expectations, suggesting that inflation is gradually escalating in the pipeline. PPI data triggered a wave of risk-off sentiment that pushed BTC below $118,000 and effectively ruled out the possibility of a larger 50-basis-point rate cut.
Bitcoin’s long position unwinds, liquidating leverage traders
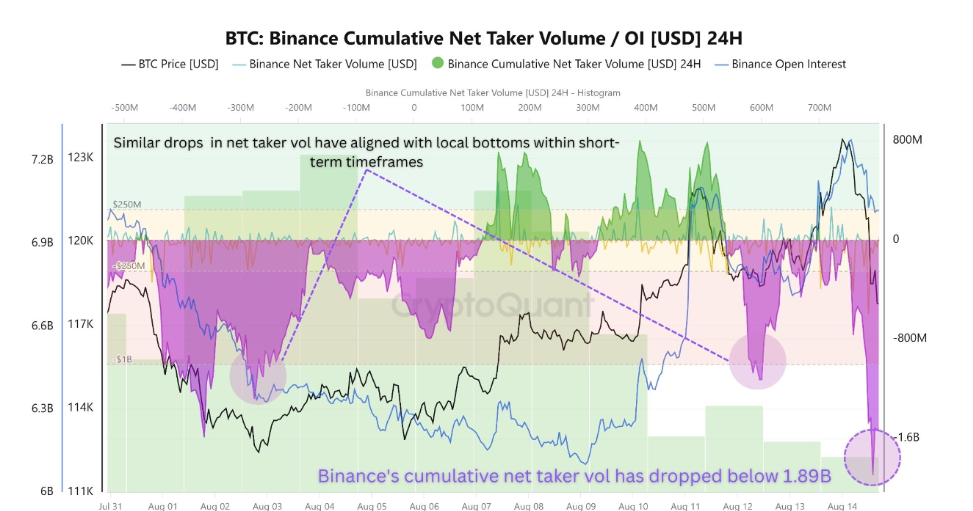
CryptoQuant's chart below shows that a $1.89 billion long position unwind occurred as BTC dropped below $118,000 this week. This sharp fall indicates aggressive selling or the closure of long positions, as reported earlier.
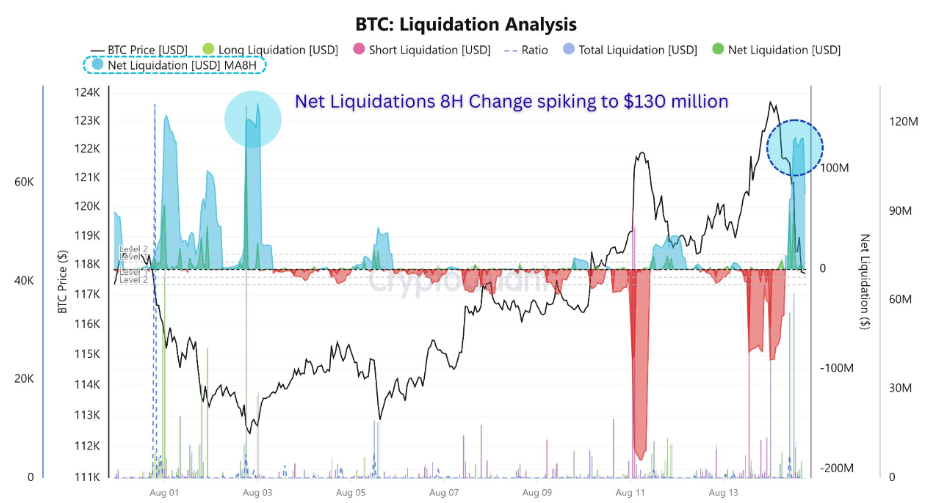
An examination of the liquidation data reveals that the latest round of forced position closures primarily affected late long positions, indicating that traders were overly bullish. The Net Liquidations 8-hour chart below shows a spike to $130 million. This pattern indicates a long squeeze — a scenario where falling prices trigger cascading sell orders from overleveraged buyers.
Institutional and corporate demand remain robust
Institutional and corporate demand continued to strengthen despite the price woes, contributing to push BTC to record highs. Corporate companies like Strategy, Metaplanet, Smarter Web Company, Capital B, and many others have added more BTC to their treasury, highlighting growing adoption and confidence.
The Bitcoin Treasury Strategy report by Sentora shows that 213 entities, including companies and governments, hold a total of $228.85 billion worth of BTC. The chart below shows that public companies hold 71.4%, private companies 24.4%, and governments and other entities hold the remaining 4.2%.
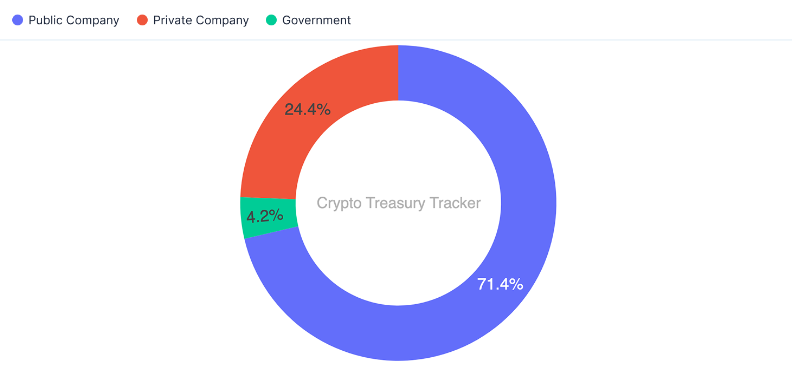
BTC entity distribution chart. Source: Sentora
The report further explained that the holding has been increasing steadily in recent years, from a combined amount of 1.1 million BTC in 2024 to over 1.77 million BTC in August 2025. This growth is largely driven by the companies acquiring Bitcoin as part of the popular Bitcoin treasury strategy.
SoSoValue data also shows that institutional investors have recorded a total net inflow of $561.95 million this week until Thursday. These net weekly inflows were slightly higher than the previous week, but remained lower than those seen during mid-July, when the BTC price reached a similar level.
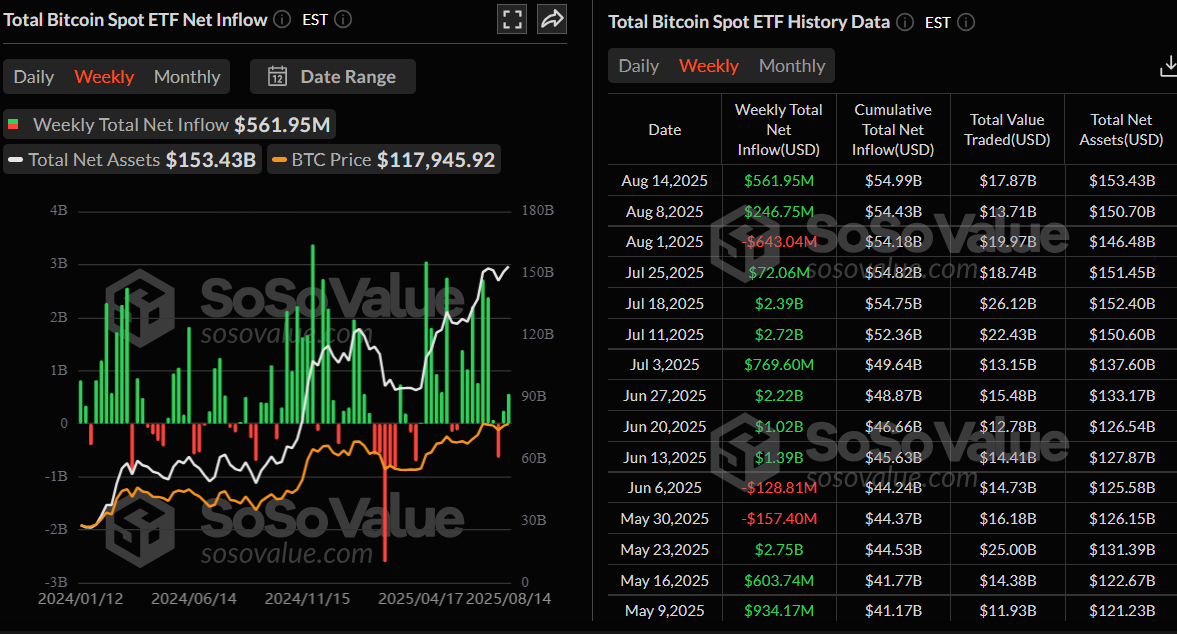
Total Bitcoin Spot ETF Net Inflow chart
Some signs of optimism for BTC
David Bailey’s Bitcoin firm, Nakamoto, completed its merger with healthcare company KindlyMD to establish a Bitcoin treasury on Thursday, planning to accumulate 1 million BTC. The firm raised $540 million in gross proceeds through the PIPE financing to fund its Bitcoin purchases and expects to close the previously announced $200 million convertible note offering by Friday.
The news is bullish for Bitcoin in the long term as more companies are keeping BTC in their reserves, highlighting wider adoption and acceptance.
The Hong Kong Securities and Futures Commission (SFC) issued a new guidance for virtual asset trading platforms (VATPs) on Friday, ensuring the robust custody of client virtual assets. The move comes after multiple overseas custody failures and an SFC review earlier this year that found gaps in some operators’ cybersecurity controls.
Moreover, earlier this month, Hong Kong passed a new stablecoin regulation and has also emerged as China’s testing ground for cryptocurrency assets in the country, given that the industry is banned on the mainland. These ongoing developments and regulatory push by the Hong Kong government act as a bullish outlook for Bitcoin.
Will BTC recover to its record high or continue its correction?
Bitcoin price reached a new all-time high of $124,474 on Thursday but failed to maintain the upward momentum and declined 4% on the same day. At the time of writing on Friday, it trades at around $118,800.
If BTC holds above the $116,000 support level, it could extend the rally to its record high of $124,474.
The Relative Strength Index (RSI) reads 54 on the daily chart, above its neutral level of 50, indicating bulls still have room for upward momentum. The Moving Average Convergence Divergence (MACD) indicator showed a bullish crossover on Monday, giving a buy signal.
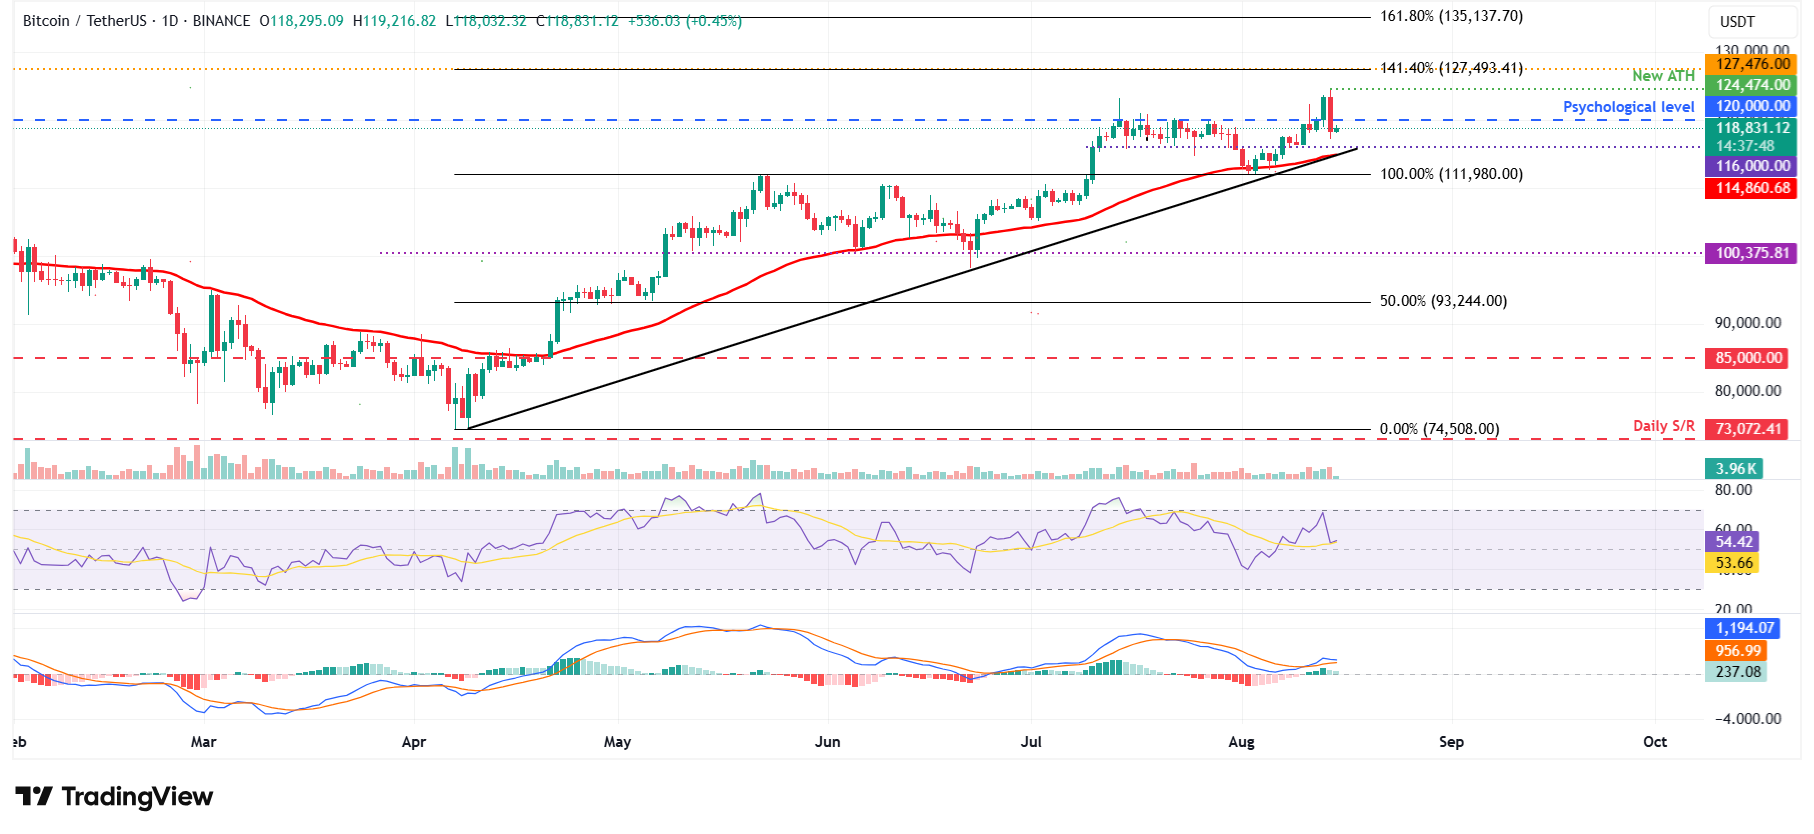
BTC/USDT daily chart
If BTC closes below its $116,000 support on a daily basis, it could extend the decline toward the next key support $111,980.

Acuity Trading
Acuity Trading 是一家成立於 2013 年、總部位於倫敦的金融科技公司,專注於 AI 驅動的另類數據與情緒分析,用於交易與投資。他們以可視化新聞與情緒工具革新線上交易體驗,並持續以最新 AI 研究與技術提供可產生阿爾法的另類數據與高度互動的交易工具。
Read More


