
Trade The World
Cardano price forecast: ADA tests key support at $0.38 with mixed outlook
作者 Manish Chhetri
發布日期: 13 Jan 2026 | 修改日期: 13 Jan 2026


POPULAR ARTICLES

Cardano (ADA) price is nearing key support at $0.38 on Tuesday, after being rejected by the 50-day Exponential Moving Average (EMA) the previous week.
- Cardano price nears key support at $0.38 on Tuesday after rejecting the 50-day EMA at $0.41 last week.
- On-chain and derivatives metrics show mixed signals: selective whale accumulation and rising long positions contrast with negative funding rates and declining social dominance.
- Technical outlook indicates a potential rebound if $0.38 support level holds, while a confirmed break below $0.38 would signal a deeper correction.
Cardano (ADA) price is nearing key support at $0.38 on Tuesday, after being rejected by the 50-day Exponential Moving Average (EMA) the previous week. Market metrics show mixed signals: whale accumulation and rising long bets suggest underlying interest, whereas negative funding rates and declining social dominance indicate cautious sentiment. On the technical side, ADA is near a crossroads; a hold above support suggests price recovery, while a close below indicates a deeper correction.
Mixed sentiment among investors
Santiment’s Supply Distribution data supports a bullish outlook for Cardano, as certain whales are buying ADA at recent price dips.
The metric indicates that whales holding between 10 million and 100 million ADA tokens (blue line) have accumulated a total of 180 million ADA tokens from January 8 to Tuesday. During the same period, another whale holding between 1 million and 10 million ADA tokens (yellow line) and 100,000 and 1 million ADA (red line) shed a total of 50 million tokens.
This shows that the second cohort of whales could have fallen prey to a capitulation event. In contrast, the first set of wallets seized the opportunity and accumulated Cardano at a discount.
 [07-1768276879580-1768276879581.52.47, 13 Jan, 2026].png)
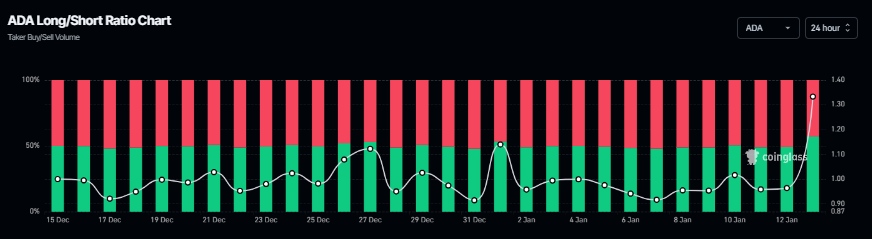
Coinglass’s long-to-short ratio for ADA stood at 1.33 on Tuesday, the highest level in over a month. The ratio above one suggests that more traders are betting on the Cardano price to rally.
Cardano's social dominance refers to the share of ADA-related discussions in the cryptocurrency media, which supports a bearish case. Santiment’s data indicates that, among all crypto media discussions, ADA’s share is 0.037%, the lowest level since early December and it has also been falling since early January. This decline indicates waning investor attention and reduced speculative interest, often coinciding with softer demand and weaker near-term price momentum.
 [09-1768276944079-1768276944080.05.01, 13 Jan, 2026].png)
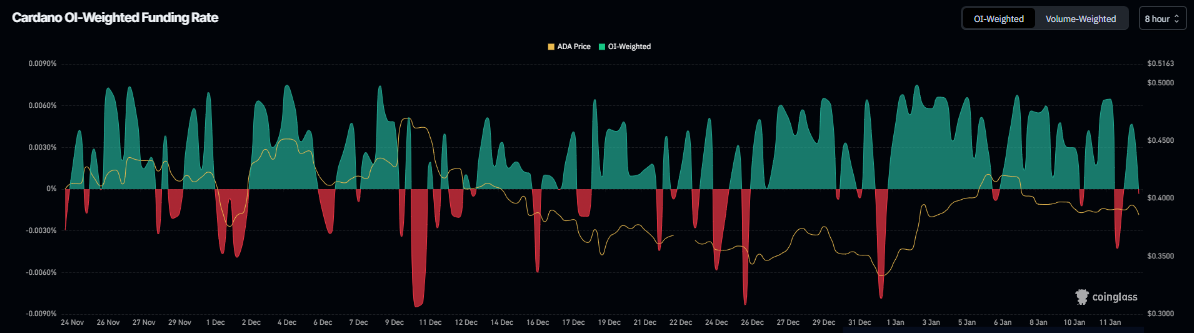
Moreover, Cardano’s funding rates have also turned negative on Tuesday, according to the Coinglass chart below. This negative rate indicates shorts are paying longs, suggesting bearish sentiment toward ADA.
Cardano Price Forecast: ADA nears key support at $0.38
Cardano price was rejected from the 50-day EMA at $0.41 on January 6 and declined nearly 9% through Monday, retesting the daily support level at $0.38. As of writing on Tuesday, ADA hovers around this daily support level.
If ADA closes below its daily support at $0.38 on a daily basis, it could extend the decline toward the December 31 low of $0.32.
The Relative Strength Index (RSI) on the daily chart is flattening around the neutral level of 50, indicating indecision among traders. Moreover, the Moving Average Convergence Divergence (MACD) lines are converging, further suggesting an indecisive view.
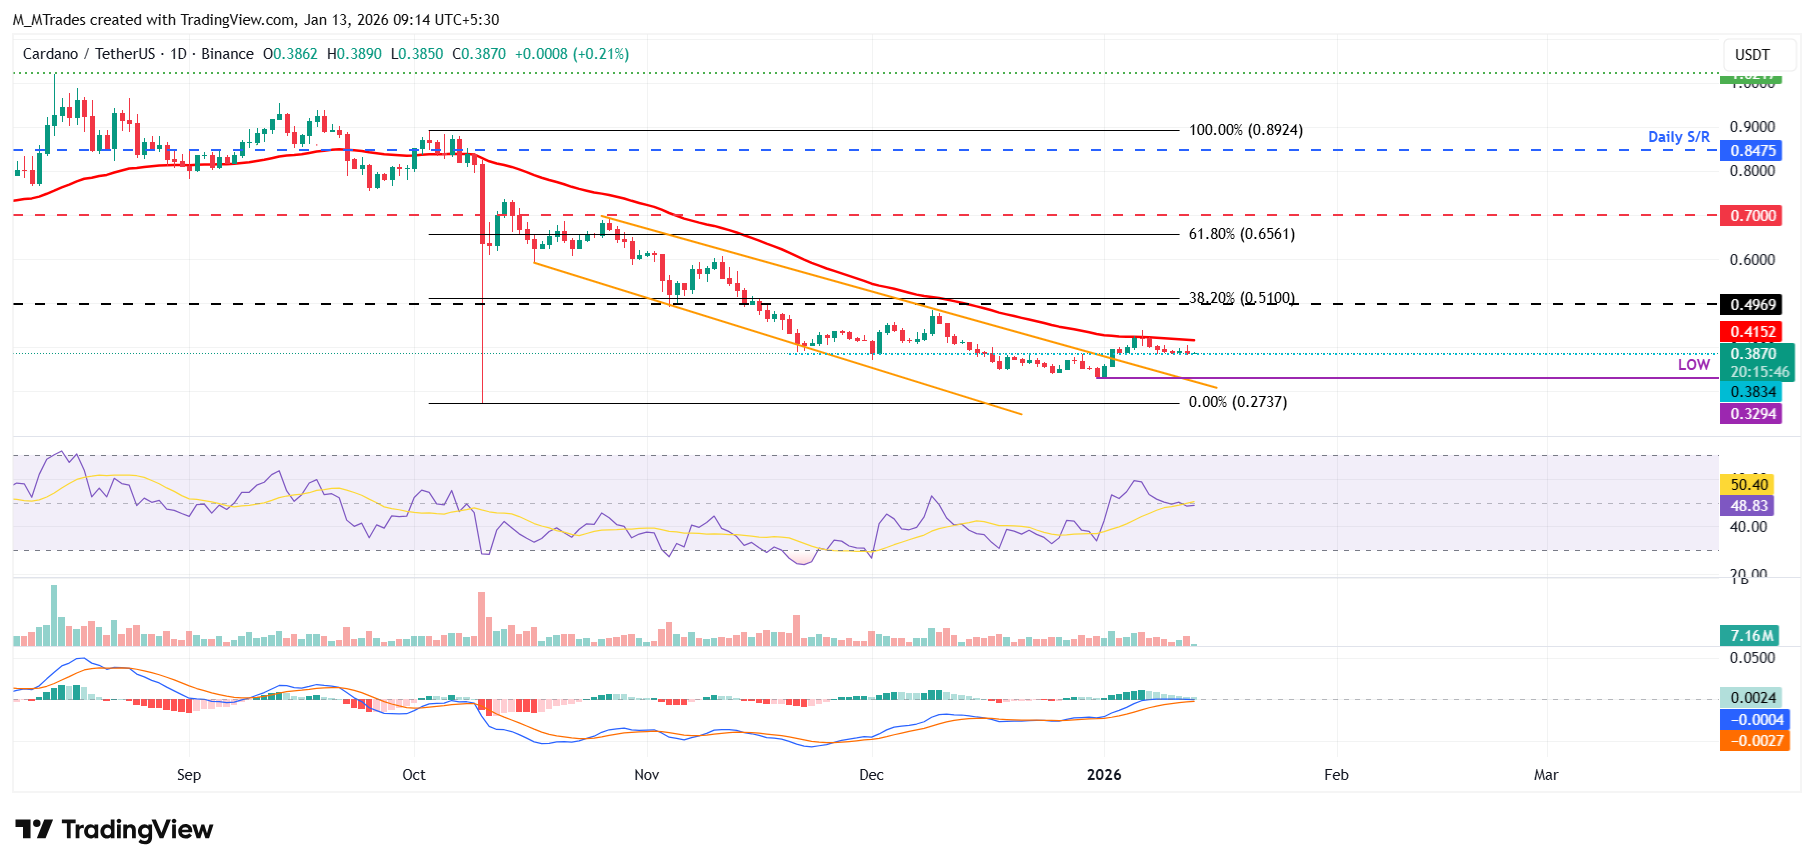
However, if the daily support at $0.38 holds, ADA could recover toward the 50-day EMA at $0.41.
Cryptocurrency metrics FAQs
The developer or creator of each cryptocurrency decides on the total number of tokens that can be minted or issued. Only a certain number of these assets can be minted by mining, staking or other mechanisms. This is defined by the algorithm of the underlying blockchain technology. On the other hand, circulating supply can also be decreased via actions such as burning tokens, or mistakenly sending assets to addresses of other incompatible blockchains.
Market capitalization is the result of multiplying the circulating supply of a certain asset by the asset’s current market value.
Trading volume refers to the total number of tokens for a specific asset that has been transacted or exchanged between buyers and sellers within set trading hours, for example, 24 hours. It is used to gauge market sentiment, this metric combines all volumes on centralized exchanges and decentralized exchanges. Increasing trading volume often denotes the demand for a certain asset as more people are buying and selling the cryptocurrency.
Funding rates are a concept designed to encourage traders to take positions and ensure perpetual contract prices match spot markets. It defines a mechanism by exchanges to ensure that future prices and index prices periodic payments regularly converge. When the funding rate is positive, the price of the perpetual contract is higher than the mark price. This means traders who are bullish and have opened long positions pay traders who are in short positions. On the other hand, a negative funding rate means perpetual prices are below the mark price, and hence traders with short positions pay traders who have opened long positions.

Acuity Trading
Acuity Trading 是一家成立於 2013 年、總部位於倫敦的金融科技公司,專注於 AI 驅動的另類數據與情緒分析,用於交易與投資。他們以可視化新聞與情緒工具革新線上交易體驗,並持續以最新 AI 研究與技術提供可產生阿爾法的另類數據與高度互動的交易工具。
Read More


