
Trade The World
Crypto Today: Bitcoin, Ethereum, XRP pause uptrend amid potential profit-taking
作者 John Isige
發布日期: 15 Sep 2025 | 修改日期: 15 Sep 2025


POPULAR ARTICLES

Bitcoin (BTC) pauses last week's steady uptrend, declining below $115,000 on Monday. The pullback in the price of BTC is sending subtle shockwaves across the cryptocurrency market, with Ethereum (ETH) and Ripple (XRP) front-running the correction in altcoins.
- Bitcoin breaks below $115,000, buoyed by steady ETF inflows and growing optimism ahead of the Fed's interest rate decision.
- Ethereum shows short-term weakness, sliding below $4,600 amid potential profit-taking.
- XRP pulls back to test a descending trendline support, reflecting growing volatility in the broader crypto market.
Bitcoin (BTC) pauses last week's steady uptrend, declining below $115,000 on Monday. The pullback in the price of BTC is sending subtle shockwaves across the cryptocurrency market, with Ethereum (ETH) and Ripple (XRP) front-running the correction in altcoins.
Data spotlight: Bitcoin regains institutional interest
Institutional interest in Bitcoin (BTC) has stabilized over the past week, with spot Exchange Traded Funds (ETFs) in the United States (US) experiencing steady inflows. According to SoSoValue data, BTC ETFs saw $2.34 billion in inflows last week, bringing the cumulative total inflow volume to $56.83 billion. Total net assets currently average at approximately $153 billion.
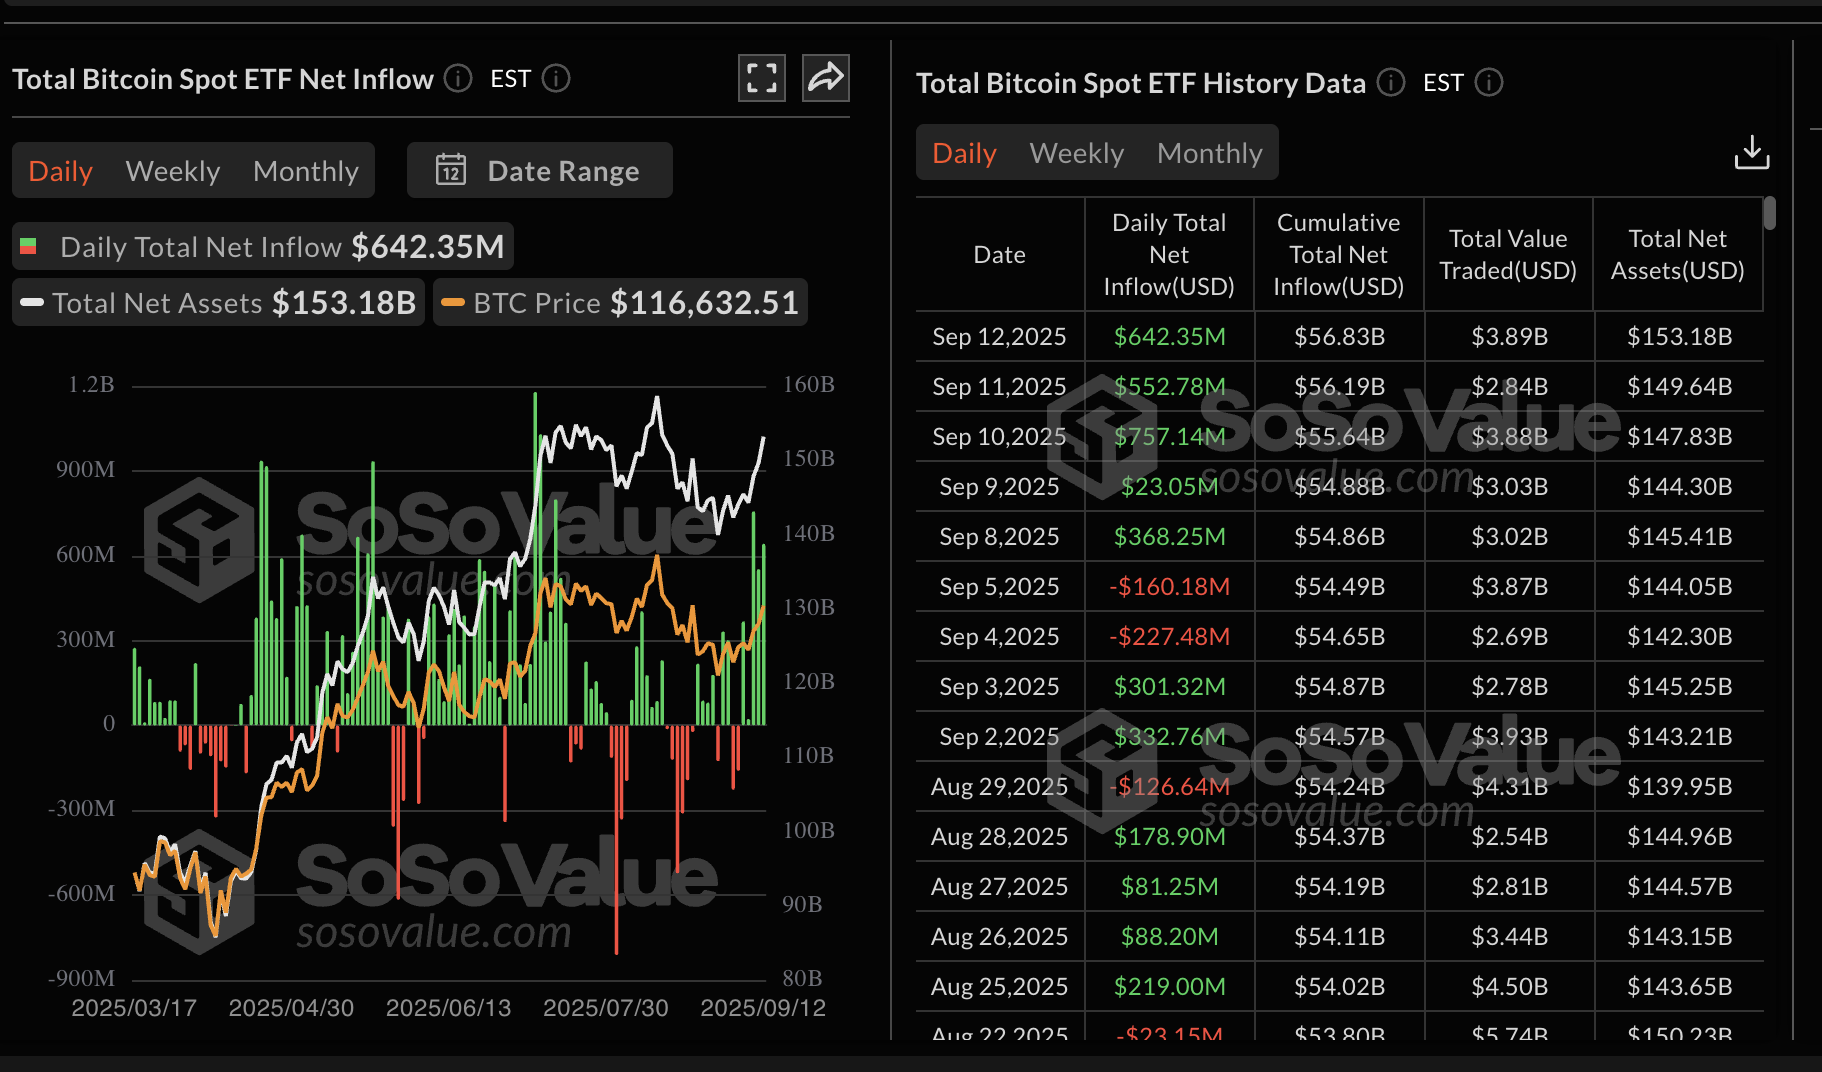
Bitcoin spot ETFs stats | Source: SoSoValue
As for Ethereum, spot ETFs in the US gained momentum last week, with approximately $638 million flowing in, as shown in the chart below. Ethereum ETFs boast a cumulative total net inflow volume of slightly above $13 billion and total net assets of $30 billion.
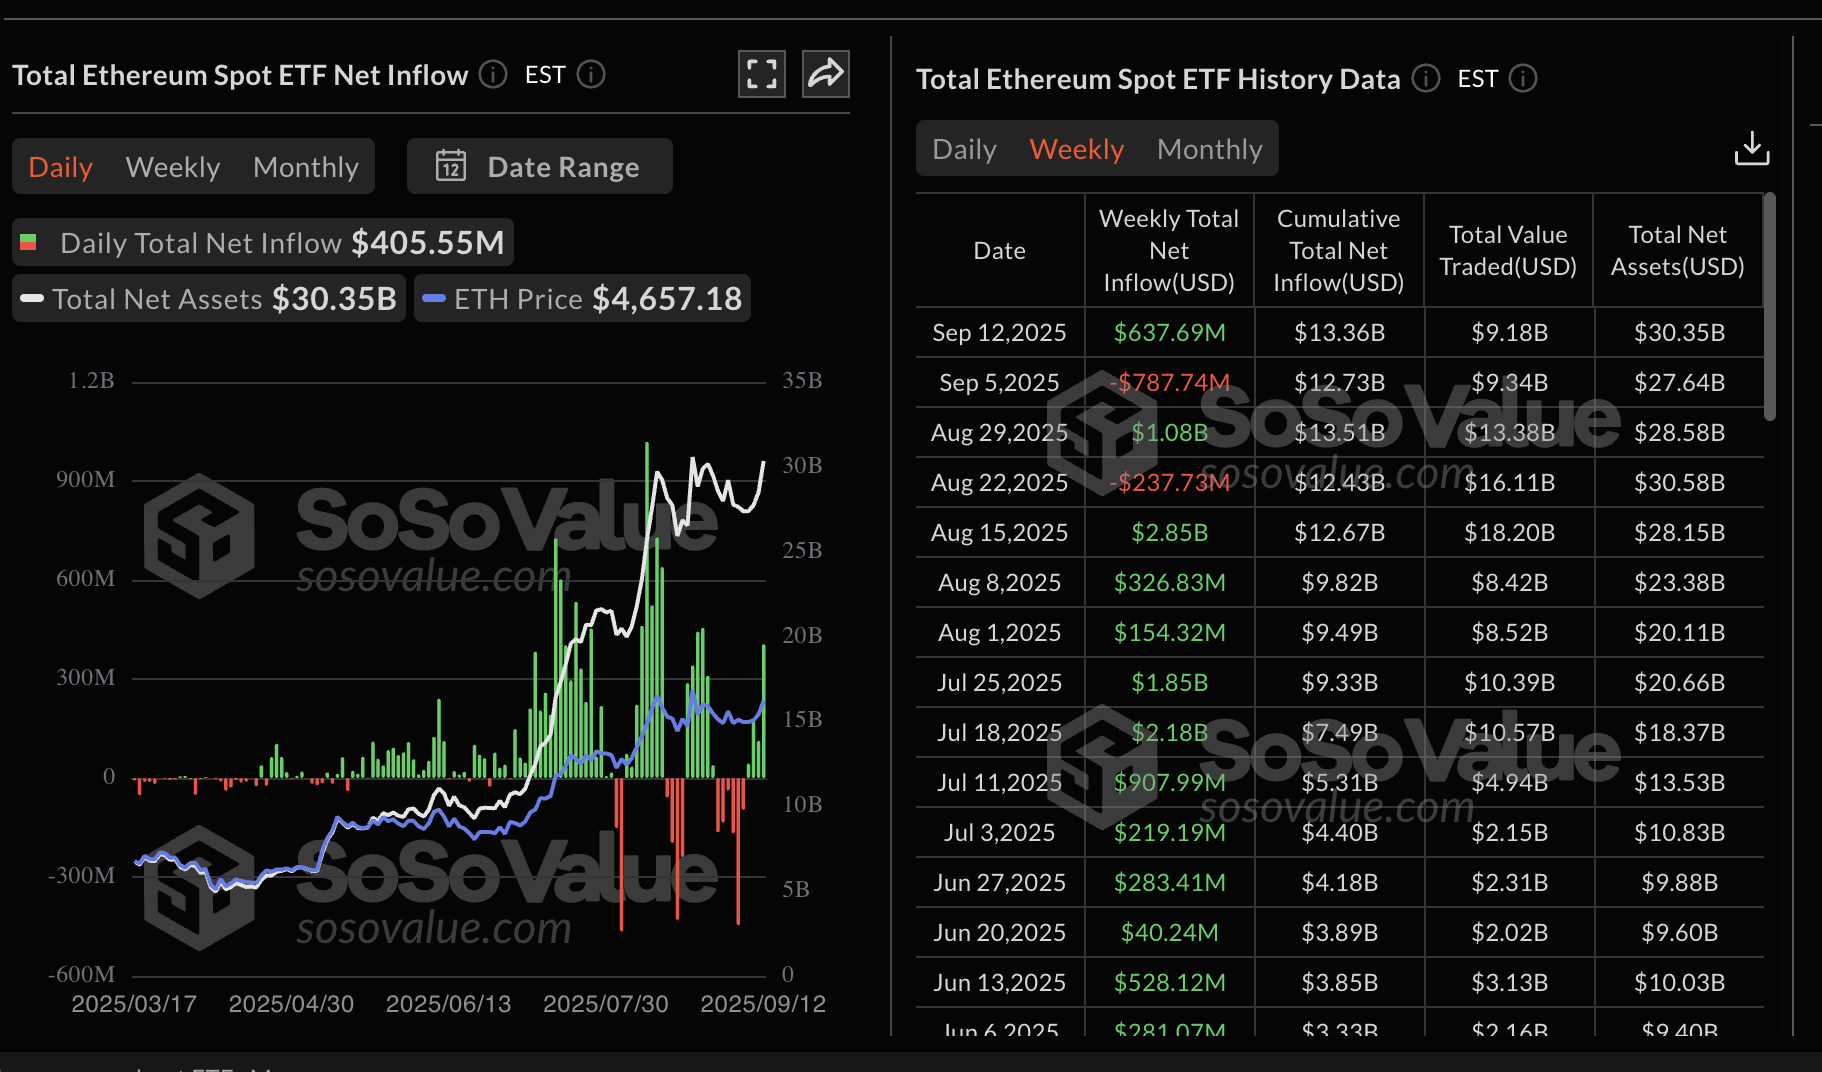
Ethereum spot ETFs stats | Source: SoSoValue
As for XRP, retail demand for the token remains relatively high with the futures Open Interest (OI) averaging $8.7 billion on Monday. Due to the ongoing correction and traders' repositioning, the OI, which refers to the notional value of outstanding futures contracts, is down slightly from $8.95 billion recorded on Sunday.
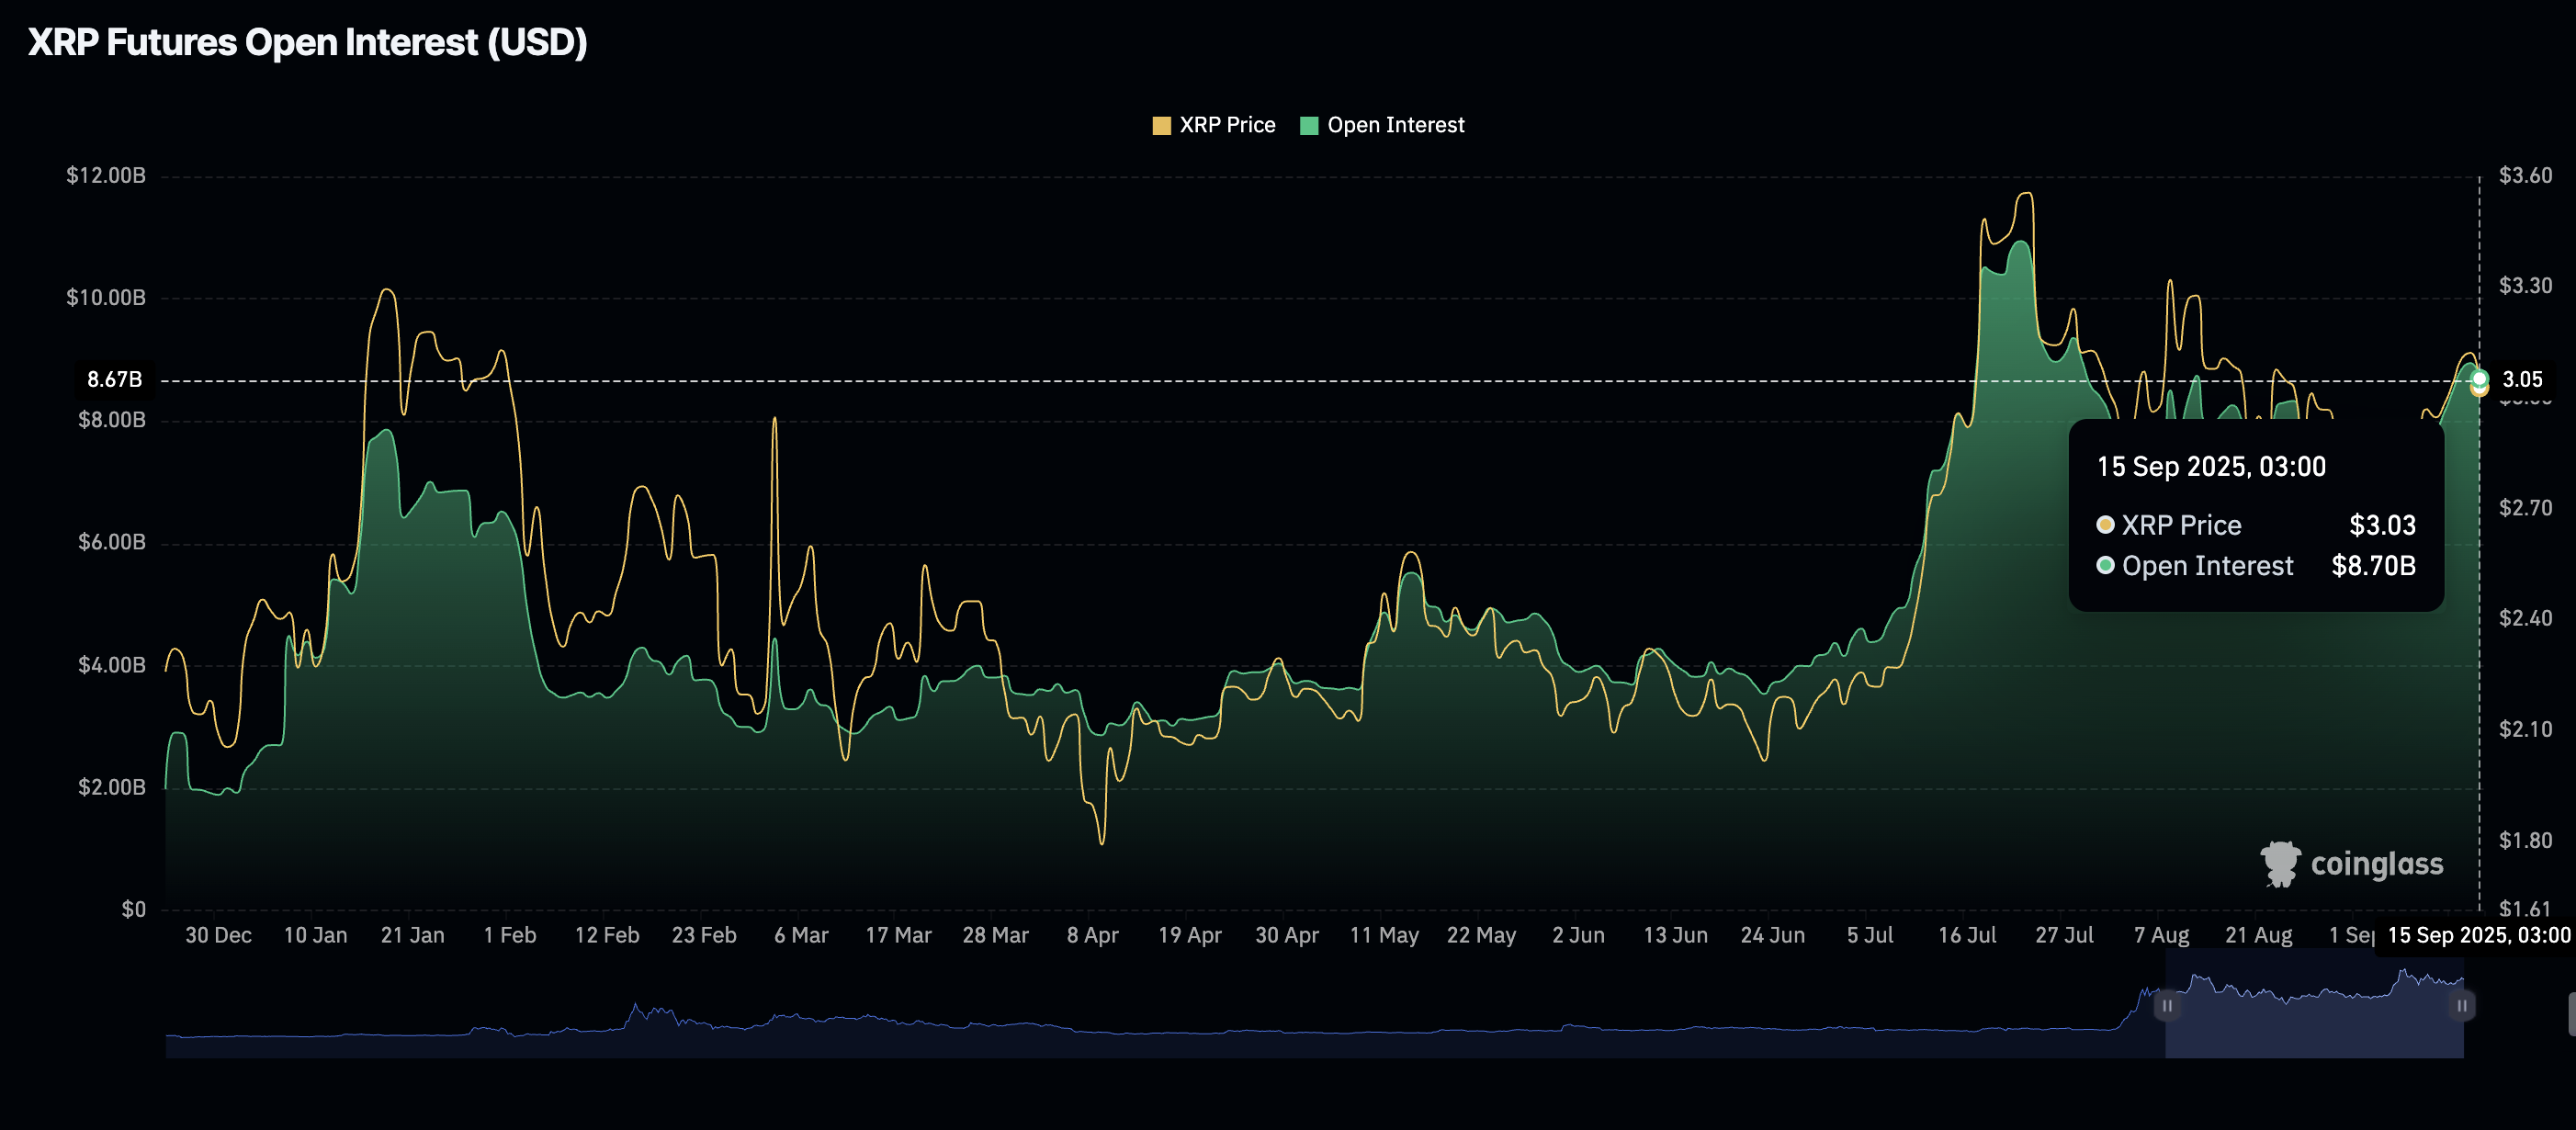
XRP Futures Open Interest | Source: CoinGlass
Following the significant gains of Bitcoin, Ethereum, and XRP last week, traders appear to be taking profits and repositioning themselves ahead of the highly anticipated US Federal Reserve (Fed) interest rate decision. The Federal Open Market Committee (FOMC) meeting on Wednesday is expected to cut interest rates – a move that would match general market expectations.
There is a 94.2% chance that the Fed will cut rates by a 0.25 percentage point to a range of 4.00% to 4.25%, according to CME Group's FedWatch tool. The rest of the market expects a 0.50 percentage point cut. Currently, interest rates in the US range between 4.25% and 4.50%.
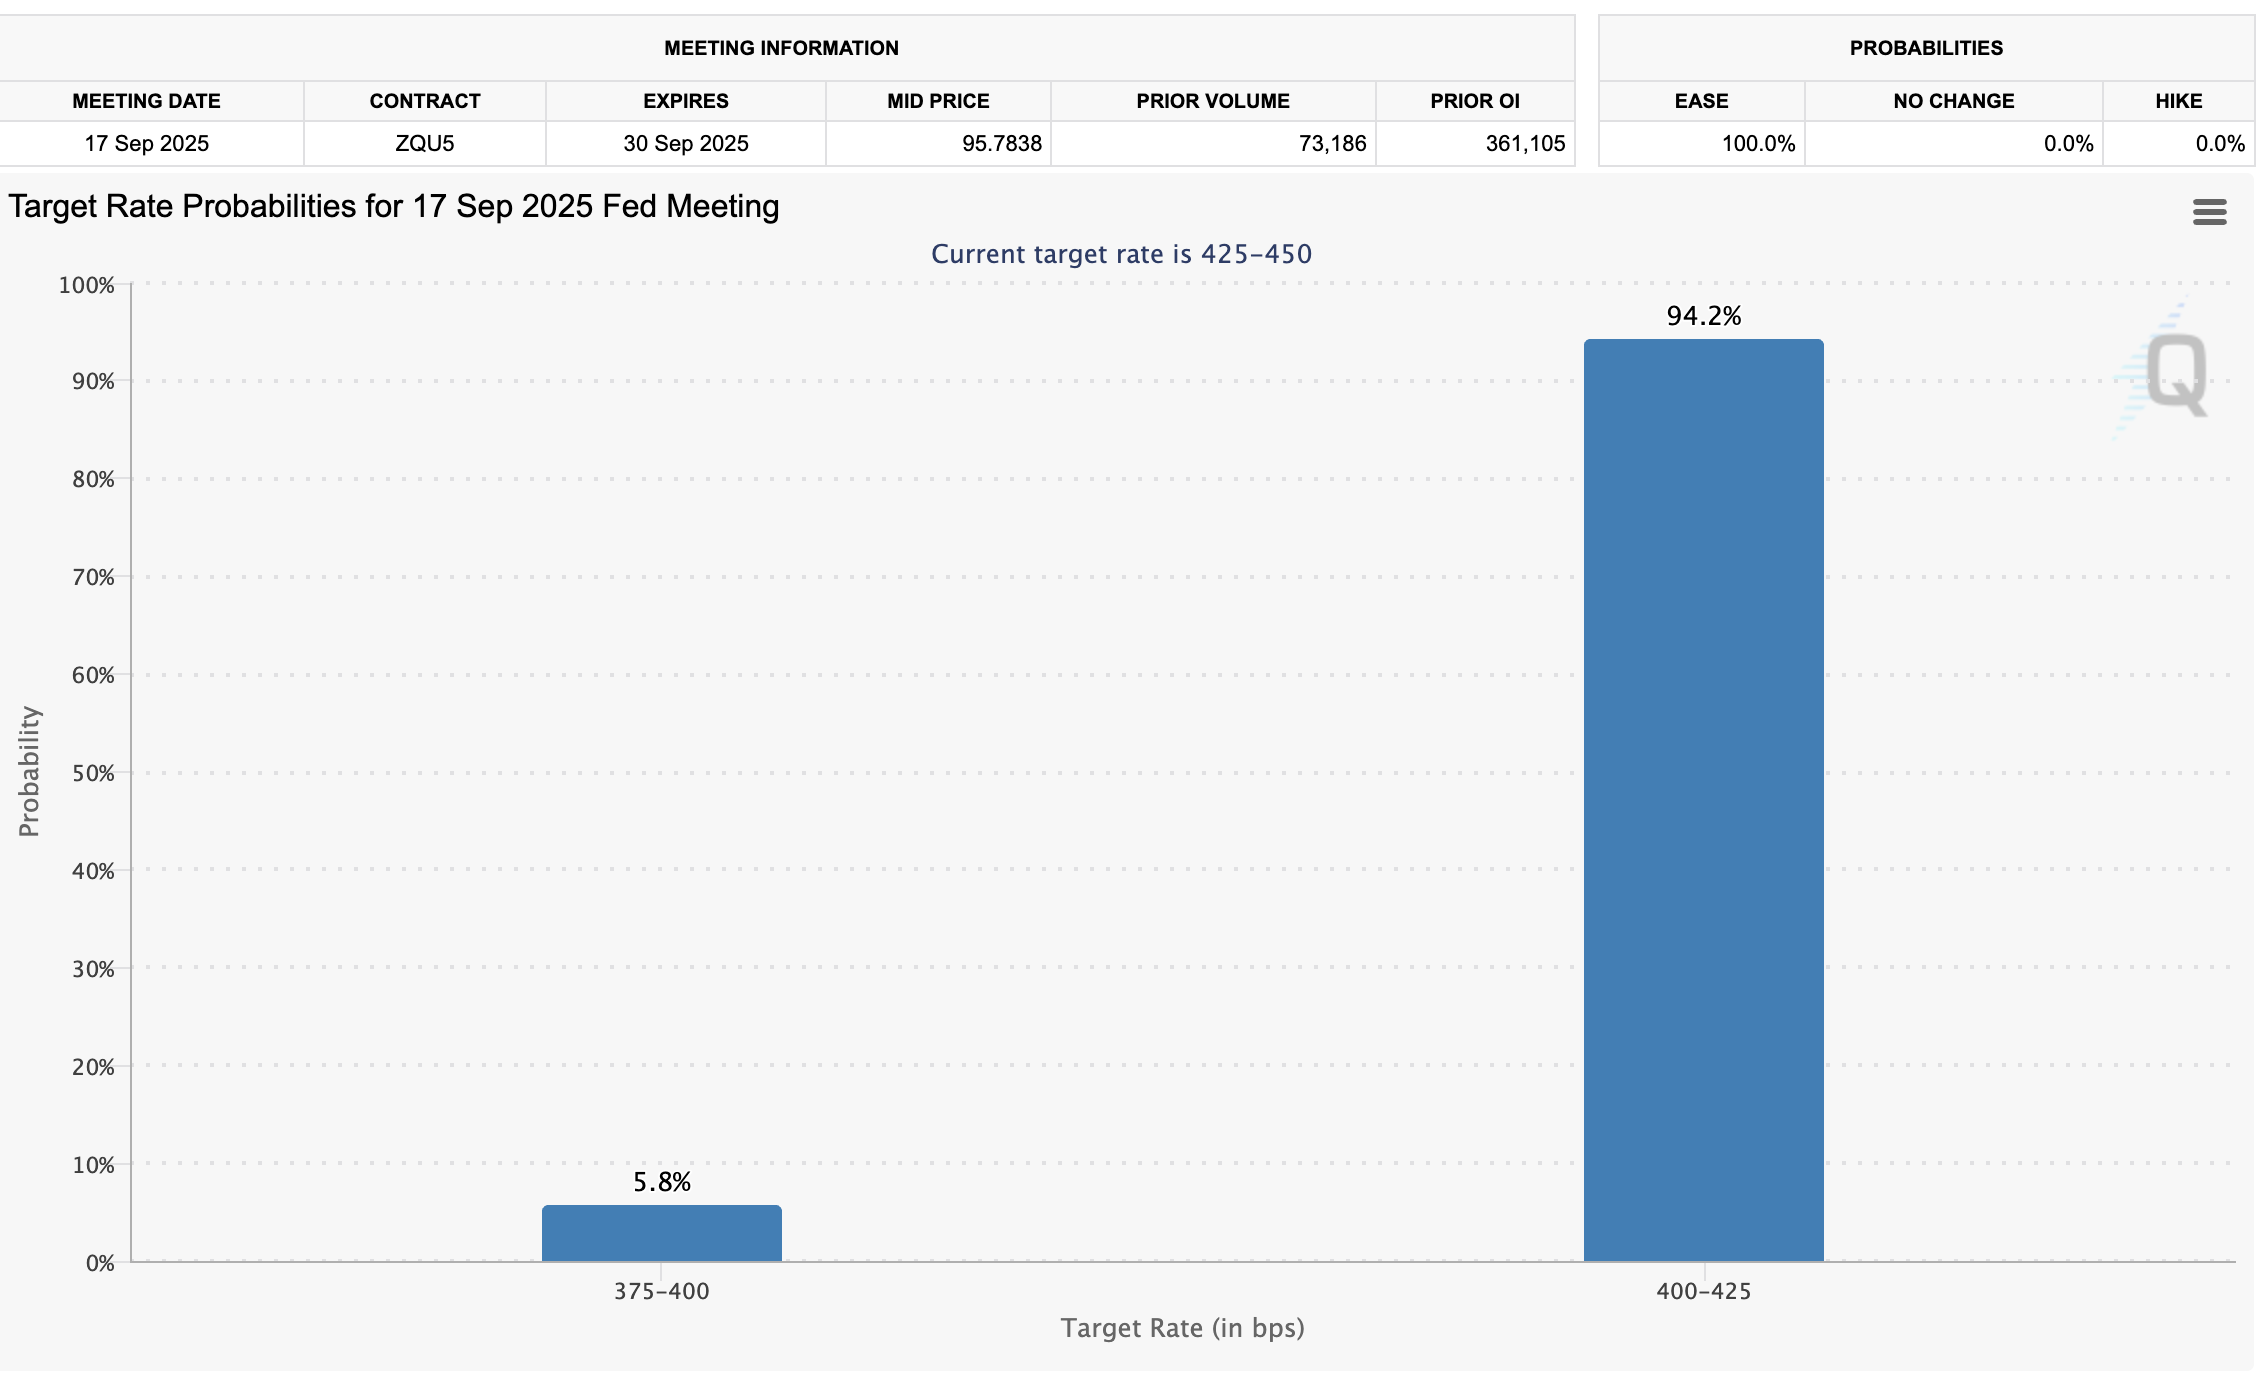
FedWatch tool | Source: CME Group
Lower interest rates are expected to increase interest in riskier assets, such as equities and cryptocurrencies. Therefore, a rate cut could launch the crypto market into a bullish fourth quarter.
Chart of the day: Bitcoin trims gains as volatility spikes
Bitcoin price holds below $115,000 at the time of writing on Monday, marking a cooldown from last week's steady uptrend above the $116,000 level. Short-term technical analysis suggests that choppy market conditions will continue ahead of the Fed interest rate decision.
The Relative Strength Index (RSI) declining to 55 on the daily chart highlights easing bullish momentum. However, an upturn toward overbought territory would confirm Bitcoin's bullish potential for a breakout above the $120,000 level.
At the same time, the Moving Average Convergence Divergence (MACD) indicator suggests that bulls still have the upper hand. With the blue MACD line remaining above the signal line, bullish momentum is likely to gain traction in the coming days.
Still, if profit-taking continues, triggering volatility, traders would look toward the 50-day Exponential Moving Average (EMA) at $113,399 and the 100-day EMA at $111,281 for potential support.
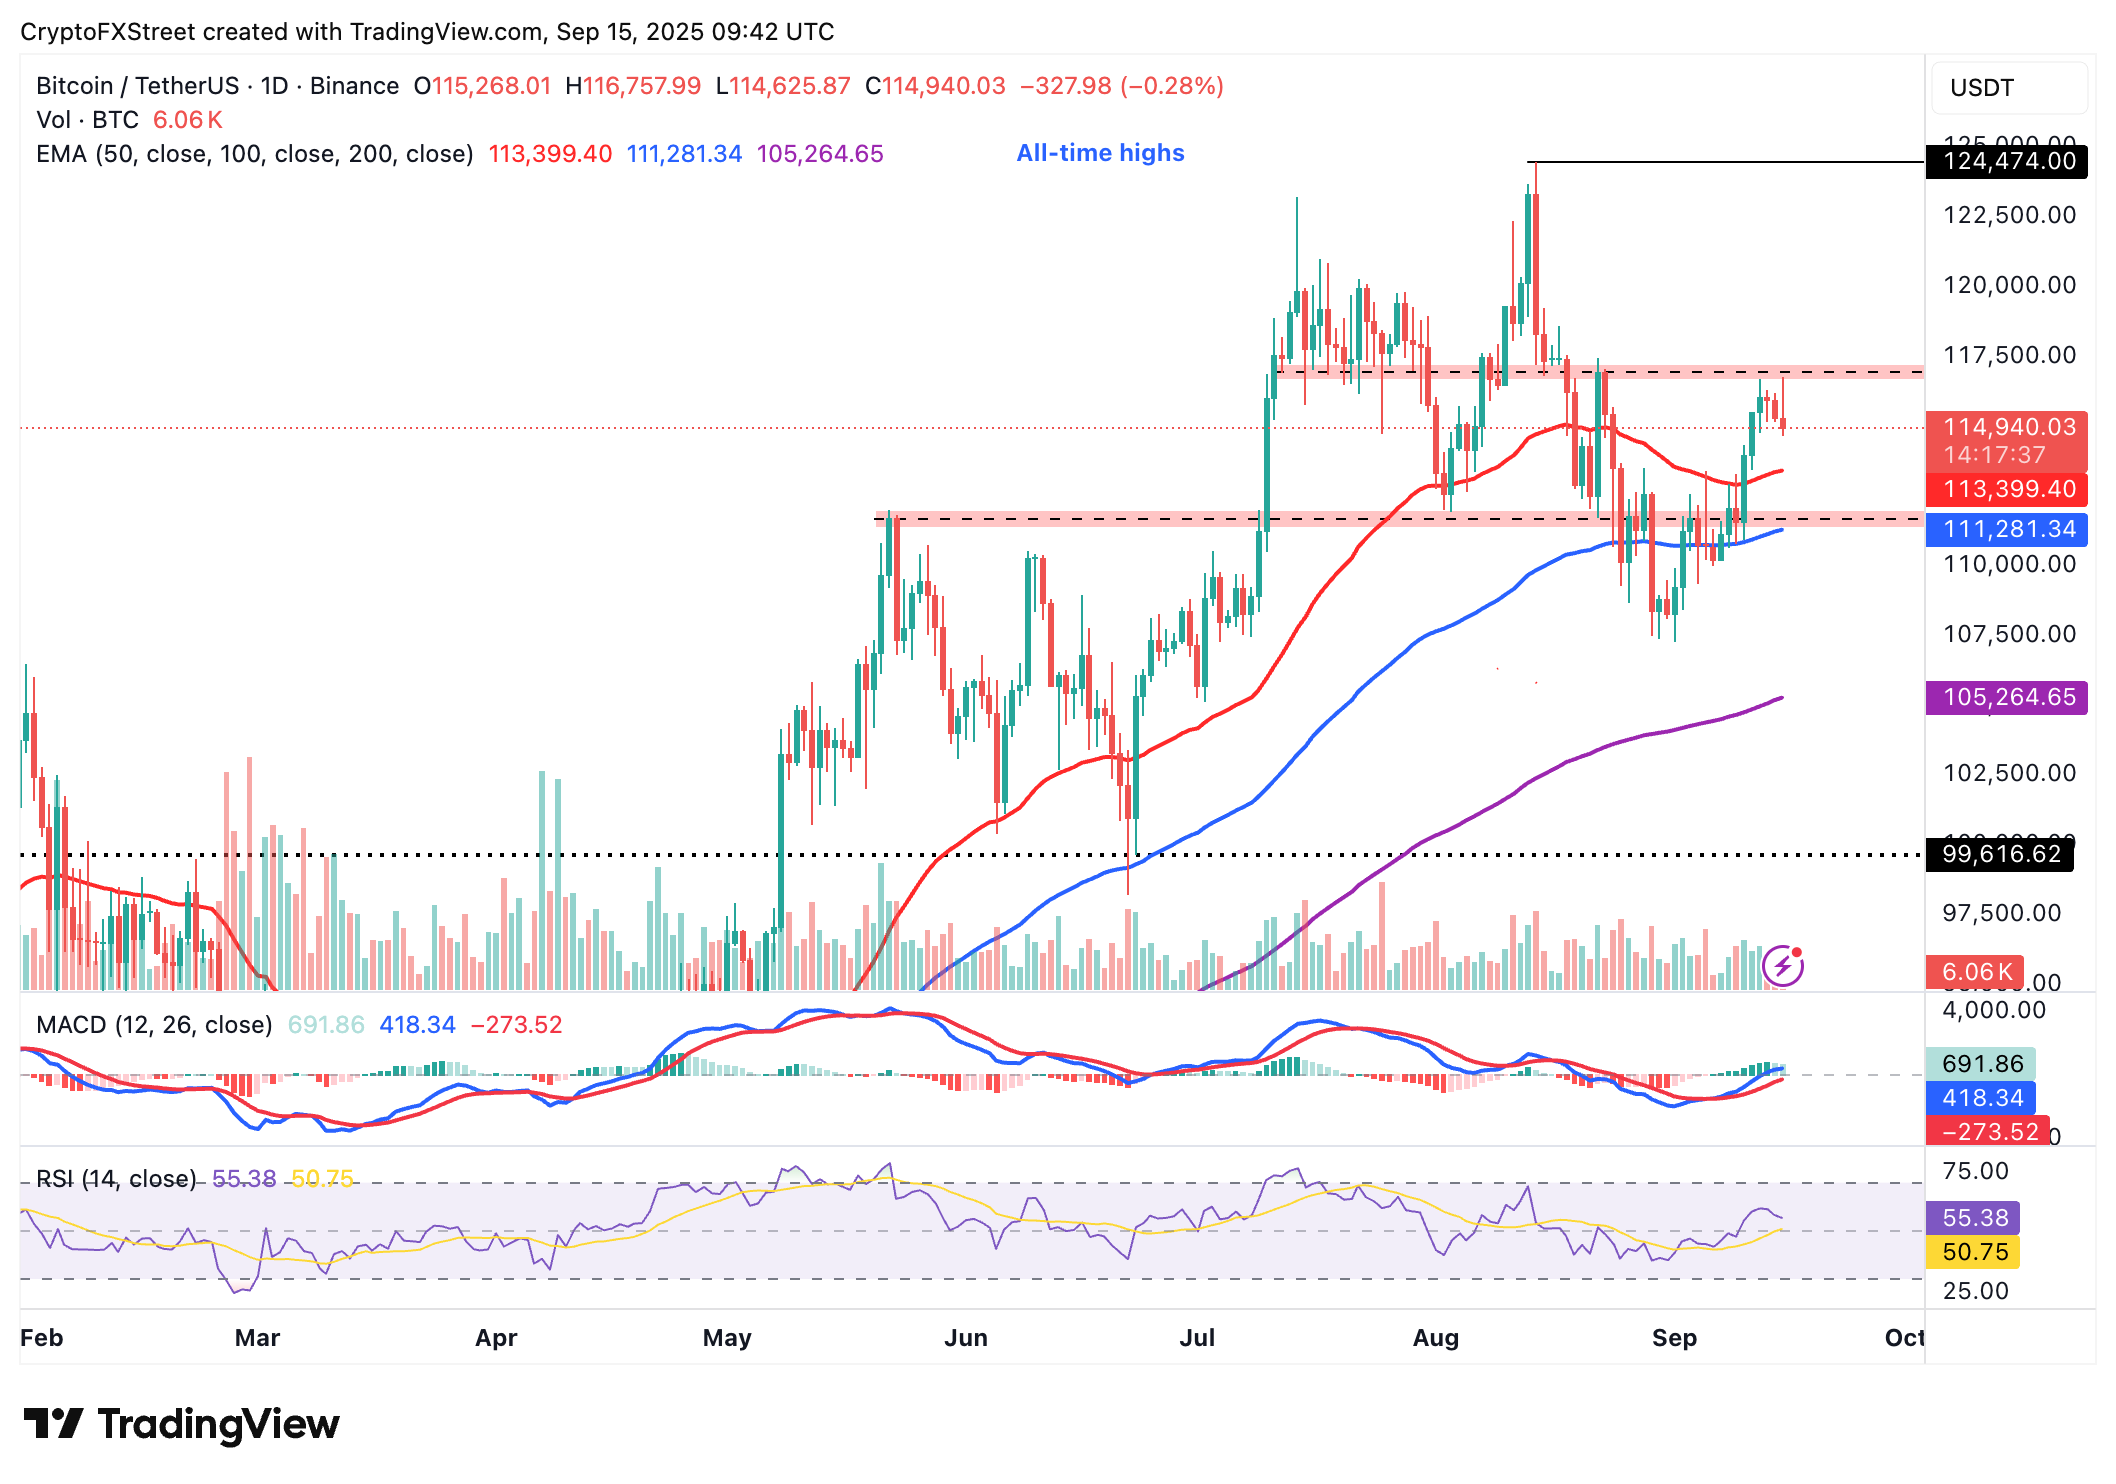
BTC/USDT daily chart
Altcoins update: Ethereum, XRP ease gains
Ethereum holds slightly above $4,500 amid a spike in volatility in the broader cryptocurrency market on Monday. The Relative Strength Index (RSI) at 55 backs the pullback as it declines toward the midline.
Despite the short-term bearish outlook, traders should temper their bearish expectations, considering the MACD indicator maintains a bullish outlook with the blue line above the red signal line. If the situation worsens and supply outstrips demand, it would be prudent to shift focus to the 50-day EMA at $4,187 as the next tentative support level.
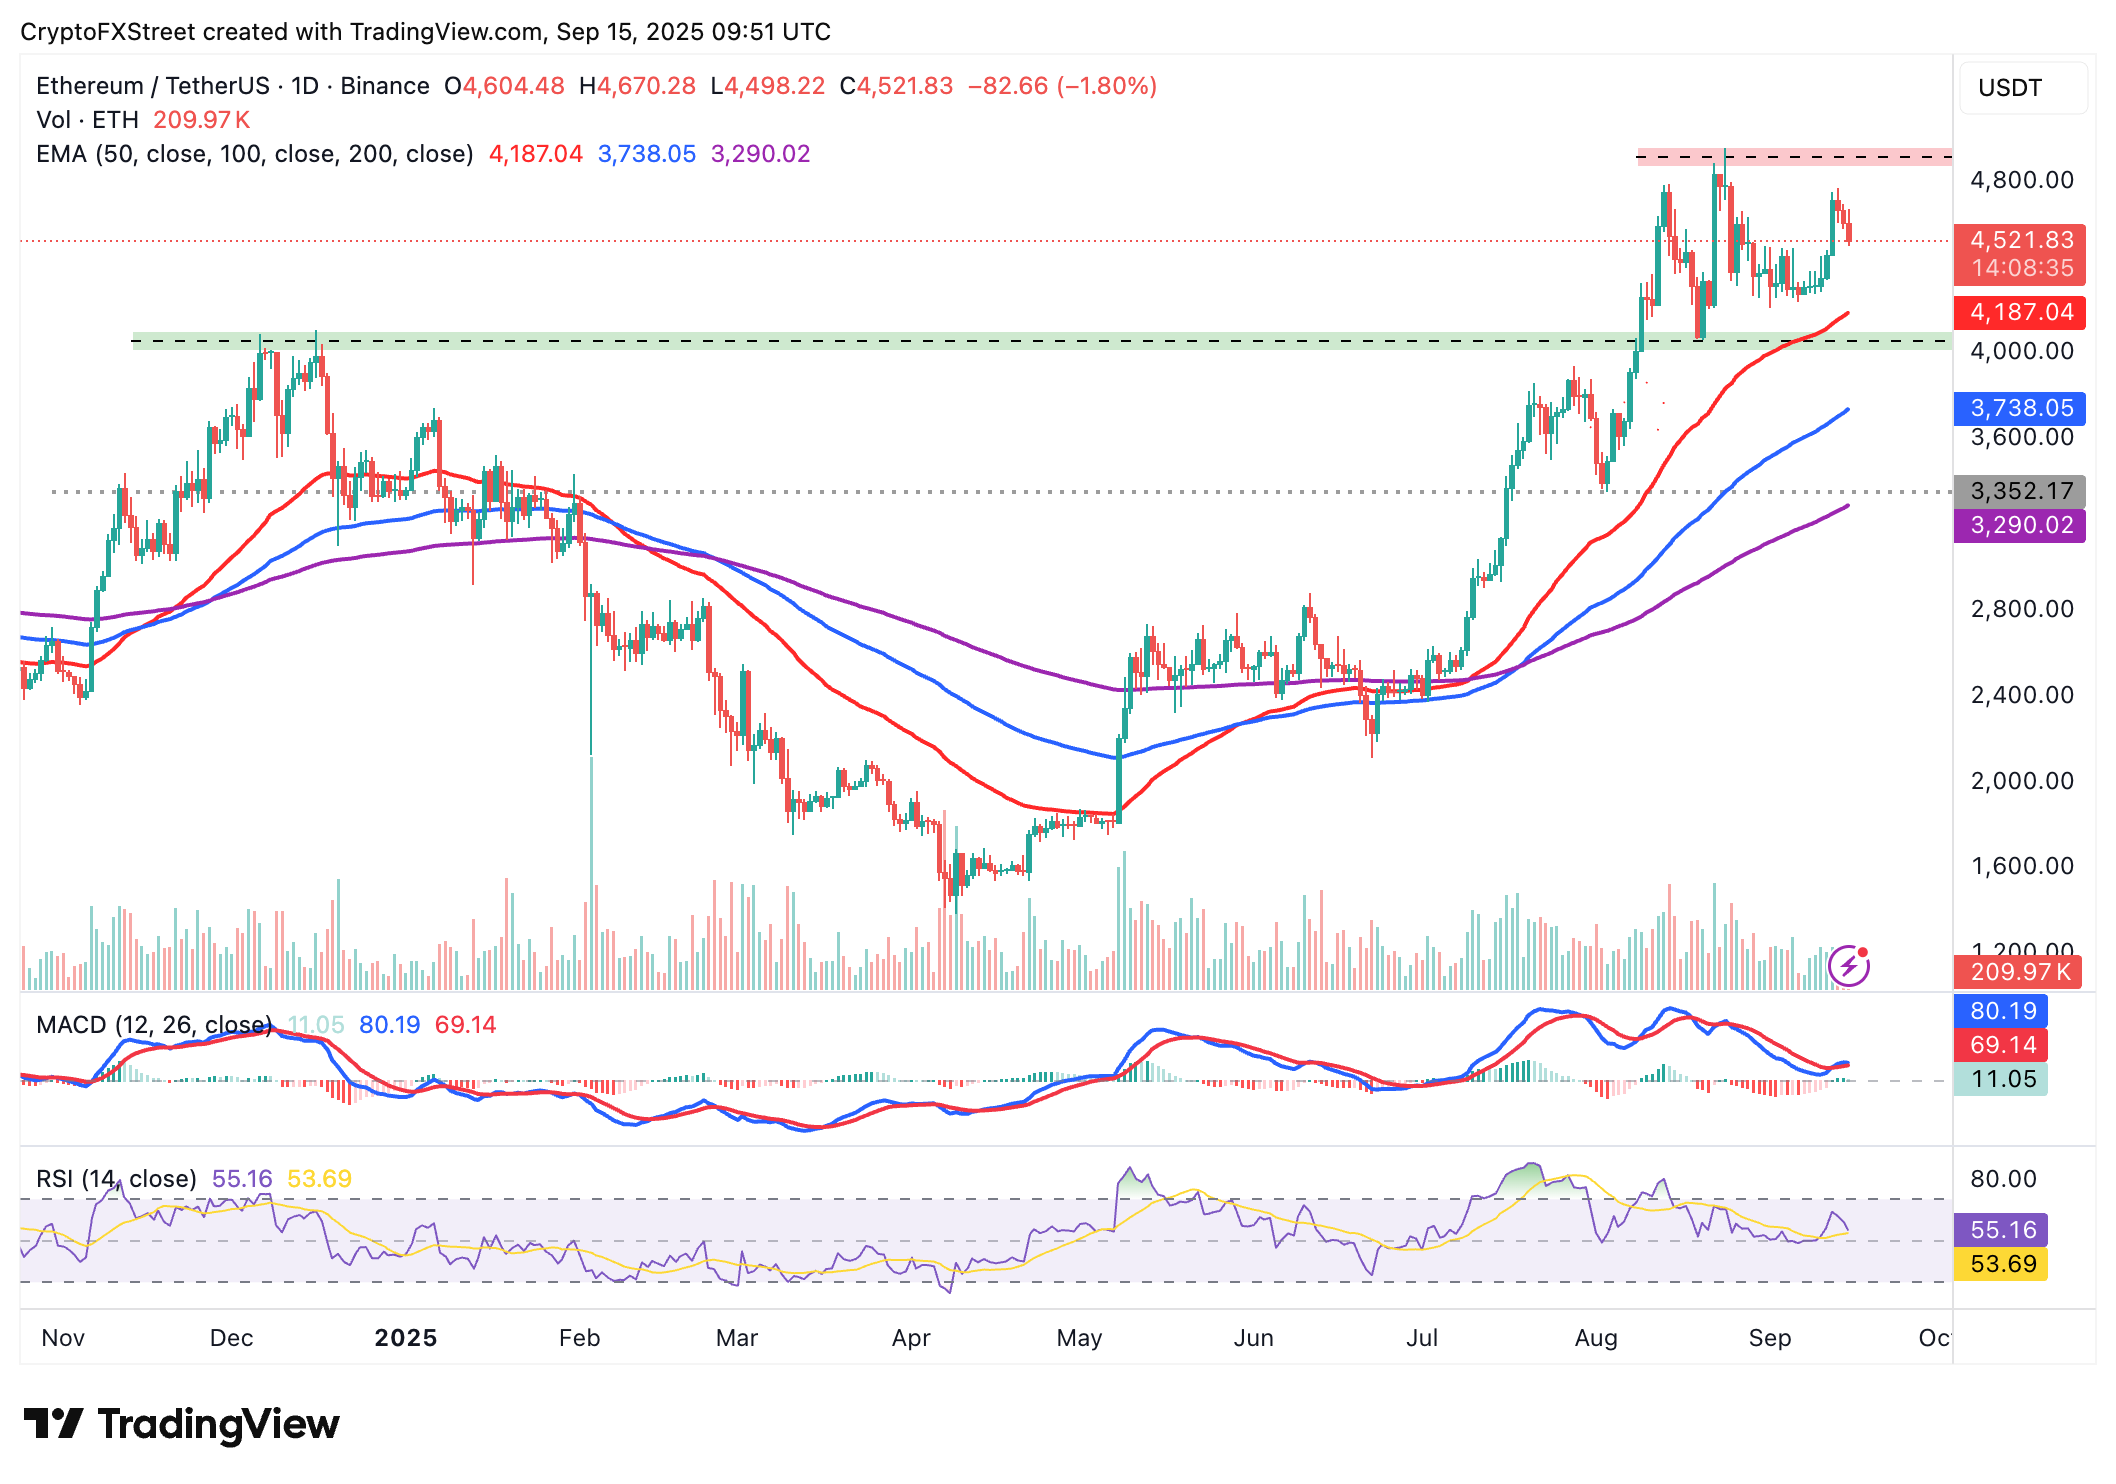
ETH/USDT daily chart
As for XRP, the current correction from last week's peak of $3.18 is testing a key descending trendline that has become support. The decline in the RSI, which is holding at 50 after peaking at 60 on Saturday, shows a reduction in bullish momentum.
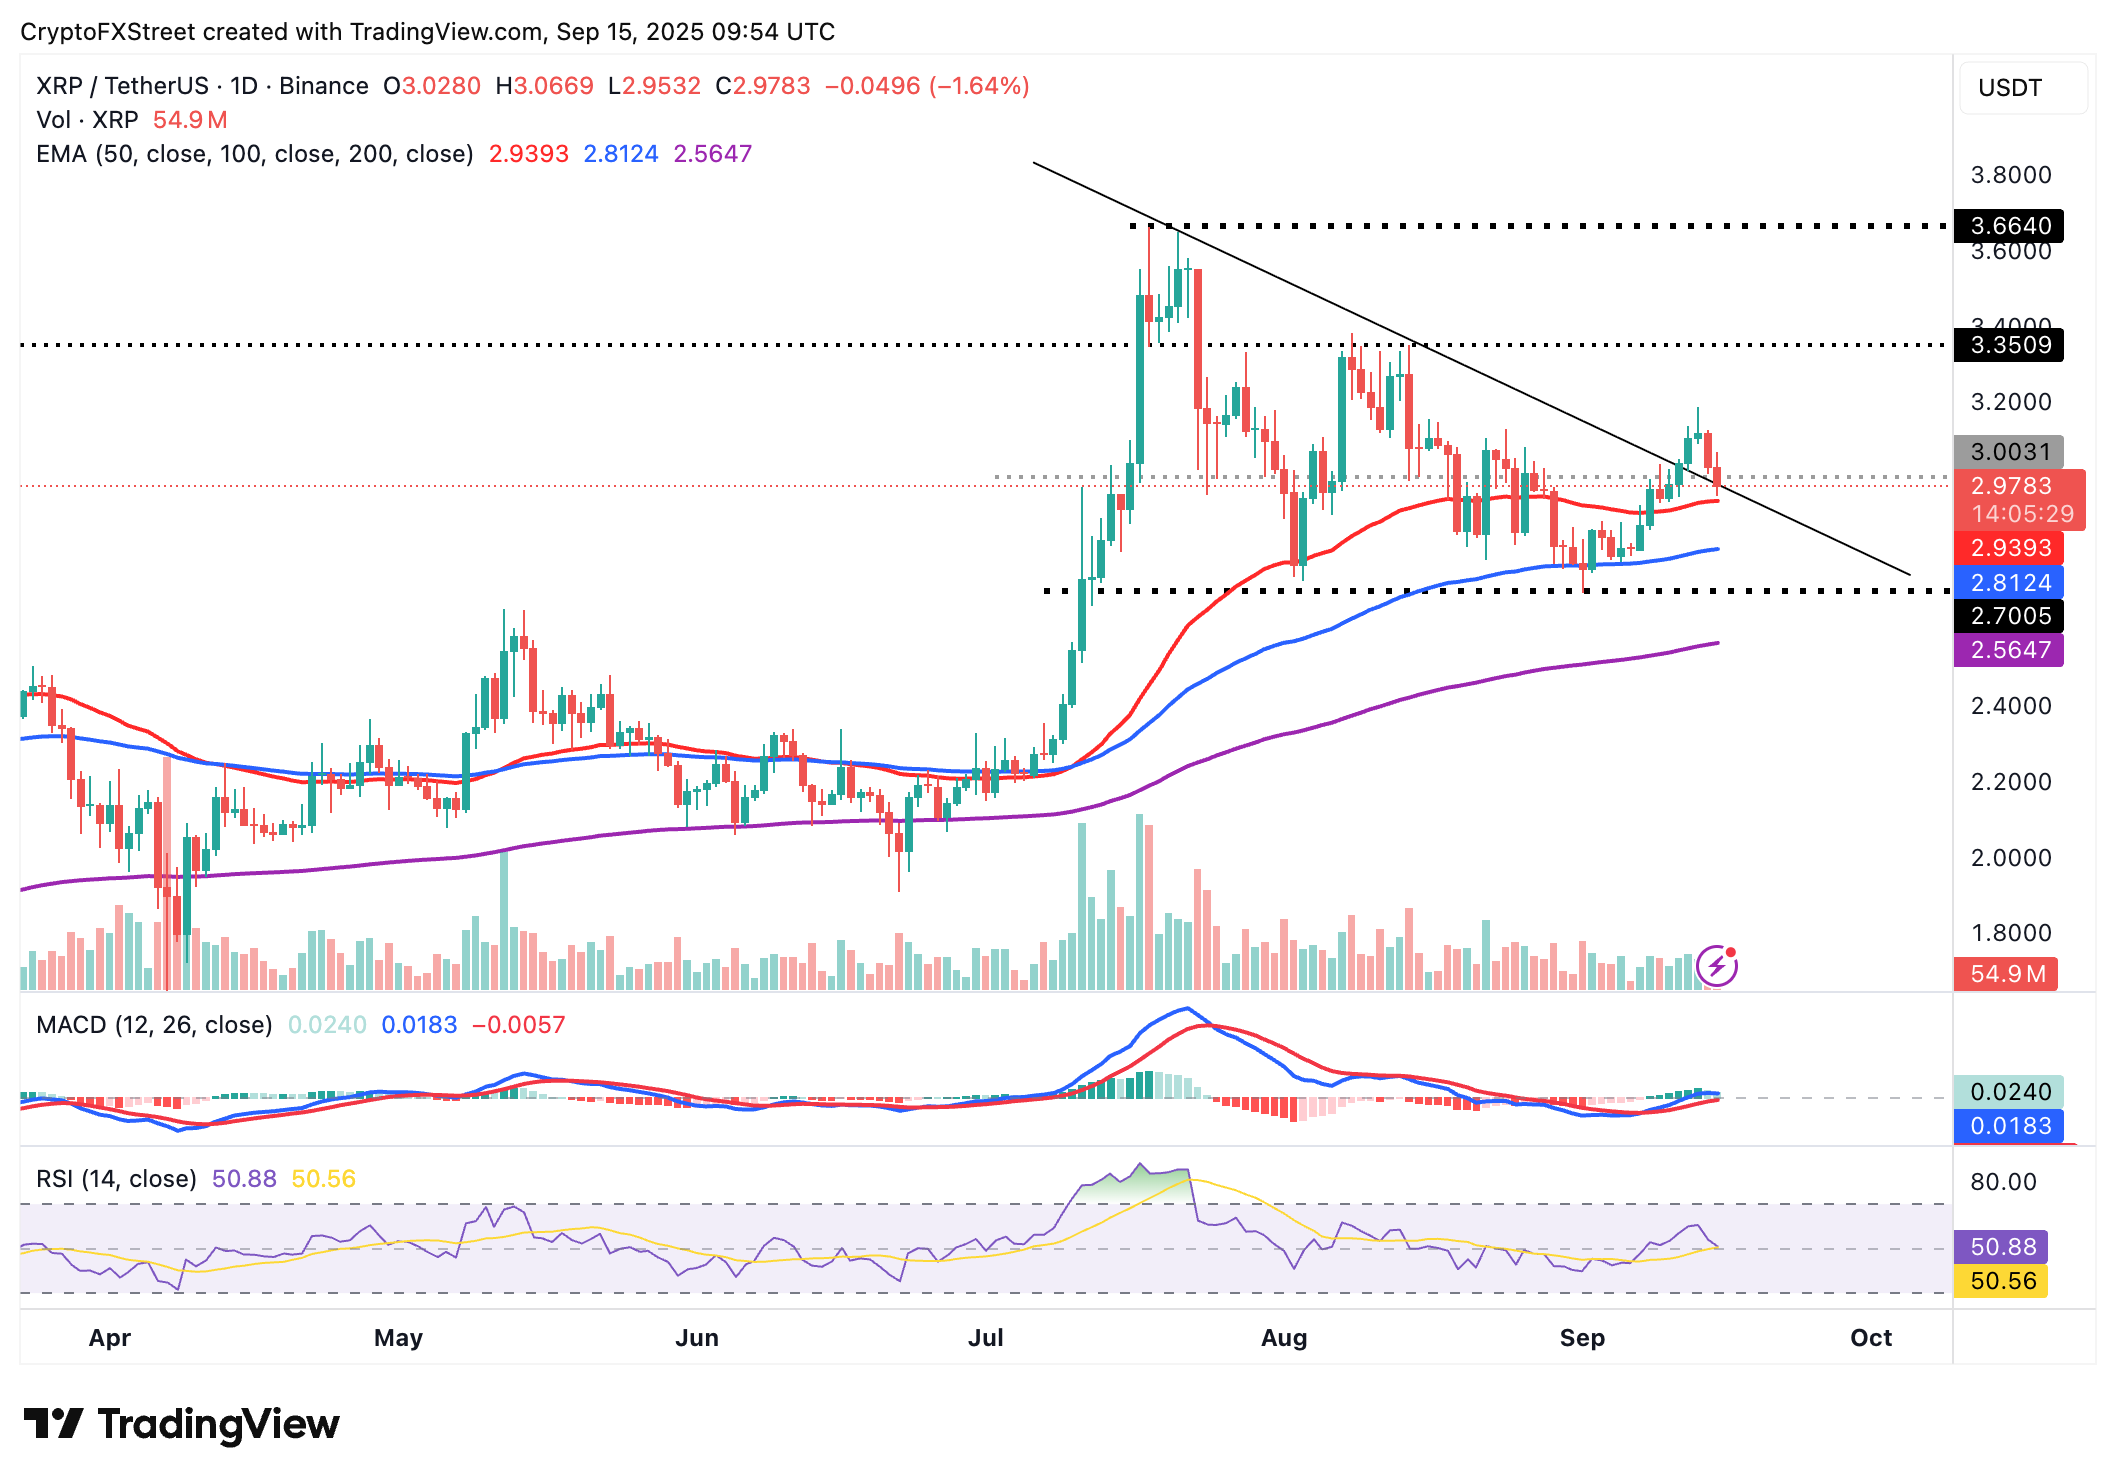
XRP/USDT daily chart
If the decline extends further below the midline, the path of least resistance could remain downward, increasing the chances of the XRP price trading below the 50-day EMA at $2.93. The 100-day EMA at $2.81 and the 200-day EMA at $2.56 are positioned to absorb the potential selling pressure in case investors aggressively reduce their exposure.
Cryptocurrency metrics FAQs
The developer or creator of each cryptocurrency decides on the total number of tokens that can be minted or issued. Only a certain number of these assets can be minted by mining, staking or other mechanisms. This is defined by the algorithm of the underlying blockchain technology. On the other hand, circulating supply can also be decreased via actions such as burning tokens, or mistakenly sending assets to addresses of other incompatible blockchains.
Market capitalization is the result of multiplying the circulating supply of a certain asset by the asset’s current market value.
Trading volume refers to the total number of tokens for a specific asset that has been transacted or exchanged between buyers and sellers within set trading hours, for example, 24 hours. It is used to gauge market sentiment, this metric combines all volumes on centralized exchanges and decentralized exchanges. Increasing trading volume often denotes the demand for a certain asset as more people are buying and selling the cryptocurrency.
Funding rates are a concept designed to encourage traders to take positions and ensure perpetual contract prices match spot markets. It defines a mechanism by exchanges to ensure that future prices and index prices periodic payments regularly converge. When the funding rate is positive, the price of the perpetual contract is higher than the mark price. This means traders who are bullish and have opened long positions pay traders who are in short positions. On the other hand, a negative funding rate means perpetual prices are below the mark price, and hence traders with short positions pay traders who have opened long positions.

Acuity Trading
Acuity Trading 是一家成立於 2013 年、總部位於倫敦的金融科技公司,專注於 AI 驅動的另類數據與情緒分析,用於交易與投資。他們以可視化新聞與情緒工具革新線上交易體驗,並持續以最新 AI 研究與技術提供可產生阿爾法的另類數據與高度互動的交易工具。
Read More


