
Trade The World
GBP/JPY Price Forecast: Tumbles to weekly lows, eyes on 197.00
作者 Christian Borjon Valencia
發布日期: 2 Oct 2025 | 修改日期: 2 Oct 2025


POPULAR ARTICLES

The GBP/JPY registered three consecutive bearish days so far in the week and opens Thursday’s Asian session near the current weekly low of 197.92. At the time of writing, the cross-pair trades at 198.19, virtually unchanged.
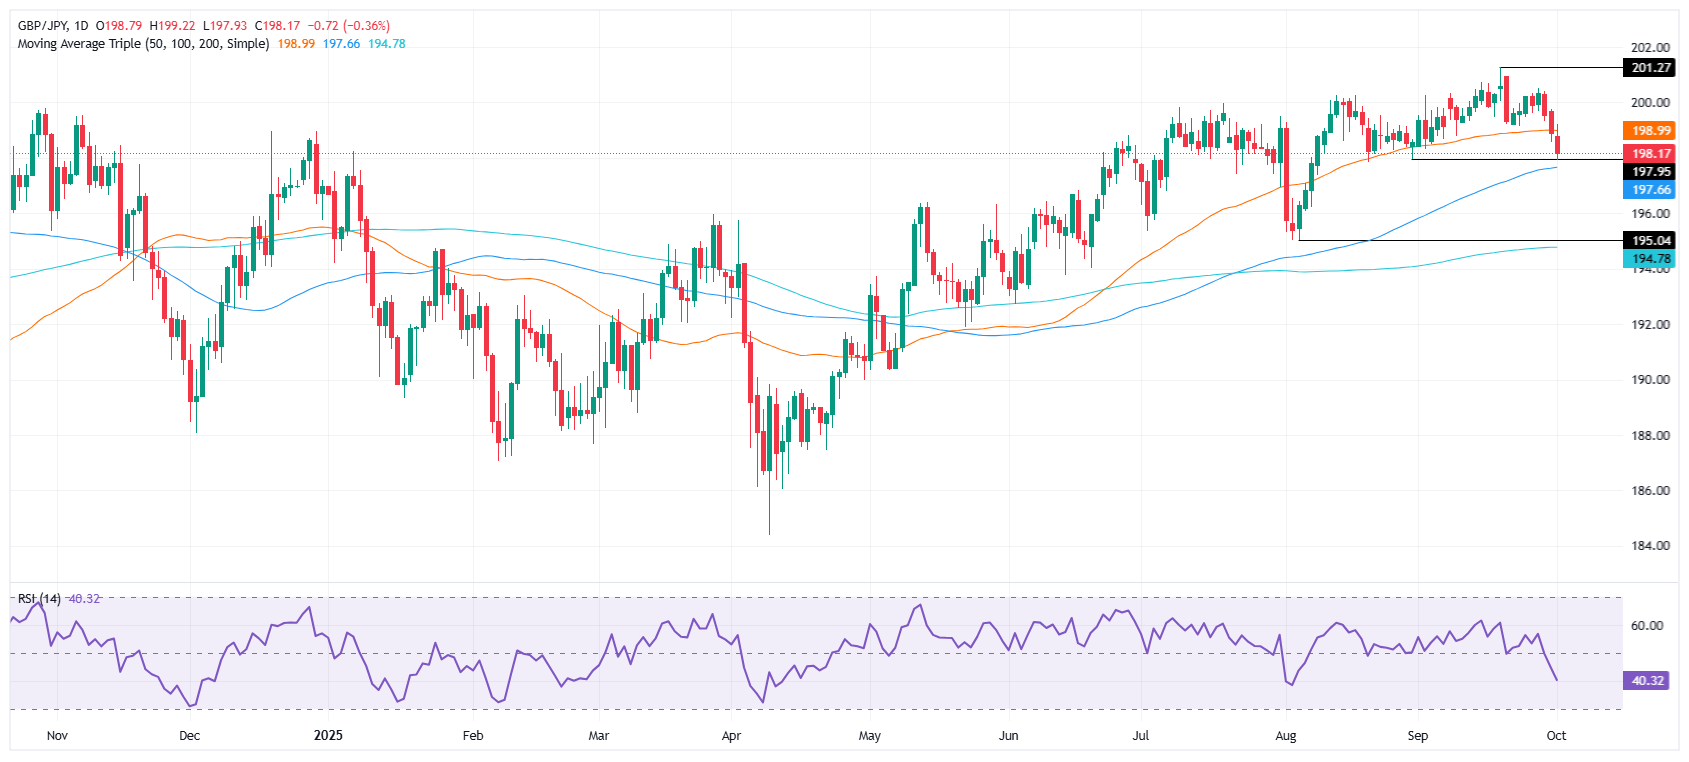
- GBP/JPY hovers just above August swing low at 197.86, a key level for bearish continuation toward 197.76, the 100-day SMA.
- Break below 197.70 could trigger deeper slide toward 197.00 and 196.00, before the 200-day SMA at 194.80.
- Buyers need recovery above 198.98 and 199.65 SMAs to regain control and attempt a move back toward 200.00.
The GBP/JPY registered three consecutive bearish days so far in the week and opens Thursday’s Asian session near the current weekly low of 197.92. At the time of writing, the cross-pair trades at 198.19, virtually unchanged.
GBP/JPY Price Forecast: Bears in charge target the 200-day SMA
The GBP/JPY technical picture indicates the pair is testing the last swing low of 197.86, August 20, which if broken it could open the door to challenge the 100-day Simple Moving Average (SMA) at 197.70, followed by the 200-day SMA at 194.80. Nevertheless, on its way south, the sellers must clear key support levels.
If the 100-day SMA is taken, the GBP/JPY next support would be 197.00, followed by the 196 mark ahead of the 200-day SMA.
Conversely, if buyers stepped in and drive the exchange rate above the 50-day SMA at 198.98, then a move above 199.00 is on the cards. On further strength, the next resistance would be the 20-day SMA at 199.65 ahead of the 200.00 figure.
GBP/JPY Price Chart – Daily
Pound Sterling Price This week
The table below shows the percentage change of British Pound (GBP) against listed major currencies this week. British Pound was the strongest against the Canadian Dollar.
| USD | EUR | GBP | JPY | CAD | AUD | NZD | CHF | |
|---|---|---|---|---|---|---|---|---|
| USD | -0.27% | -0.63% | -1.63% | 0.00% | -0.97% | -0.53% | -0.10% | |
| EUR | 0.27% | -0.36% | -1.52% | 0.27% | -0.70% | -0.27% | 0.16% | |
| GBP | 0.63% | 0.36% | -1.07% | 0.64% | -0.40% | 0.09% | 0.53% | |
| JPY | 1.63% | 1.52% | 1.07% | 1.71% | 0.73% | 1.00% | 1.62% | |
| CAD | -0.01% | -0.27% | -0.64% | -1.71% | -0.93% | -0.54% | -0.12% | |
| AUD | 0.97% | 0.70% | 0.40% | -0.73% | 0.93% | 0.44% | 0.87% | |
| NZD | 0.53% | 0.27% | -0.09% | -1.00% | 0.54% | -0.44% | 0.58% | |
| CHF | 0.10% | -0.16% | -0.53% | -1.62% | 0.12% | -0.87% | -0.58% |
The heat map shows percentage changes of major currencies against each other. The base currency is picked from the left column, while the quote currency is picked from the top row. For example, if you pick the British Pound from the left column and move along the horizontal line to the US Dollar, the percentage change displayed in the box will represent GBP (base)/USD (quote).

Acuity Trading
Acuity Trading 是一家成立於 2013 年、總部位於倫敦的金融科技公司,專注於 AI 驅動的另類數據與情緒分析,用於交易與投資。他們以可視化新聞與情緒工具革新線上交易體驗,並持續以最新 AI 研究與技術提供可產生阿爾法的另類數據與高度互動的交易工具。
Read More


