
Trade The World
Litecoin Price Forecast: LTC breaks above bullish technical pattern, targets $170 mark
作者 Manish Chhetri
發布日期: 13 Aug 2025 | 修改日期: 13 Aug 2025


POPULAR ARTICLES

Litecoin (LTC) price is showing renewed bullish strength after breaking out of an ascending channel pattern, trading above $133 at the time of writing on Wednesday.
- Litecoin price breaks out of an ascending channel pattern, signaling potential upside acceleration.
- Open Interest reaches a record high of $1.27 billion, while hashrate continues to climb, boosting network security.
- Technical setup supports a rally continuation toward the $170 target level.
Litecoin (LTC) price is showing renewed bullish strength after breaking out of an ascending channel pattern, trading above $133 at the time of writing on Wednesday. This breakout often signals the start of an accelerated uptrend, which is further supported by the rising Open Interest (OI) and a steadily climbing hashrate, targeting a rally toward $170.
Litecoin’s Open Interest hits a record high of $1.27 billion
CoinGlass’ data shows that the futures OI in Litecoin at exchanges rises to a new all-time high of $1.2 billion on Wednesday from $832 million in early August. Rising OI represents new or additional money entering the market and new buying, which could fuel the current LTC price rally.
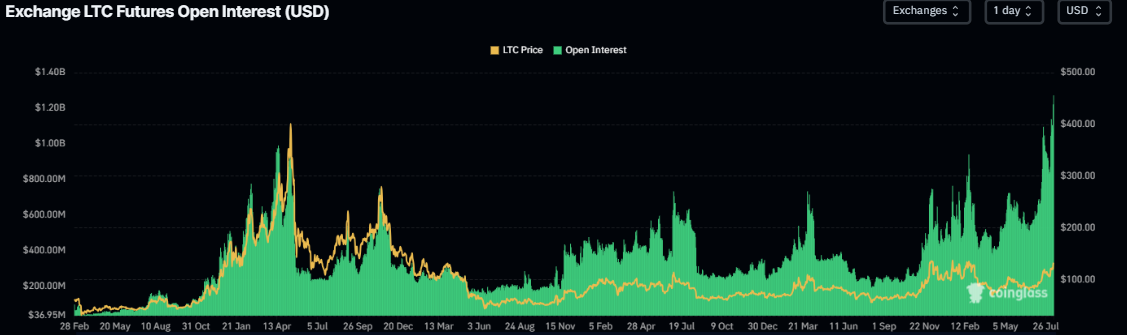
Litecoin Open Interest chart. Source: CoinGlass
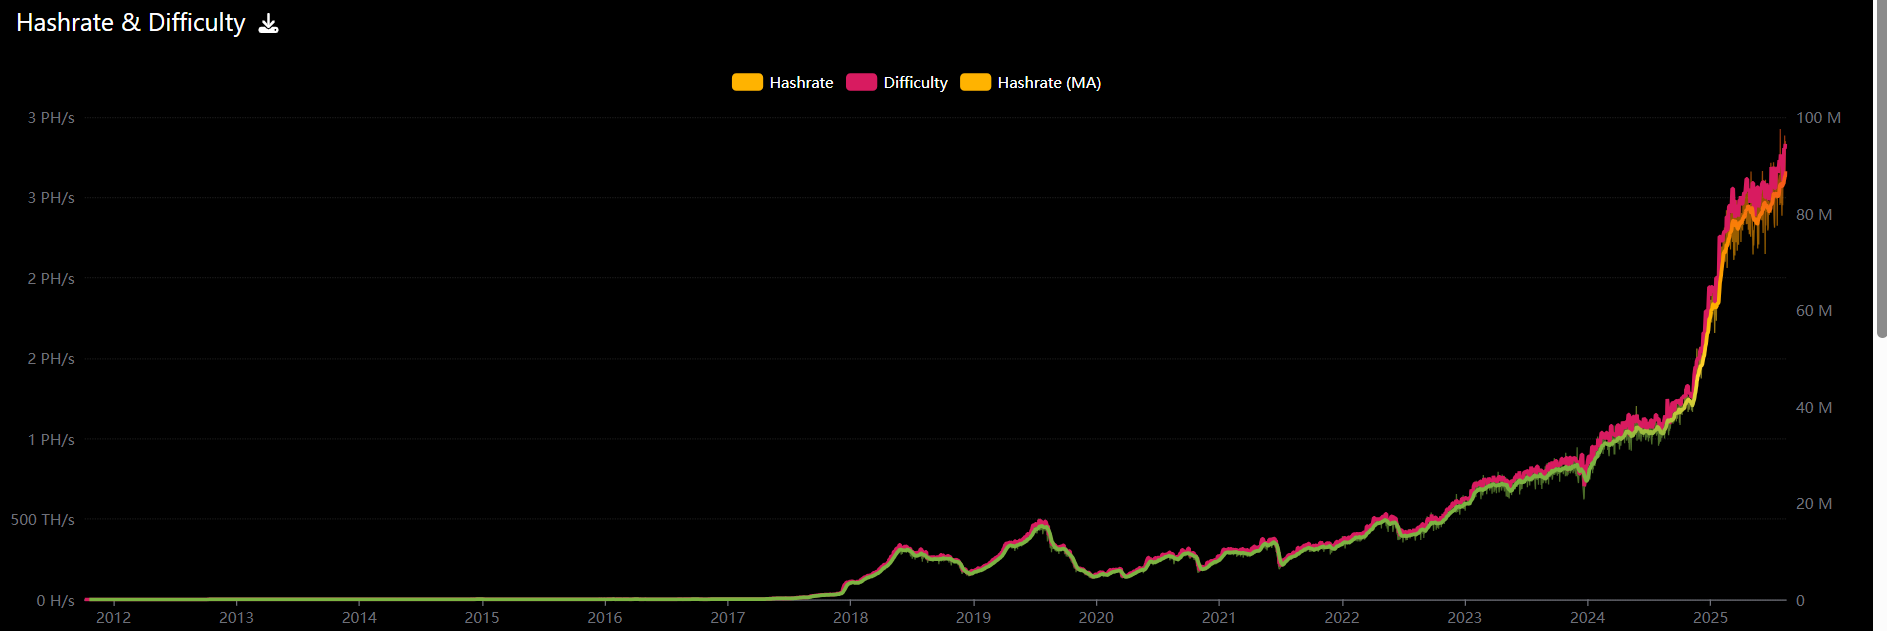
Litecoin’s hashrate has been constantly rising, as shown in the graph below, indicating a significant increase in mining power and network security since its launch, which has boosted investors’ confidence in the LTC network.
Adding to this positive narrative is the rising bullish bets among LTC traders. Coinglass’s long-to-short ratio data for LTC reads 1.08, the highest level over a month.
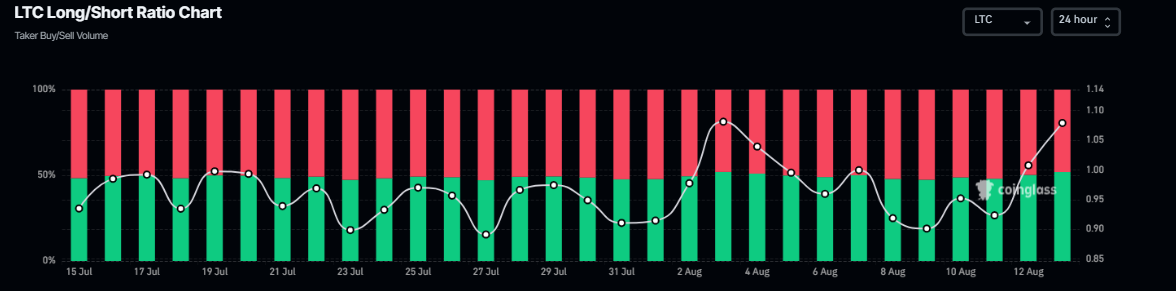
Litecoin long-to-short ratio. Source: CoinGlass
Litecoin Price Forecast: Bulls aiming for $170 mark
Litecoin price closed above the ascending parallel channel pattern (drawn by connecting multiple highs and lows with two trendlines since mid-March) on Tuesday. The breakout of this pattern favors the bulls, with a technical target often projected as the channel’s height from the breakout point. At the time of writing on Wednesday, it continues to trade higher above $133.
If LTC continues its upward trend, it could extend the rally toward its technical target of $170.30. Investors should be cautious of this theoretical move, as any upside move could encounter resistance at the December 5 high at $147.06, where traders could book some profits.
The Relative Strength Index (RSI) on the daily chart read 70, moving upward toward its overbought condition, indicating strong bullish momentum. The MACD showed a bullish crossover on August 5 and also shows rising green histogram bars, further supporting the bullish thesis.
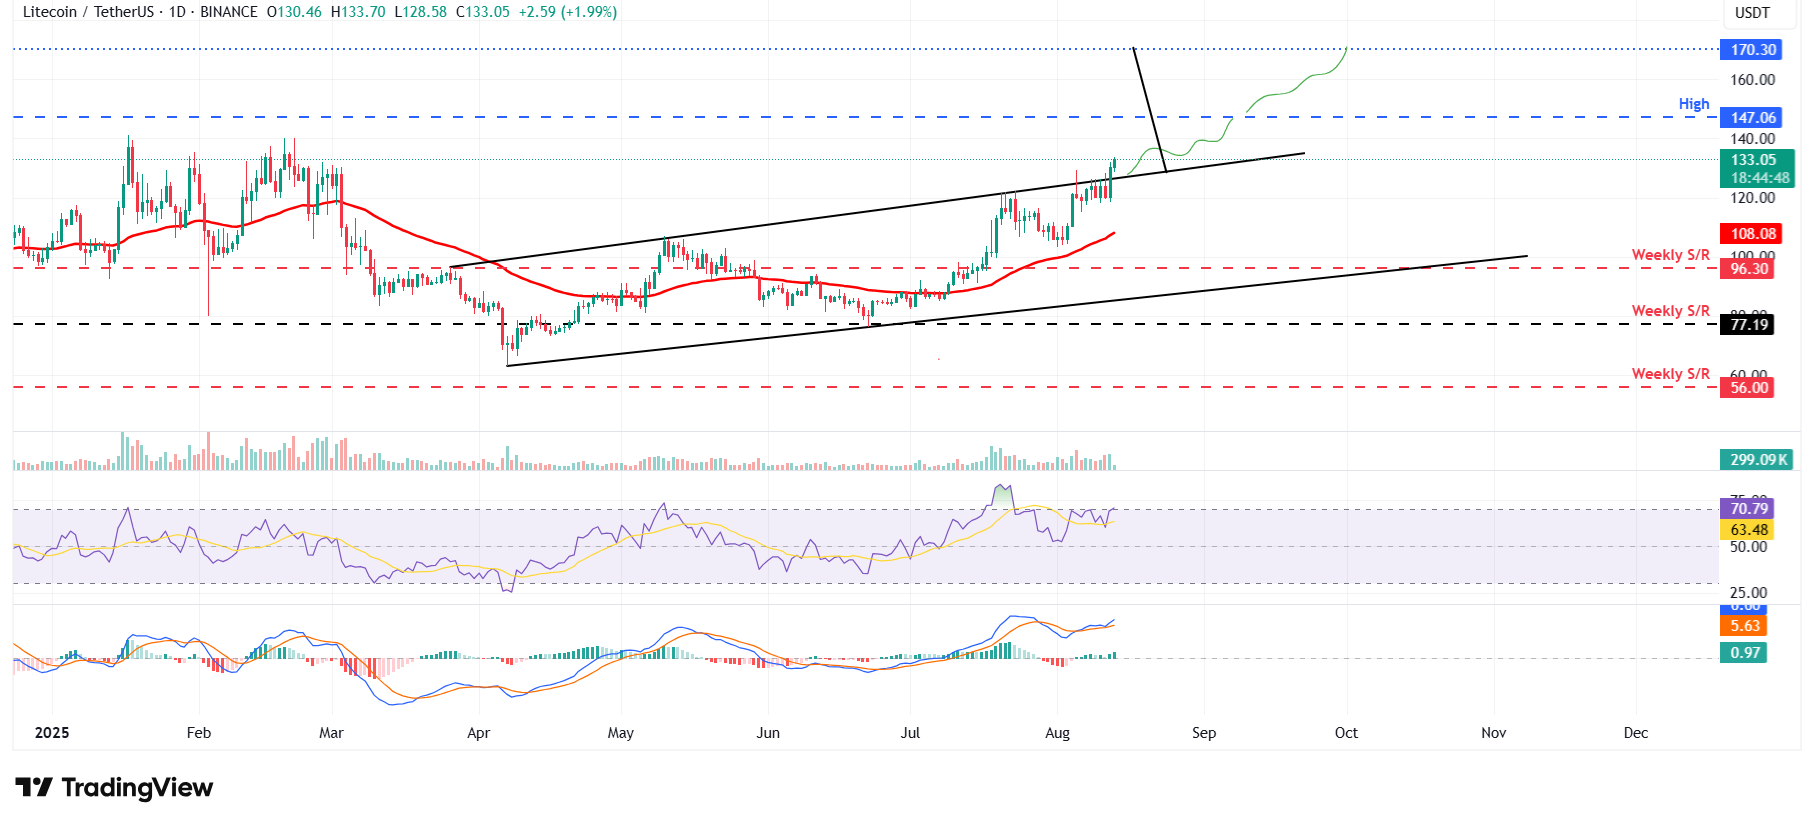
LTC/USDT daily chart
However, if LTC faces a correction, it could find support at the upper channel trendline boundary at $125.

Acuity Trading
Acuity Trading 是一家成立於 2013 年、總部位於倫敦的金融科技公司,專注於 AI 驅動的另類數據與情緒分析,用於交易與投資。他們以可視化新聞與情緒工具革新線上交易體驗,並持續以最新 AI 研究與技術提供可產生阿爾法的另類數據與高度互動的交易工具。
Read More


