
Trade The World
XRP Price Prediction: XRP struggles at $3 as network activity dwindles
作者 John Isige
發布日期: 15 Sep 2025 | 修改日期: 15 Sep 2025


POPULAR ARTICLES

Ripple (XRP) is challenging the $3.00 support level on Monday amid a bearish shockwave criss-crossing the broader cryptocurrency market.
- XRP starts the week on the back foot, challenging the $3.00 support level.
- Active addresses on the XRP Ledger extend decline, averaging above 22,500 as downside risks persist.
- A descending trendline and the 50-day EMA hold as key support levels.
Ripple (XRP) is challenging the $3.00 support level on Monday amid a bearish shockwave criss-crossing the broader cryptocurrency market. Retail interest in the cross-border money remittance token remains elevated, as shown by the OI-weighted funding rate, which averages 0.0087% at the time of writing.
A positive and steady funding rate implies that more traders are piling into long positions.
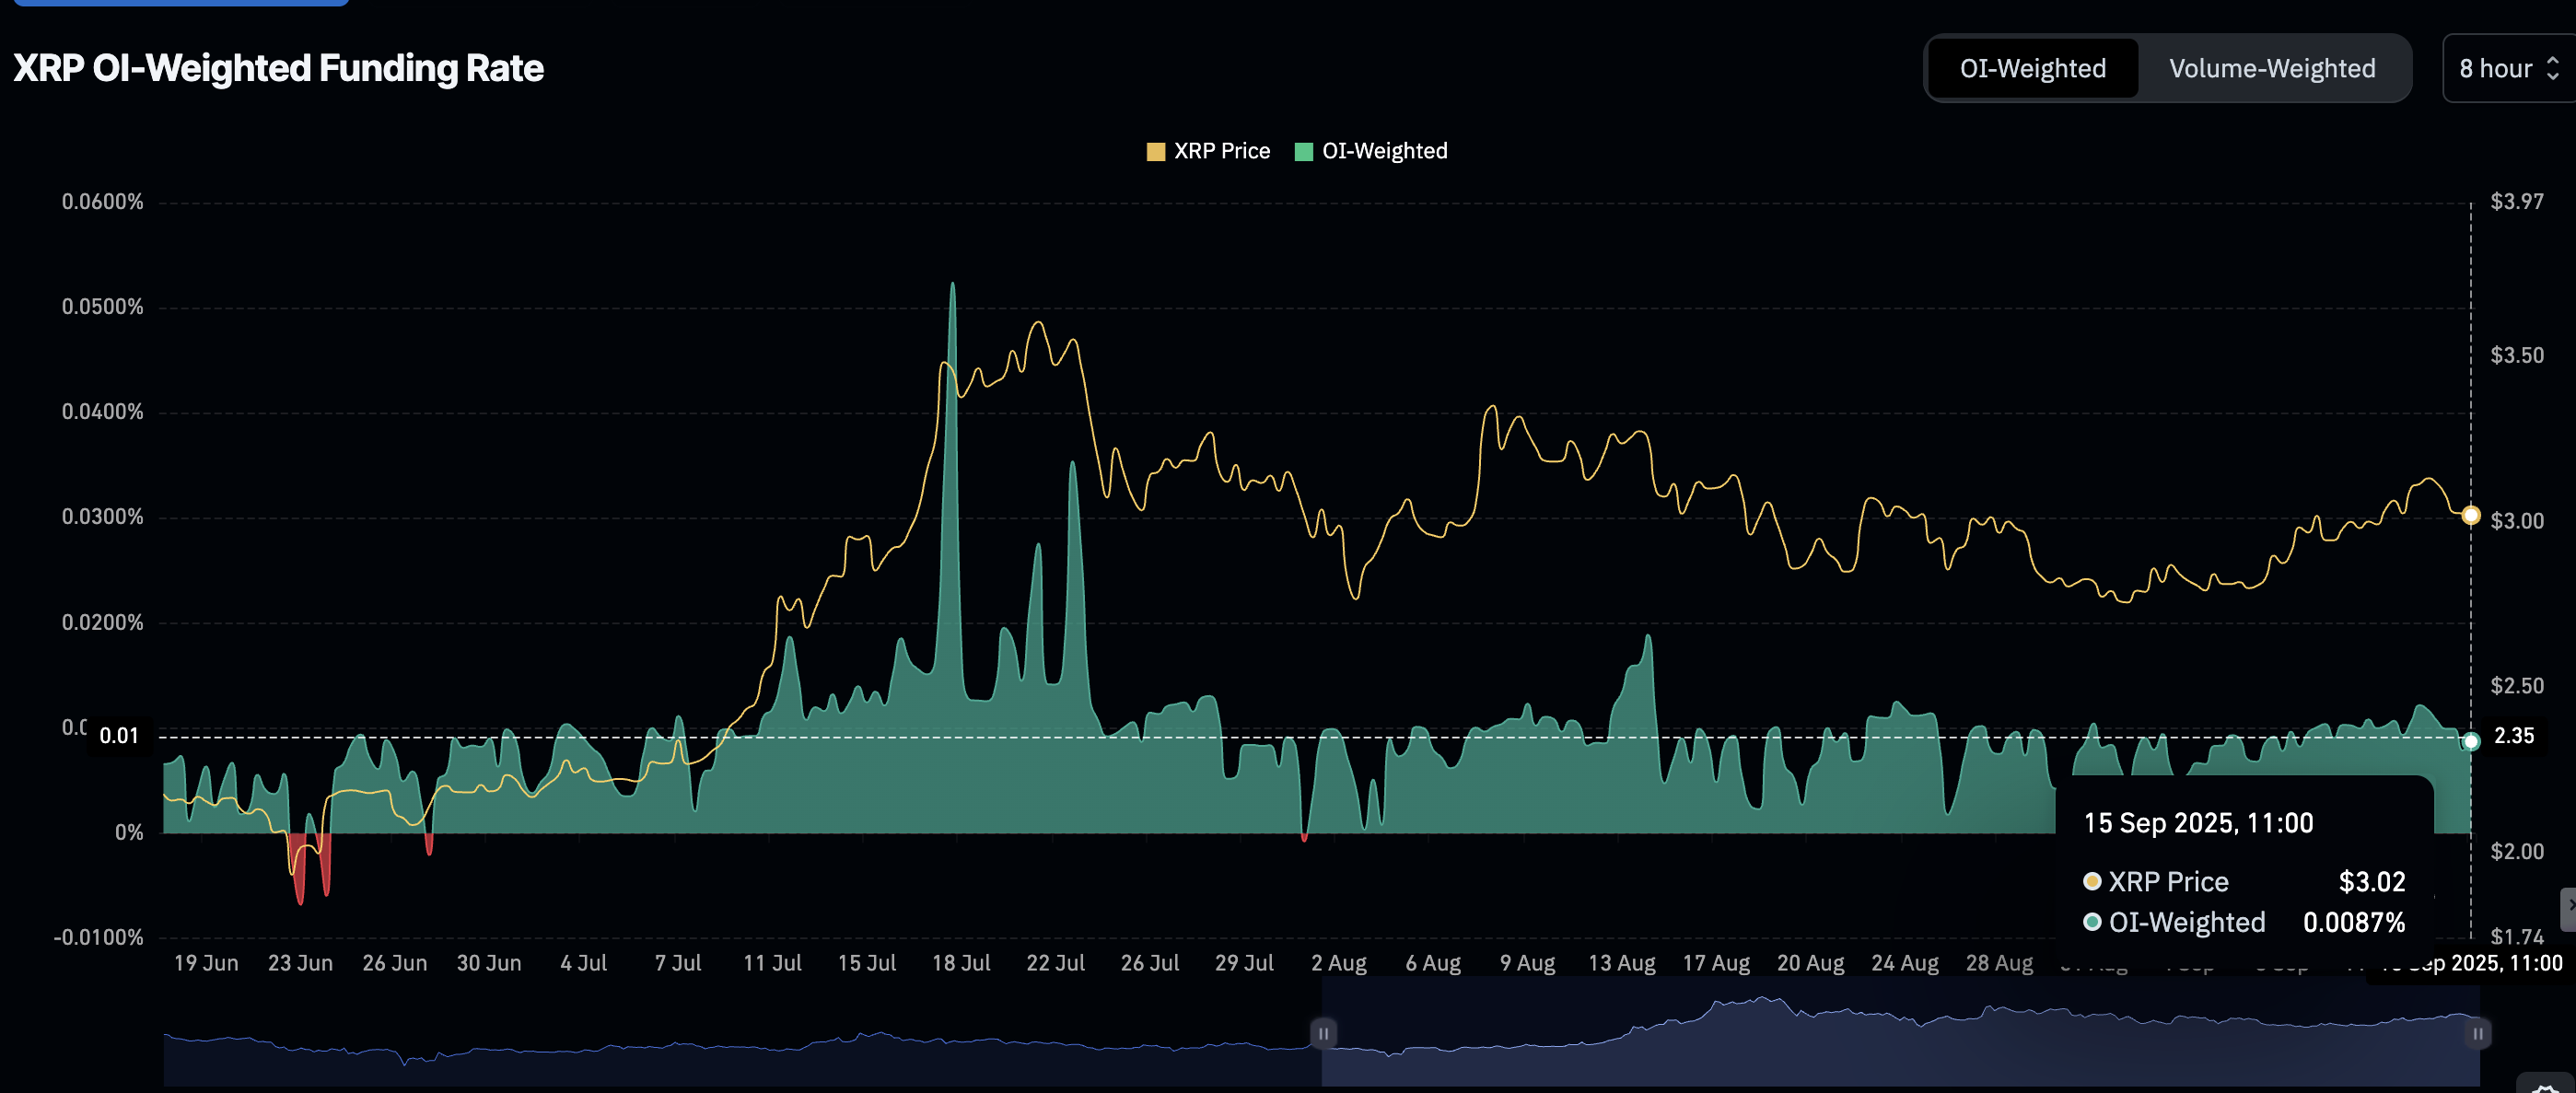
XRP OI-Weighted Funding Rate | Source: CoinGlass
XRP struggles at $3.00 as network activity slows
The elevated retail demand for XRP, as indicated by the futures weighted funding rate and Open Interest (OI), has not been reflected in on-chain activity. According to CryptoQuant’s data, active addresses on the XRP Ledger (XRPL) are down 55% to approximately 22,500 from roughly 50,000 in mid-July.
Such a reduction in addresses interacting with the network, whether by sending or receiving XRP, indicates reduced network engagement, low transaction volume and diminishing demand for the token.
If the downtrend in the Active Addresses metric persists, XRP could experience price stagnation or downside pressure.
-1757947000955-1757947000955.png)
XRP Active Addresses | Source: CryptoQuant
Technical outlook: XRP could extend decline
XRP is trading around the $3.00 critical level on Monday, down from an intraday high of $3.06. The daily chart below shows a descending trend line support around the same level, increasing the potential for a rebound.
Still, the Relative Strength Index (RSI), which has dropped to 53 after peaking at 61 on Saturday, backs the short-term bearish outlook. If the RSI extends the decline below the midline, indicating that bullish momentum is fading, XRP could drop to retest the 50-day Exponential Moving Average (EMA) support at $2.94.
The 100-day EMA at $2.81 and the 200-day EMA at $2.56 are positioned to offer support in case investors significantly reduce their exposure.
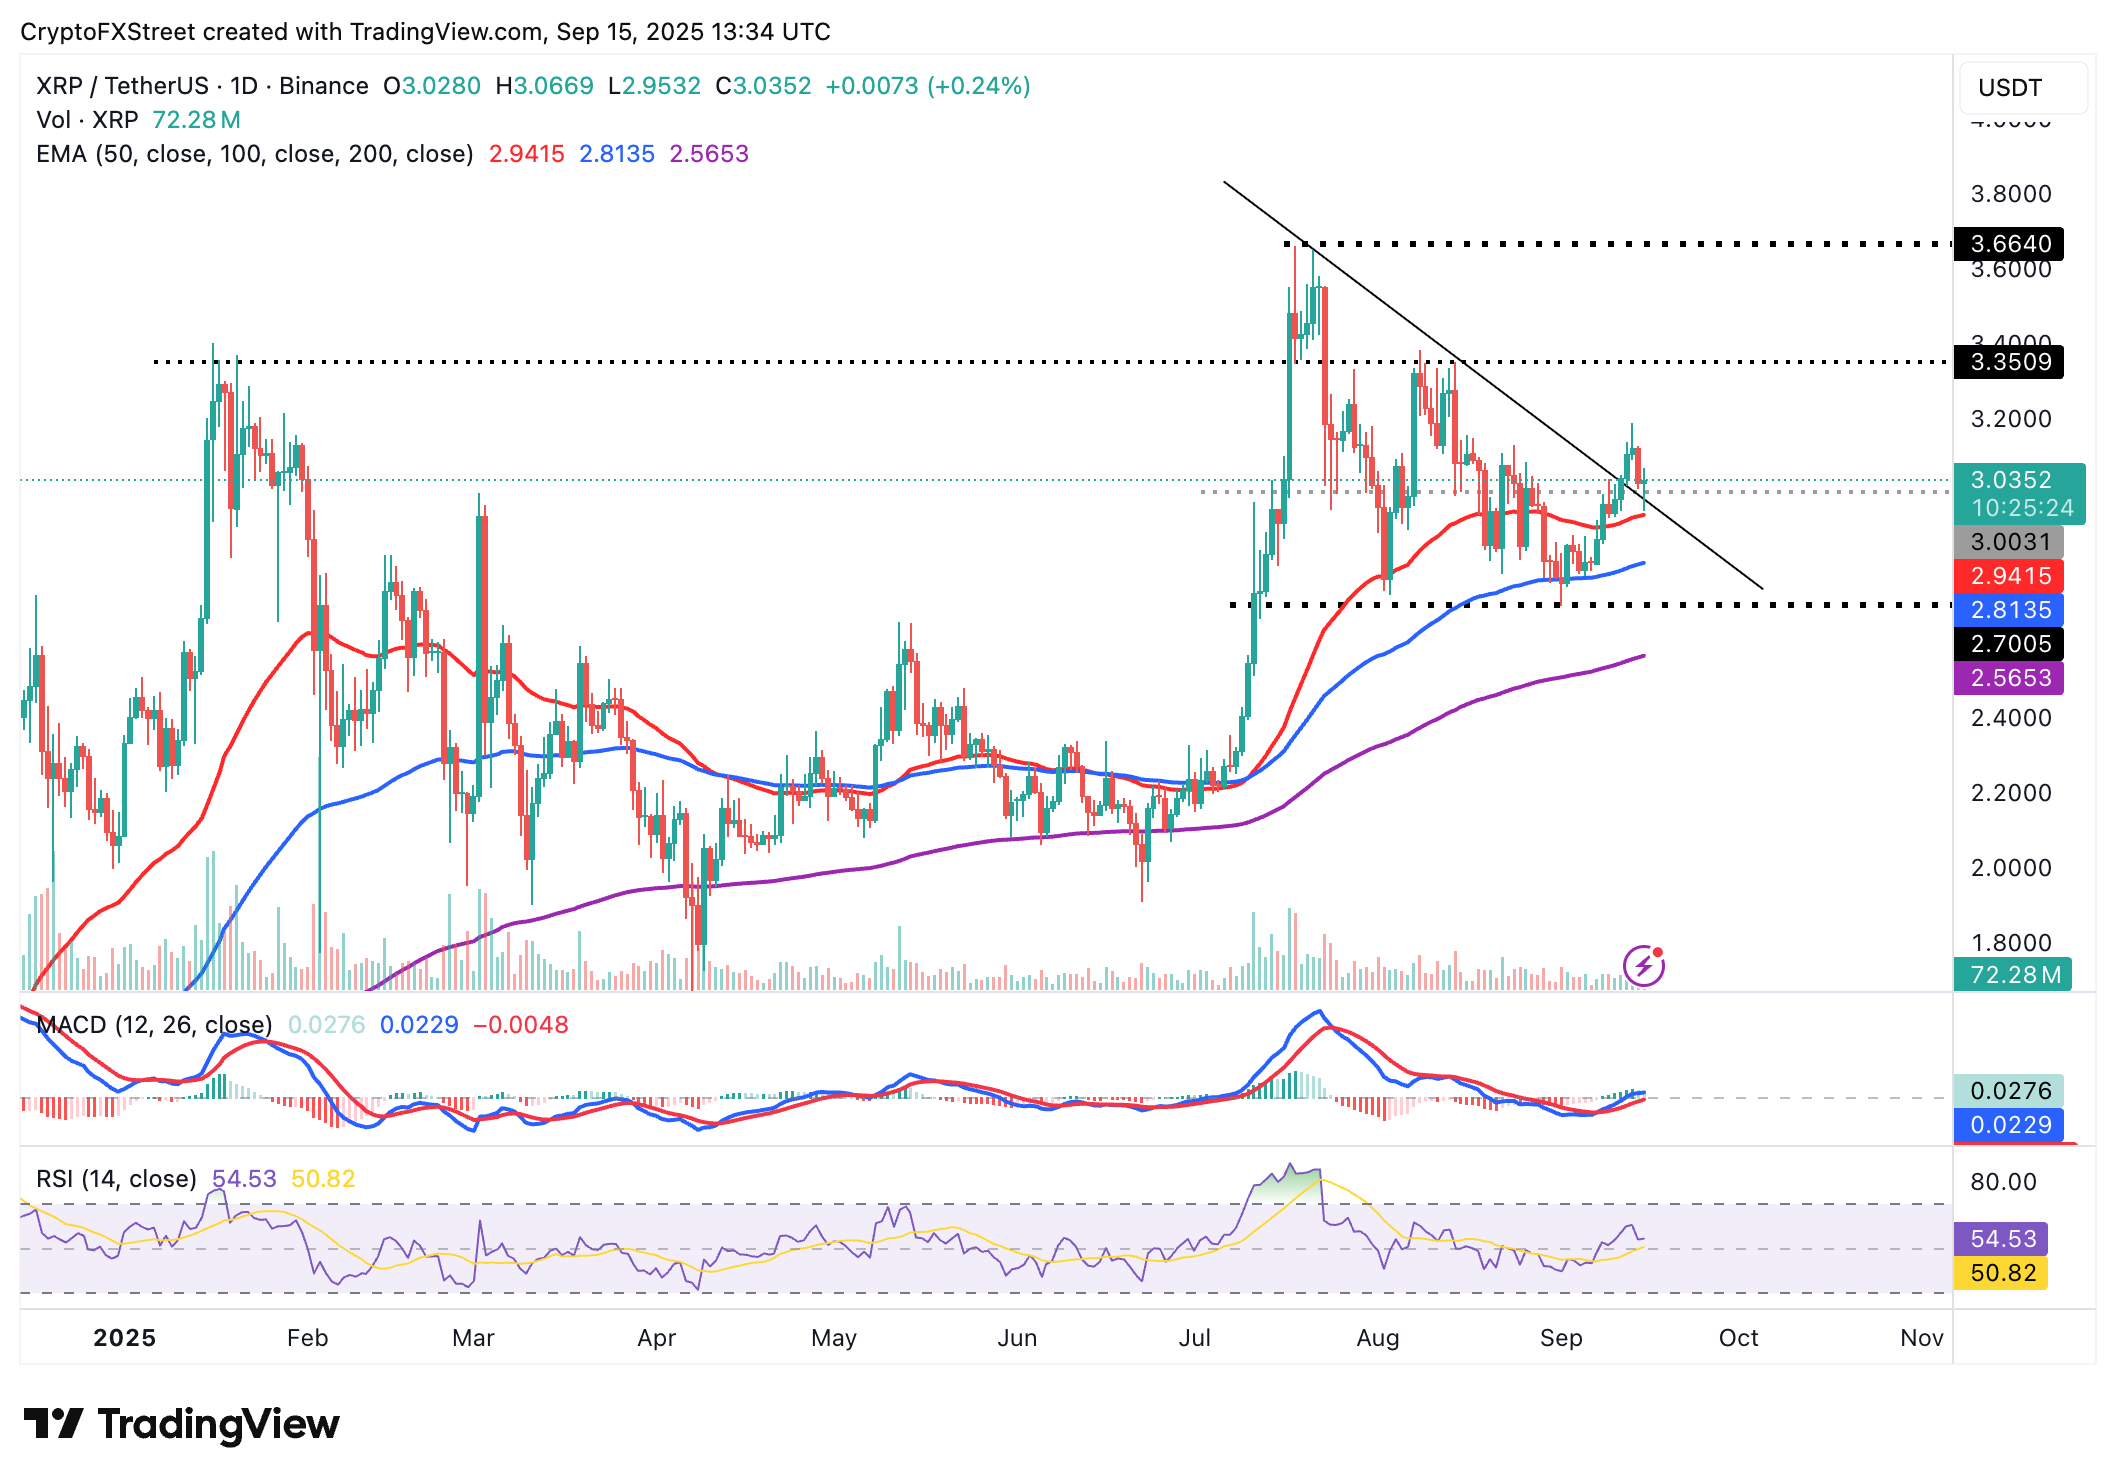
XRP/USDT daily chart
Traders should monitor the Moving Average Convergence Divergence (MACD) indicator for insights into the next direction the XRP price is likely to take. If the blue MACD line remains above the red signal line, a bullish reversal toward resistance at $3.18, which was previously tested on Saturday, could gain momentum.
Still, a sell signal would be confirmed if the same blue MACD line crosses below the red signal line, affirming risk-off sentiment. Investors often consider de-risking with the MACD indicator trending downward, while maintaining a sell signal.
Cryptocurrency prices FAQs
Token launches influence demand and adoption among market participants. Listings on crypto exchanges deepen the liquidity for an asset and add new participants to an asset’s network. This is typically bullish for a digital asset.
A hack is an event in which an attacker captures a large volume of the asset from a DeFi bridge or hot wallet of an exchange or any other crypto platform via exploits, bugs or other methods. The exploiter then transfers these tokens out of the exchange platforms to ultimately sell or swap the assets for other cryptocurrencies or stablecoins. Such events often involve an en masse panic triggering a sell-off in the affected assets.
Macroeconomic events like the US Federal Reserve’s decision on interest rates influence crypto assets mainly through the direct impact they have on the US Dollar. An increase in interest rate typically negatively influences Bitcoin and altcoin prices, and vice versa. If the US Dollar index declines, risk assets and associated leverage for trading gets cheaper, in turn driving crypto prices higher.
Halvings are typically considered bullish events as they slash the block reward in half for miners, constricting the supply of the asset. At consistent demand if the supply reduces, the asset’s price climbs.

Acuity Trading
Acuity Trading 是一家成立於 2013 年、總部位於倫敦的金融科技公司,專注於 AI 驅動的另類數據與情緒分析,用於交易與投資。他們以可視化新聞與情緒工具革新線上交易體驗,並持續以最新 AI 研究與技術提供可產生阿爾法的另類數據與高度互動的交易工具。
Read More


