
Trade The World
USD/JPY Price Forecast: Subdued at around 150.00
作者 Christian Borjon Valencia
發布日期: 21 Oct 2025 | 修改日期: 21 Oct 2025


POPULAR ARTICLES

The USD/JPY holds firm on Monday, hovering around 150.60 amid a risk-on environment amid the Fed blackout period and the lack of US data, due to the government shutdown. The lack of market moving comments by US President Donald Trump, could keep the pair trading at familiar levels.
- USD/JPY finds firm support at 20-day SMA near 150.14, maintaining a bullish technical structure.
- Fed blackout and US government shutdown mute macro signals, keeping price action rangebound.
- Break above 151.20 opens path toward 152.00, while a drop below 150 risks deeper pullback.
The USD/JPY holds firm on Monday, hovering around 150.60 amid a risk-on environment amid the Fed blackout period and the lack of US data, due to the government shutdown. The lack of market moving comments by US President Donald Trump, could keep the pair trading at familiar levels.
USD/JPY Price Forecast: Technical outlook
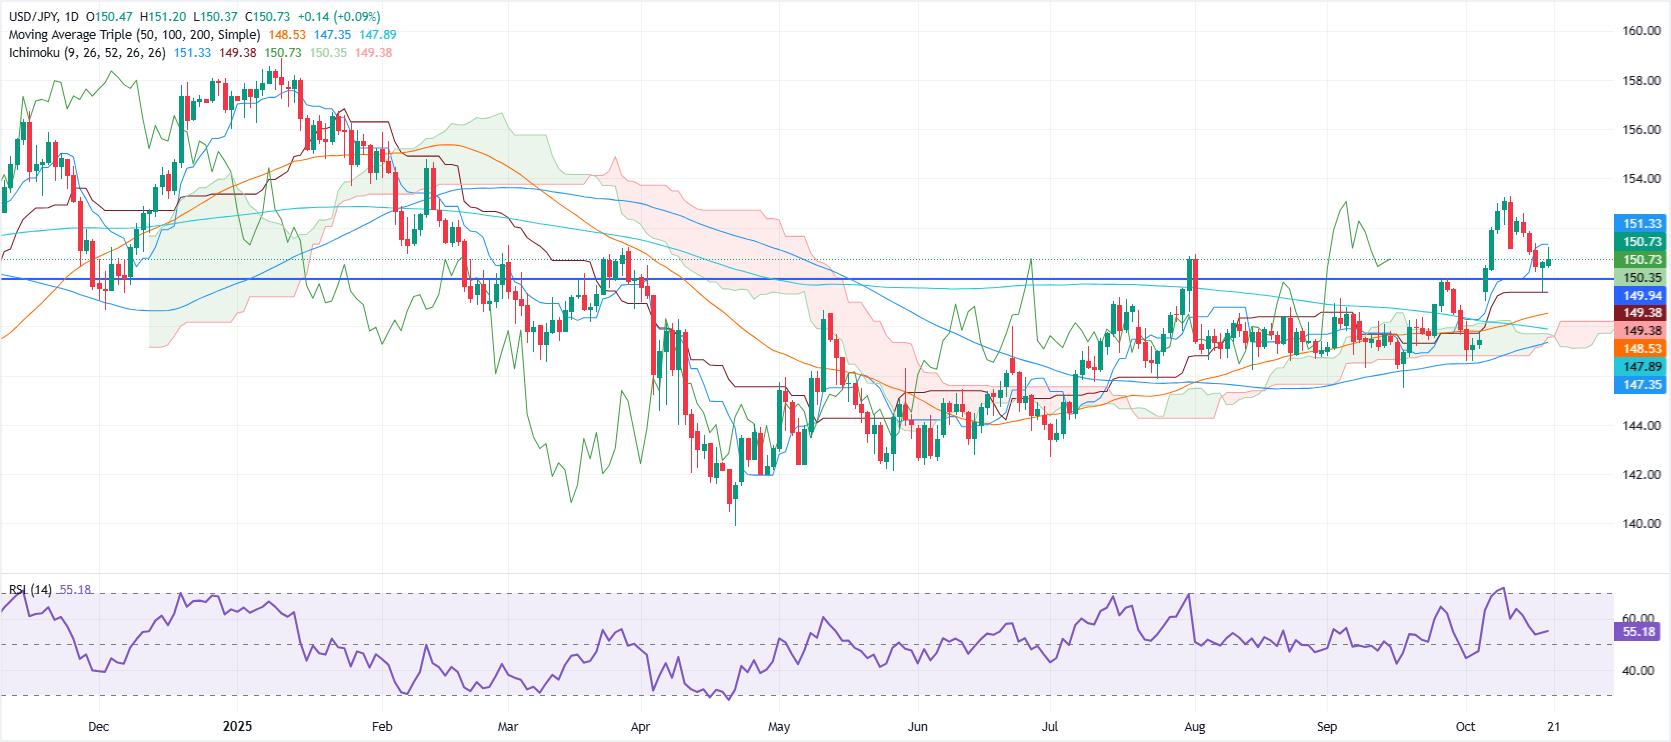
The technical picture shows that the pair found support at the 20-day Simple Moving Average (SMA) around 150.14, after bouncing off daily lows of 149.37, reached last Friday, which ultimately finished the session above 150.00.
For a bullish continuation, buyers must clear the October 20 peak at 151.20. If surpassed, this clears the path towards 152.00, followed by October 10 high if 153.27.
On the flip side, if sellers drive the exchange rate below 150.00, the next support would be 149.37 followed by the 50-day SMA at 148.57.
USD/JPY Price Chart – Daily
Japanese Yen Price This week
The table below shows the percentage change of Japanese Yen (JPY) against listed major currencies this week. Japanese Yen was the strongest against the Swiss Franc.
| USD | EUR | GBP | JPY | CAD | AUD | NZD | CHF | |
|---|---|---|---|---|---|---|---|---|
| USD | -0.03% | 0.07% | 0.02% | -0.00% | -0.02% | -0.05% | 0.04% | |
| EUR | 0.03% | 0.01% | 0.07% | 0.02% | -0.03% | -0.03% | 0.07% | |
| GBP | -0.07% | -0.01% | 0.02% | 0.00% | -0.03% | -0.03% | 0.07% | |
| JPY | -0.02% | -0.07% | -0.02% | -0.02% | -0.03% | -0.12% | 0.04% | |
| CAD | 0.00% | -0.02% | -0.00% | 0.02% | -0.04% | -0.05% | 0.05% | |
| AUD | 0.02% | 0.03% | 0.03% | 0.03% | 0.04% | -0.00% | 0.09% | |
| NZD | 0.05% | 0.03% | 0.03% | 0.12% | 0.05% | 0.00% | 0.10% | |
| CHF | -0.04% | -0.07% | -0.07% | -0.04% | -0.05% | -0.09% | -0.10% |
The heat map shows percentage changes of major currencies against each other. The base currency is picked from the left column, while the quote currency is picked from the top row. For example, if you pick the Japanese Yen from the left column and move along the horizontal line to the US Dollar, the percentage change displayed in the box will represent JPY (base)/USD (quote).

Acuity Trading
Acuity Trading 是一家成立於 2013 年、總部位於倫敦的金融科技公司,專注於 AI 驅動的另類數據與情緒分析,用於交易與投資。他們以可視化新聞與情緒工具革新線上交易體驗,並持續以最新 AI 研究與技術提供可產生阿爾法的另類數據與高度互動的交易工具。
Read More


