
Trade The World
1inch Price Forecast: Whale accumulation and technical breakout set stage for continued rally
作者 Manish Chhetri
發布日期: 9 Sep 2025 | 修改日期: 9 Sep 2025


POPULAR ARTICLES

1inch (1INCH) price trades in green on Tuesday for a third consecutive day, above $0.258 at the time of writing, after breaking out from a symmetrical triangle pattern, in a technical setup that points to double-digit gains.
- 1inch price breaks above a symmetrical triangle pattern, signaling a bullish rally ahead.
- Purchases from large wallets are increasing since the beginning of September.
- The technical outlook suggests a rally towards $0.272 and $0.302 on the 4-hour and daily charts, respectively.
1inch (1INCH) price trades in green on Tuesday for a third consecutive day, above $0.258 at the time of writing, after breaking out from a symmetrical triangle pattern, in a technical setup that points to double-digit gains. On-chain data also supports the bullish outlook as accumulation from large wallets is rising.
1inch’s large wallet accumulation signals growing confidence
Santiment’s Supply Distribution data supports a bullish outlook for 1inch, as most of the cohorts holding large amounts of tokens continue to increase their holdings.
Whales holding between 10 million and 100 million 1INCH tokens (blue line) and wallets holding between 100,000 and 1 million (red line) have accumulated a total of 140.52 million tokens from September 2 to Tuesday. Meanwhile, wallets holding between 1 million and 10 million have shed 23 million 1INCH tokens during the same period.
This shows that, while the second cohort of whales could have fallen prey to a capitulation event, the first set of wallets seized the opportunity and accumulated 1INCH tokens at a discount.
 [12-1757406402068-1757406402069.38.02, 09 Sep, 2025].png)
1INCH supply distribution metric chart. Source: Santiment
1INCH Price Forecast: Bulls gain control
On the 4-hour chart, the 1inch price broke above $0.254 on Tuesday, which aligns with the upper boundary of a parallel channel . This breakout favors the bulls, with a technical target at $0.272, which is obtained based on the height of the channel from the breakout point.
Before that, sideline investors could look for a buying opportunity between $0.258 and $0.254, with a tighter stop-loss around $0.249 or a wider stop-loss at $0.245, at the midpoint of the channel.
The Relative Strength Index (RSI) on the 4-hour chart reads 68, above its neutral level of 50 and still below overbought conditions, indicating further upside potential.
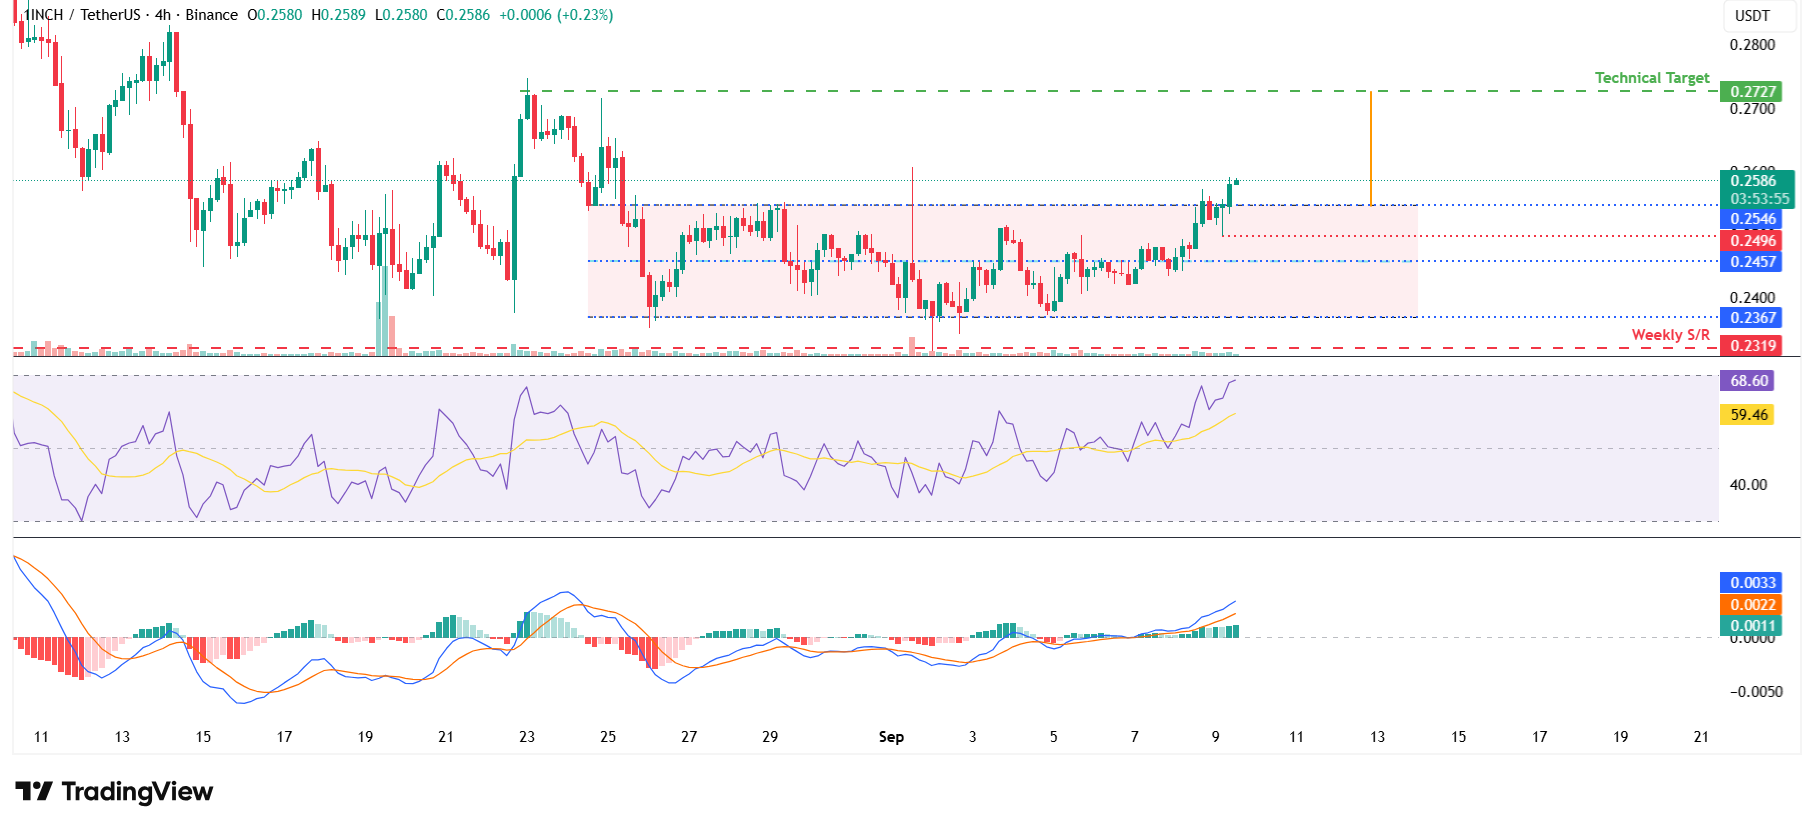
1INCH/USDT 4-hour chart
The daily chart also supports the bullish outlook. 1inch price broke above the descending trendline of a symmetrical triangle pattern on Monday and closed above the 50-day Exponential Moving Average (EMA) at $0.253. A breakout above this zone favours bulls, and at the time of writing on Tuesday, it continues to trade higher above $0.258.
If 1inch continues its upward momentum, it could extend gains toward the next resistance at $0.302, its 61.8% Fibonacci retracement drawn from the June low of $0.157 to the July high of $0.391.
The RSI on the daily chart is moving above its neutral level of 50, indicating early signs of bullish momentum. The Moving Average Convergence Divergence (MACD) showed a bullish crossover on Sunday, giving a buy signal and supporting the bullish view.
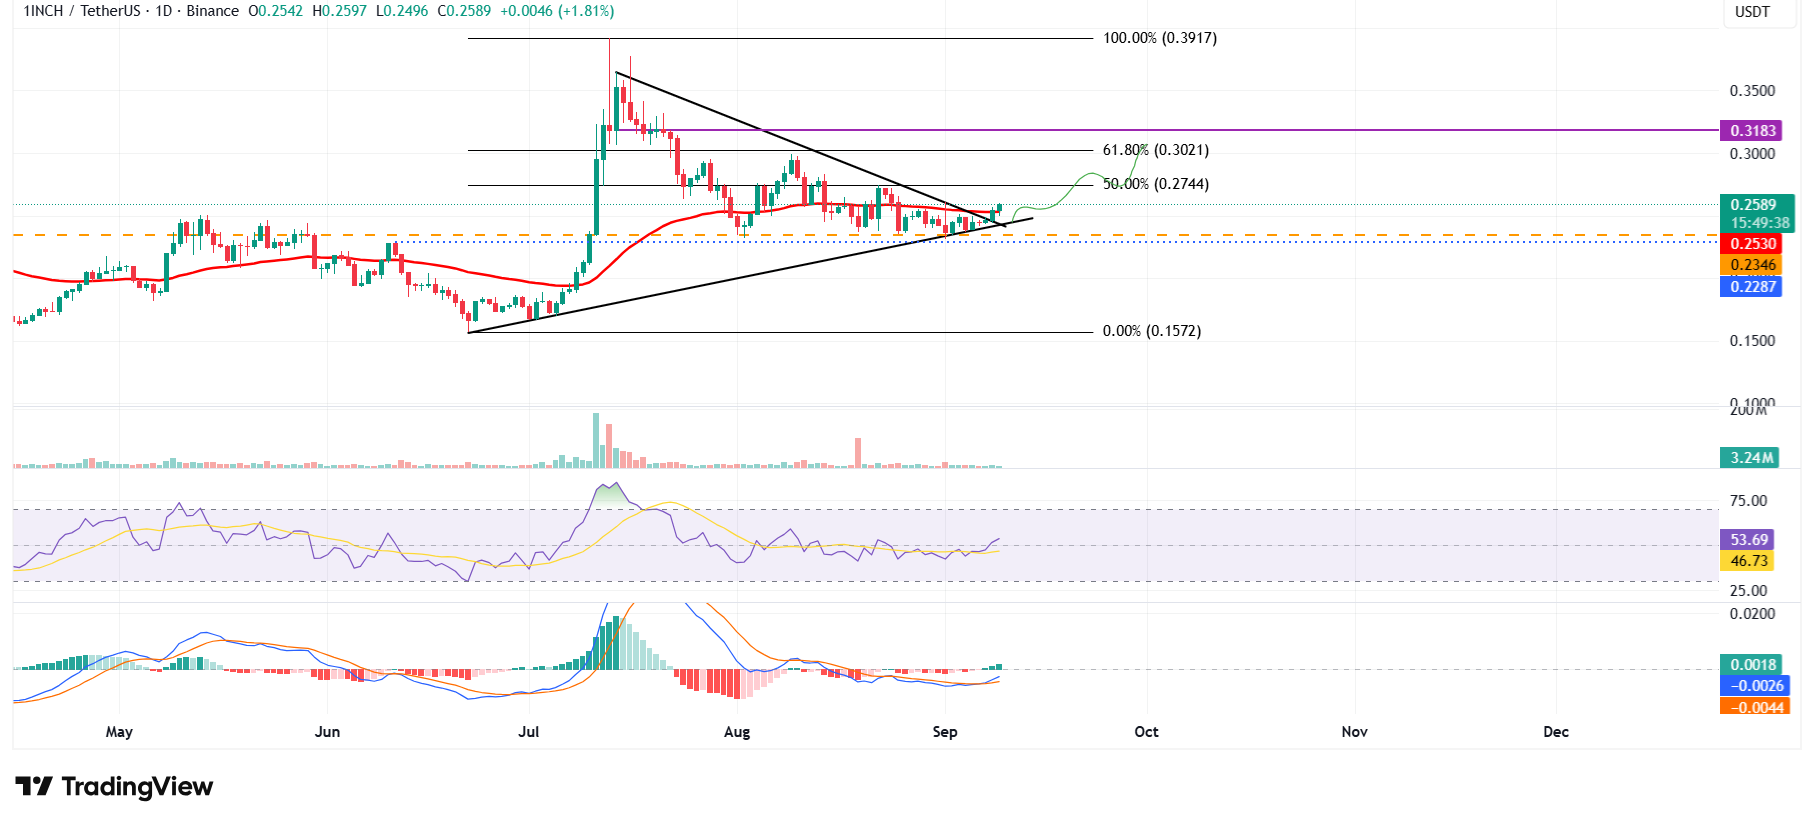
1INCH/USDT daily chart
If 1inch faces a correction, it could extend the decline toward its daily support at $0.234.

FXStreet
超過一百萬用戶依賴 FXStreet 獲取即時市場數據、圖表工具、專家洞見與外匯新聞。其全面的經濟日曆與教育網路研討會協助交易者保持資訊領先、做出審慎決策。FXStreet 擁有約 60 人的團隊,分布於巴塞隆納總部及全球各地。
Read More


