
Trade The World
Analysts compare Bitcoin to the Soybean crash, predict sharp moves ahead
作者 Vishal Dixit
發布日期: 22 Oct 2025 | 修改日期: 22 Oct 2025


POPULAR ARTICLES

Bitcoin (BTC) is down 5% so far this month, failing to extend the six-year streak of “Uptober.” Analyst Peter Brandt notes that the BTC price movement mirrors the Soybean price ahead of its 1977 crash, when it declined 50% in value, while analyst Francis Hunt highlights a difference in the structure
- Peter Brandt finds the Bitcoin price behaving similarly to Soybean prices in 1977.
- Francis Hunt points out a key difference between the Bitcoin and Soybean prices, forecasting a potential upside.
- Holders with 100 to 1,000 BTC are on a buying spree, similar to what was seen before the 2021 bull run.
Bitcoin (BTC) is down 5% so far this month, failing to extend the six-year streak of “Uptober.” Analyst Peter Brandt notes that the BTC price movement mirrors the Soybean price ahead of its 1977 crash, when it declined 50% in value, while analyst Francis Hunt highlights a difference in the structure and locates an upside in the trend. The on-chain data corroborates Hunt’s discovery, forecasting a bull run similar to the 2021 rally.
Peter Brandt finds Bitcoin-Soybean connection
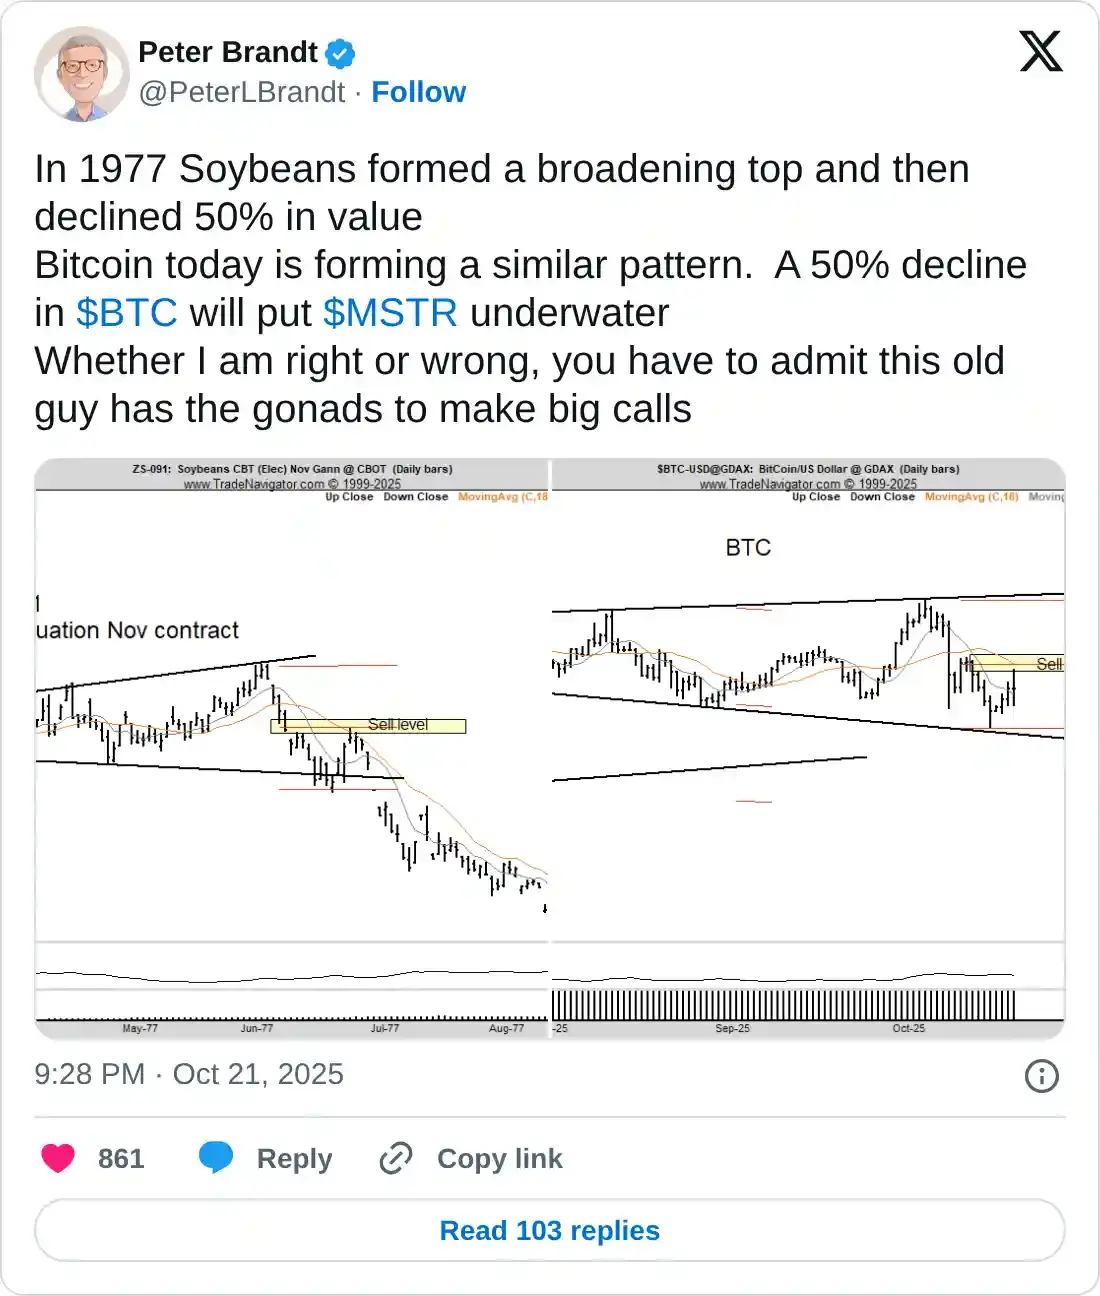
Peter Brandt, a veteran market analyst, shared in an X post on Tuesday that the Bitcoin price movement is forming a broadening top pattern on the daily price chart. This structure is formed by two diverging trendlines that connect the expanding price oscillation.
Brandt compares Bitcoin’s broadening top to a similar trend previously seen in Soybean, prior to its 1977 crash, which resulted in a 50% drop. The analyst shares a similar 50% drop warning in BTC, which could exceed the average buying price of Microstrategy’s (MSTR) Bitcoin holding.
Francis Hunt brings a fresh perspective
Francis Hunt, a Chartered Market Technician, shared a key difference between the Bitcoin and Soybean broadening top pattern. Hunt placed a splitting line between two patterns, distinguishing Soybean’s structure as an ascending Megaphone pattern on an uptrend. Typically, an ascending price following a rally is considered a potential reversal signal.
On the other hand, the splitter placed on Bitcoin’s pattern suggests a descending structure, which could be considered a short-term pullback before extending the prevailing uptrend.

Peter Brandt reposted the bullish possibility shared by Hunt and said, “I am willing to go with it in either direction. If BTC goes up I want to be long, if it goes down I want to be short.”
On-chain data points to a potential Bitcoin rally
Alphractal, a crypto data analysis platform, shared an ongoing buying spree among investors with 100 to 1,000 BTC from early 2024. A similar buying wave was observed in this cohort of traders before the 2021 bull run. However, a halt in their purchase trend aligns with the peaks of the 2017 and 2022 cycles.
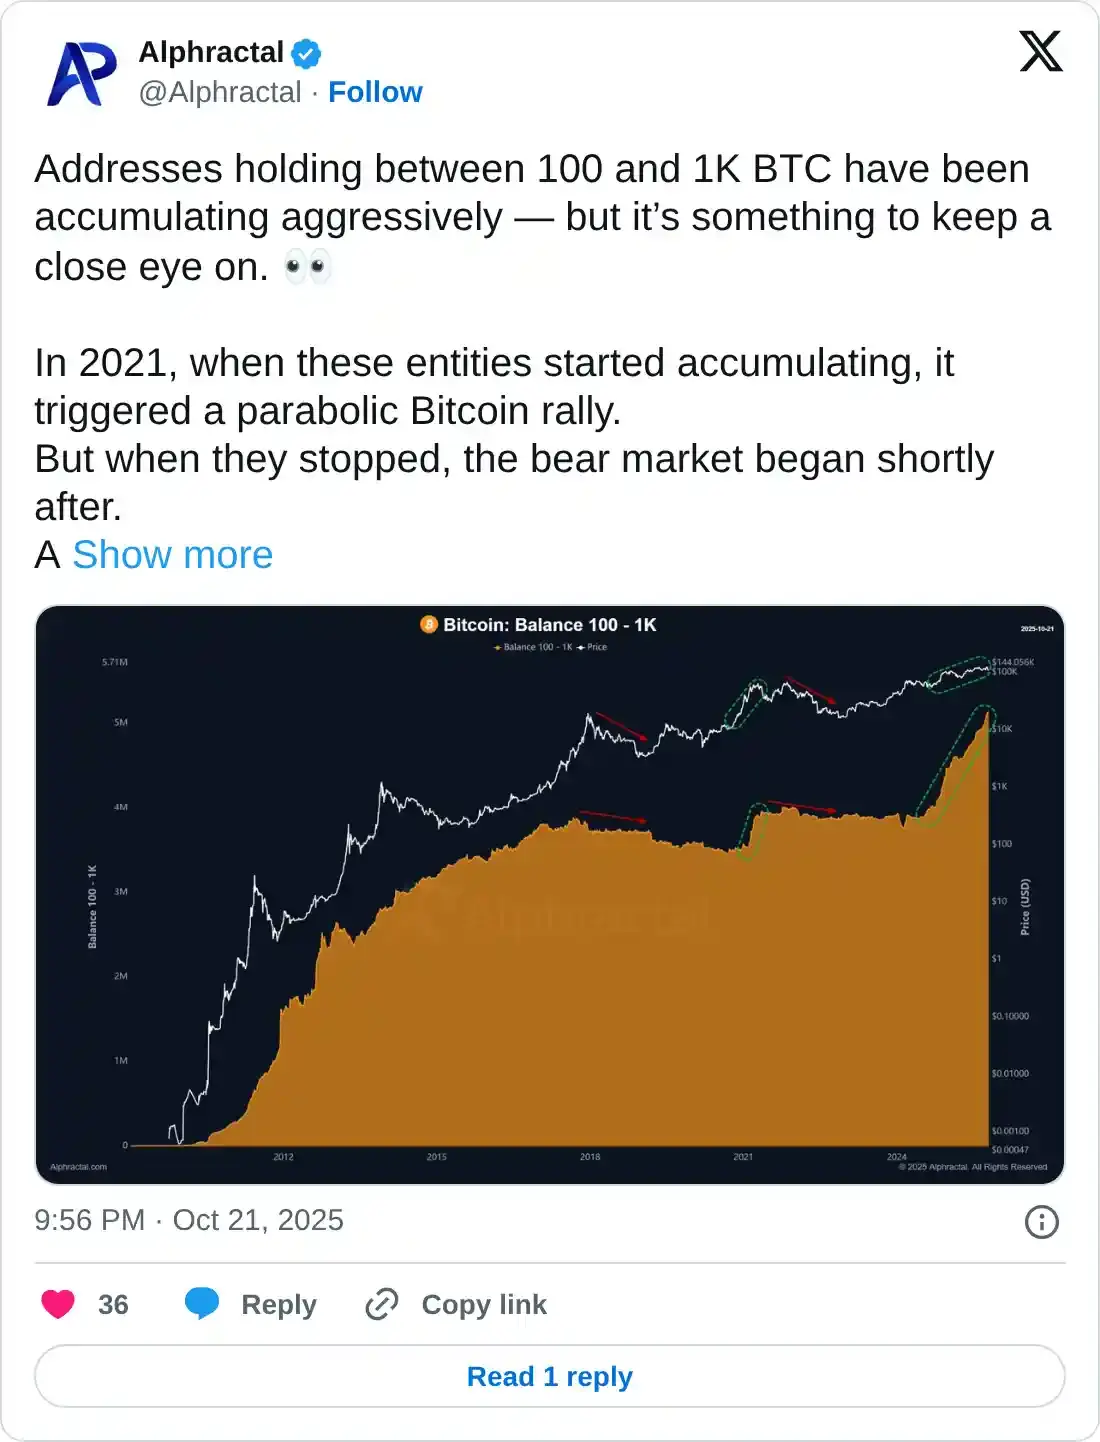
Currently, investors with 100 to 1,000 BTC continue to expand their holdings, which suggests a potential bullish trend extension. However, a pause or offloading in this activity could signal the top of the current Bitcoin upcycle.

FXStreet
超過一百萬用戶依賴 FXStreet 獲取即時市場數據、圖表工具、專家洞見與外匯新聞。其全面的經濟日曆與教育網路研討會協助交易者保持資訊領先、做出審慎決策。FXStreet 擁有約 60 人的團隊,分布於巴塞隆納總部及全球各地。
Read More


