
Bitcoin Cash trades lower, risks dead-cat bounce amid bearish signals
作者 Manish Chhetri
發布日期: 10 Feb 2026 | 修改日期: 10 Feb 2026


熱門文章

Bitcoin Cash (BCH) trades in the red below $522 at the time of writing on Tuesday, after multiple rejections at key resistance. BCH’s derivatives and on-chain indicators point to growing bearish sentiment and raise the risk of a dead-cat bounce toward lower support levels.
- Bitcoin Cash trades below $522 on Tuesday after multiple rejections at key resistance.
- Derivatives and on-chain data suggest a bearish outlook, with rising short bets and sell-side dominance.
- The technical outlook suggests a potential dead-cat bounce, with a downside target of $478.
Bitcoin Cash (BCH) trades in the red below $522 at the time of writing on Tuesday, after multiple rejections at key resistance. BCH’s derivatives and on-chain indicators point to growing bearish sentiment and raise the risk of a dead-cat bounce toward lower support levels.
Derivatives and on-chain metrics signal a bearish bias
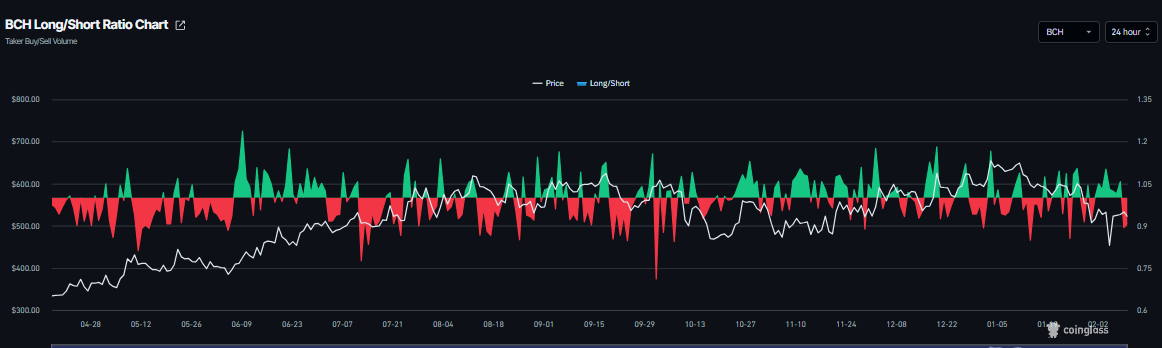
Bitcoin Cash’s derivatives data shows a bearish outlook. CoinGlass long-to-short ratio for HYPE reads 0.90 on Tuesday. This ratio, being below one, indicates bearish sentiment in the market, as more traders are betting on the asset’s price to fall.
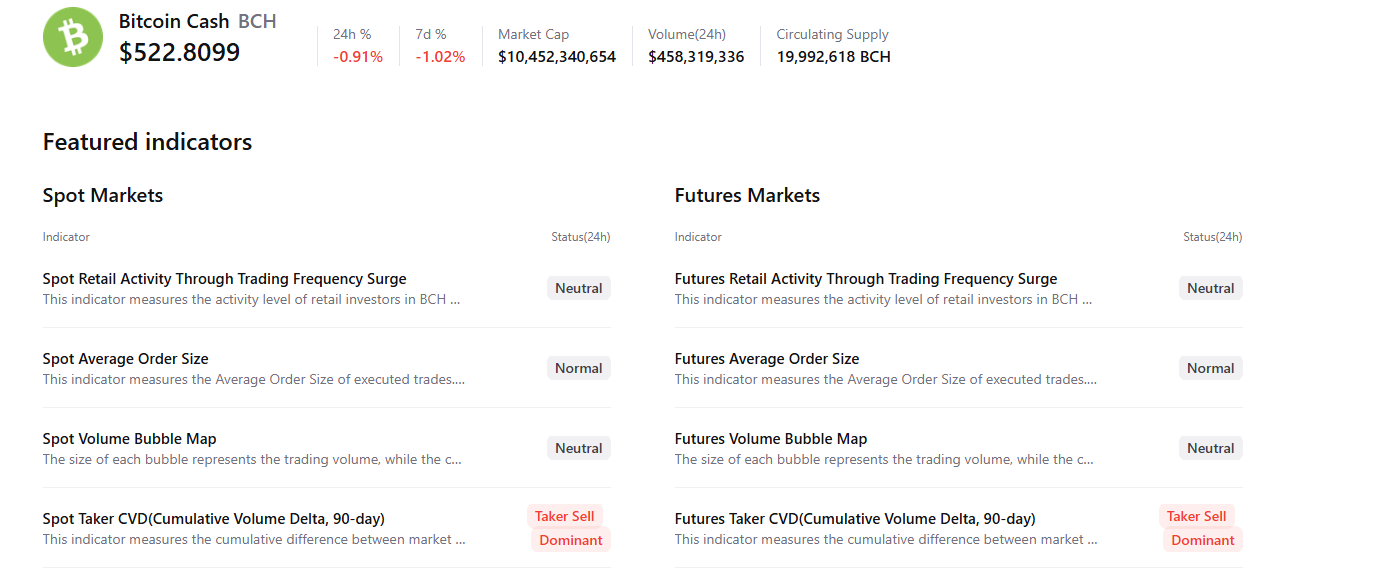
CryptoQuant’s summary data supports the negative outlook, as BCH’s spot and futures markets show sell dominance, signaling a correction ahead.
Bitcoin Cash Price Forecast: Dead-cat bounce scenario in play
Bitcoin Cash price has been rejected multiple times at the 61.8% Fibonacci retracement level (from the January 27 high of $603.90 to the February 6 low of $423.00) at $534.80. This level roughly coincides with the previously broken ascending trendline and the 200-day Exponential Moving Average (EMA) at $544.70, making this a key reversal zone.
Moreover, the current price action suggests a potential dead-cat bounce — a brief price increase within a broader downtrend — with BCH trading at $525.40 on Tuesday.
If BCH continues its correction, it could extend the decline toward the daily support at $478.70.
The Relative Strength Index (RSI) reads 44, below its neutral level of 50 and points downward, suggesting bearish momentum is gaining traction. However, the Moving Average Convergence Divergence (MACD) lines are converging, increasing the likelihood of a bullish crossover. If the MACD fails to confirm a bullish crossover, it suggests bearish momentum remains intact, increasing the risk of a further correction.
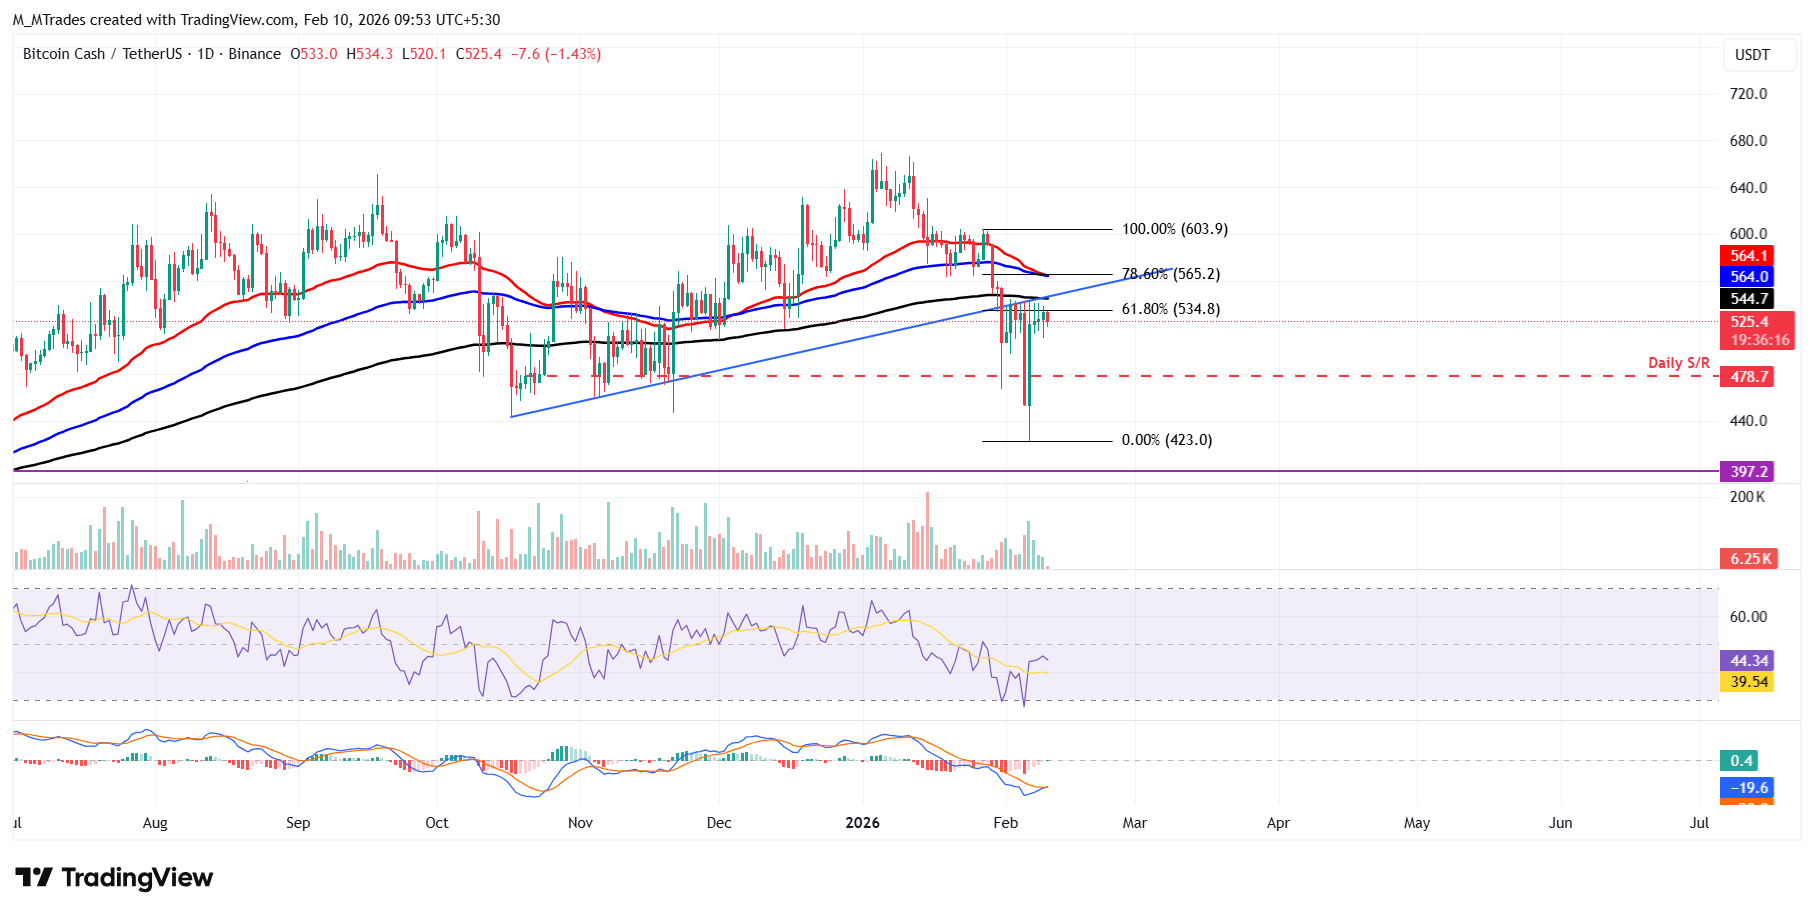
However, if BCH rallies and closes above the 200-day EMA at $544.70 on a daily basis, it could extend the advance toward the immediate resistance at $564.00, its 100-day EMA.

超過一百萬用戶依賴 FXStreet 獲取即時市場數據、圖表工具、專家洞見與外匯新聞。其全面的經濟日曆與教育網路研討會協助交易者保持資訊領先、做出審慎決策。FXStreet 擁有約 60 人的團隊,分布於巴塞隆納總部及全球各地。
閱讀更多


