


From the euphoria of “$200,000 is coming” in mid-year to the fear and doubt at year-end, what exactly happened? At its core, the question is: when Wall Street’s massive capital, sovereign-level regulatory will, and crypto’s native high-leverage wildness collide, what new form does this market take? The answer may lie in subtle shifts in on-chain data, in the piercing sound of liquidation alerts, and in the slow movement of “fossil” Bitcoins that have been held for more than a decade.
Reviewing Bitcoin’s 2025 Price Path
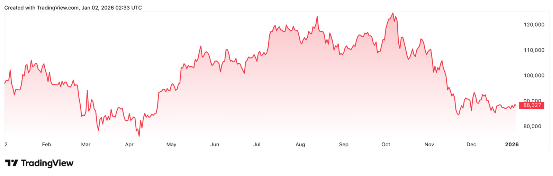
Bitcoin’s dramatic turning point began on October 6, when, driven by expectations of a “U.S. national strategic Bitcoin reserve” and continued inflows into spot ETFs, the price soared to an all-time high around $126,000. At that moment, the market was intoxicated by the story of “digital gold” being embraced by major nations, and total market cap briefly exceeded $4 trillion.
However, as the fourth quarter began, market logic flipped 180 degrees and Bitcoin went into a prolonged slide. The surface-level trigger was a shift in the macro backdrop—hawkish comments from the Federal Reserve on inflation drained liquidity from global risk assets. But the real fatal blow came from the fragility of the market’s internal structure.
Around October 11, a wave of large-scale liquidations, triggered by geopolitical tensions, swept through the market. In just a few days, over $19 billion in long positions were forcibly closed. This was not an isolated event, but rather a concentrated eruption of the high-risk state that had persisted all year in the derivatives market.
According to CoinGlass data, total forced liquidations in the crypto derivatives market reached $150 billion in 2025. This “liquidity chokehold” sent Bitcoin into a cliff-like decline. By late December, the price had fallen nearly 30% from its peak, hovering around $89,000, ultimately posting a full-year loss of about 4%. ETF flows, which had once fueled the rally, flipped to net outflows in the bear phase, showing that even institutional capital is highly trend-dependent in its “loyalty.”
Digging Deeper: What Really Drove the Crash?
The price collapse is only the surface. Beneath the waterline, structural changes in Bitcoin ownership and trading behavior are what truly defined 2025.
1. Global Liquidity Tightening
At the start of the year, the narrative of “digital gold” and “inflation hedge” peaked amid discussion of a potential U.S. strategic Bitcoin reserve. But the full-year price performance—especially the sharp sell-off during global liquidity tightening (even as the Fed had already begun cutting rates)—exposed Bitcoin’s more fundamental nature: a high-beta risk asset.
Its price is highly correlated with global liquidity (M2) expansion. Bitcoin’s excess returns come from a leveraged reactions to liquidity abundance. When markets anticipate a liquidity squeeze, Bitcoin tends to be among the first assets to be sold.
2. The Rise of Stablecoins and Tokenized Real-World Assets (RWA)
At the same time, a more disruptive trend is emerging: stablecoins and the tokenization of real-world assets (RWA) are beginning to replace pure coin-price speculation as the true bridge between crypto and mainstream finance.
In 2025, total stablecoin market cap surpassed $230 billion, with on-chain settlement volume comparable to payment giants like Visa. The RWA sector also ballooned from $7 billion to $24 billion. This signals a deep shift in the core crypto narrative—from “creating new assets” to “rebuilding old finance.”
3. A Quiet but Profound Shift in Holder Structure
On-chain data reveals a key trend: the behavior of “whales” and “retail” diverged in a historic way. According to Santiment data, since July 2025, the number of wallets holding less than 0.1 BTC has increased by about 3.3%, while wallets holding between 10 and 10,000 BTC have grown by only 0.36%.
This clearly paints a picture of “retail buying the dip while large holders sell into strength.” More importantly, a large number of “ancient whales”—entities that had held Bitcoin for more than ten years—began to wake up near price highs and started selling.
Research from K33 shows that since early 2024, more than 20% of BTC that had not moved for over two years has been transferred, implying large-scale profit-taking by early investors. This silent re-distribution of coins means that Bitcoin’s wealth distribution and cost basis are being fundamentally reshaped.
4. Derivatives Take Over Price Discovery, Volatility Logic Changes
In 2025, Bitcoin’s price discovery mechanism fully shifted to derivatives. Total annual derivatives trading volume reached an astonishing $857 trillion, with average daily volume of $264.5 billion. Open interest in futures and perpetual contracts now has a much greater impact on short-term prices than actual spot buying and selling.
This leads to a new phenomenon: price swings are often driven not by genuine asset allocation demand, but by cascading liquidations. October’s crash is a textbook example: elevated long leverage meant that a modest pullback triggered a chain of forced liquidations, creating a “drop – liquidation – further drop” death spiral.
The market has become extremely sensitive to leverage ratios and funding rates. The very nature of volatility has been deeply altered.
5. Maturing OTC and Institutional Channels
In contrast to the bloodshed on public exchanges, a quieter “institutional-grade” market has been maturing in the background. Whether it’s multi-billion-dollar sales by ancient whales or the U.S. government’s disposal of seized Bitcoin, more and more is being handled through OTC desks run by firms such as Galaxy Digital.
These flows don’t immediately impact public order books, but they do create real supply pressure. At the same time, Bitcoin continues to flow off exchanges into cold wallets and custodied addresses. In 2025, total exchange balances stepped down, with net outflows around 15%.
This means the pool of coins that can be dumped instantly is shrinking, making the market “thinner.” When a large sell event does occur, volatility is amplified dramatically.
As we move into 2026, investors need to understand these deep structural shifts—tracking on-chain distribution, monitoring derivatives leverage, and recognizing Bitcoin’s nature as a high-beta risk asset—may be more important than simply trying to call the price top.

Bitcoin in 2026: A Deeply Divided Market
Looking ahead to 2026, Wall Street and crypto insiders have not converged on a single script. Bullish and bearish camps are sharply divided.
The Bull Case: Institutionalization Is Irreversible
For the bulls, the logic remains clear: institutionalization is a one-way street. Despite setbacks, the trend of mainstream financial institutions embracing crypto is seen as inevitable.
Analysts at JPMorgan, using a volatility-adjusted model, estimate Bitcoin’s theoretical fair value could reach around $170,000. BlackRock-affiliated research arm Galaxy Research believes there is still a reasonable chance that Bitcoin will set new all-time highs in 2026.
Many forecasts anchor target ranges between $150,000 and $250,000. For example:
Blockchain consultant Li Sicong expects that as Wall Street accelerates its “on-chain” transformation, Bitcoin could challenge $150,000.
MicroStrategy founder Michael Saylor’s projected range is $143,000–$170,000.
The most aggressive of all, Wall Street strategist Tom Lee, has floated a target as high as $250,000.
Another key bullish card is global liquidity. BitMEX co-founder Arthur Hayes predicts that continued liquidity injections by the Fed could push Bitcoin toward $200,000 in 2026 [citation]. This view argues that in an “ultra-speculative capitalist era,” macro liquidity—rather than intrinsic value—will be the primary driver of asset prices.
The Bear Case: A Deep Reset to $10,000?
The bears, however, have equally compelling arguments focused on three main points:
Cycle and Technical Structures Are Breaking Down
Some analysts argue that Bitcoin’s historical pattern of “peaking roughly 18 months after halving” may be playing out, and that prices have already entered a downtrend. Veteran trader Peter Brandt warns that Bitcoin’s previous parabolic structure has been broken, and that, based on historical “exponential decay” patterns, the asset could face a deep retracement from its highs.Intensifying Competition and Stalling Demand
Bloomberg strategist Mike McGlone has put forward one of the most shocking forecasts—that Bitcoin could crash 90% in 2026, falling as low as $10,000. His core logic is that Bitcoin now faces competition from millions of other digital assets, and that its demand growth may already be stagnating.Crypto analytics firm CryptoQuant also warns that weak demand could first drag Bitcoin down to $70,000 and potentially even $56,000.
The “Post-Inflation Deflation” Macro Risk
McGlone and others further propose the notion of “post-inflation deflation,” where major economies, after experiencing an inflationary cycle, may swing back toward tight policy. This would strip away the liquidity foundation for all risk assets—including Bitcoin.
Conclusion: From Wild Growth to a Complex New Chapter
In short, 2026 will not be a year where investors can simply bet on “up or down.” Instead, it will be a year that tests patience, depth of research, and the ability to understand complex market structure.
Bitcoin is transitioning from a phase of wild, explosive growth into a more intricate chapter—one that demands careful cultivation, precise risk management, and a clear understanding of where it truly sits in the broader global financial system.


