
Bitcoin Weekly Forecast: BTC slips under $90K, no santa rally in sight
作者 Ekta Mourya
發布日期: 6 Dec 2025 | 修改日期: 6 Dec 2025


熱門文章

Bitcoin traders are counting on a year-end rally, awaiting a return above the $100,000 milestone. Bitcoin-based investment products are struggling with declining inflows and weaker institutional demand, relative to the beginning of the year.
- Bitcoin hover around $90,000, awaiting catalysts for recovery.
- Institutions pull over $250 million from Spot Bitcoin ETFs in December.
- Bitcoin dominance drops under 60%, year-end rally may be delayed.
Bitcoin traders are counting on a year-end rally, awaiting a return above the $100,000 milestone. Bitcoin-based investment products are struggling with declining inflows and weaker institutional demand, relative to the beginning of the year.
As institutional inflows dry up, the market is clear that despite the expectations of rate-cuts and other positive regulatory developments, Bitcoin’s rally is likely close to the end. In this analysis we identify three key catalysts that could drive BTC price higher and identify key levels to watch next week.
Bitcoin’s top three catalysts
Bitcoin holders are watching these three factors closely to identify the next spike in BTC price: Institutional capital inflows to Spot Bitcoin ETFs in the US, Bitcoin dominance and net profit/loss realized by traders.
Institutional capital inflow
Bitcoin’s bull run was likely catalyzed by large institutional capital inflows to ETFs in the US. Giants like Strategy (formerly MicroStrategy) added Bitcoin to their balance sheets, inspiring the playbook among other corporate giants in the US. Institutional demand acted as a key catalyst driving Bitcoin to $100,000 and its all-time high above $126,000. Naturally, as the key players leave the market, institutional demand dries up and Bitcoin struggles to hold above key support at $90,000.

The $100,000 milestone was a support for Bitcoin for several months, the level has been flipped to a resistance and a decisive close above this level could signal a return of the bull market.
Data from Farside shows Bitcoin ETF flows. Nearly $250 million was pulled from Bitcoin ETFs in December.
As capital inflows reduce, other metrics that track Bitcoin’s relevance and demand, like Bitcoin dominance, note a decline.
Bitcoin dominance shrinks, end of the bull run?
Bitcoin dominance measures the relevance of BTC, against other tokens, altcoins in the market. As Bitcoin market capitalization reduces, down to $1.79 trillion on December 6, BTC dominance is in a decline. At the time of writing, Bitcoin dominance is below the 60% mark, 59.31%.
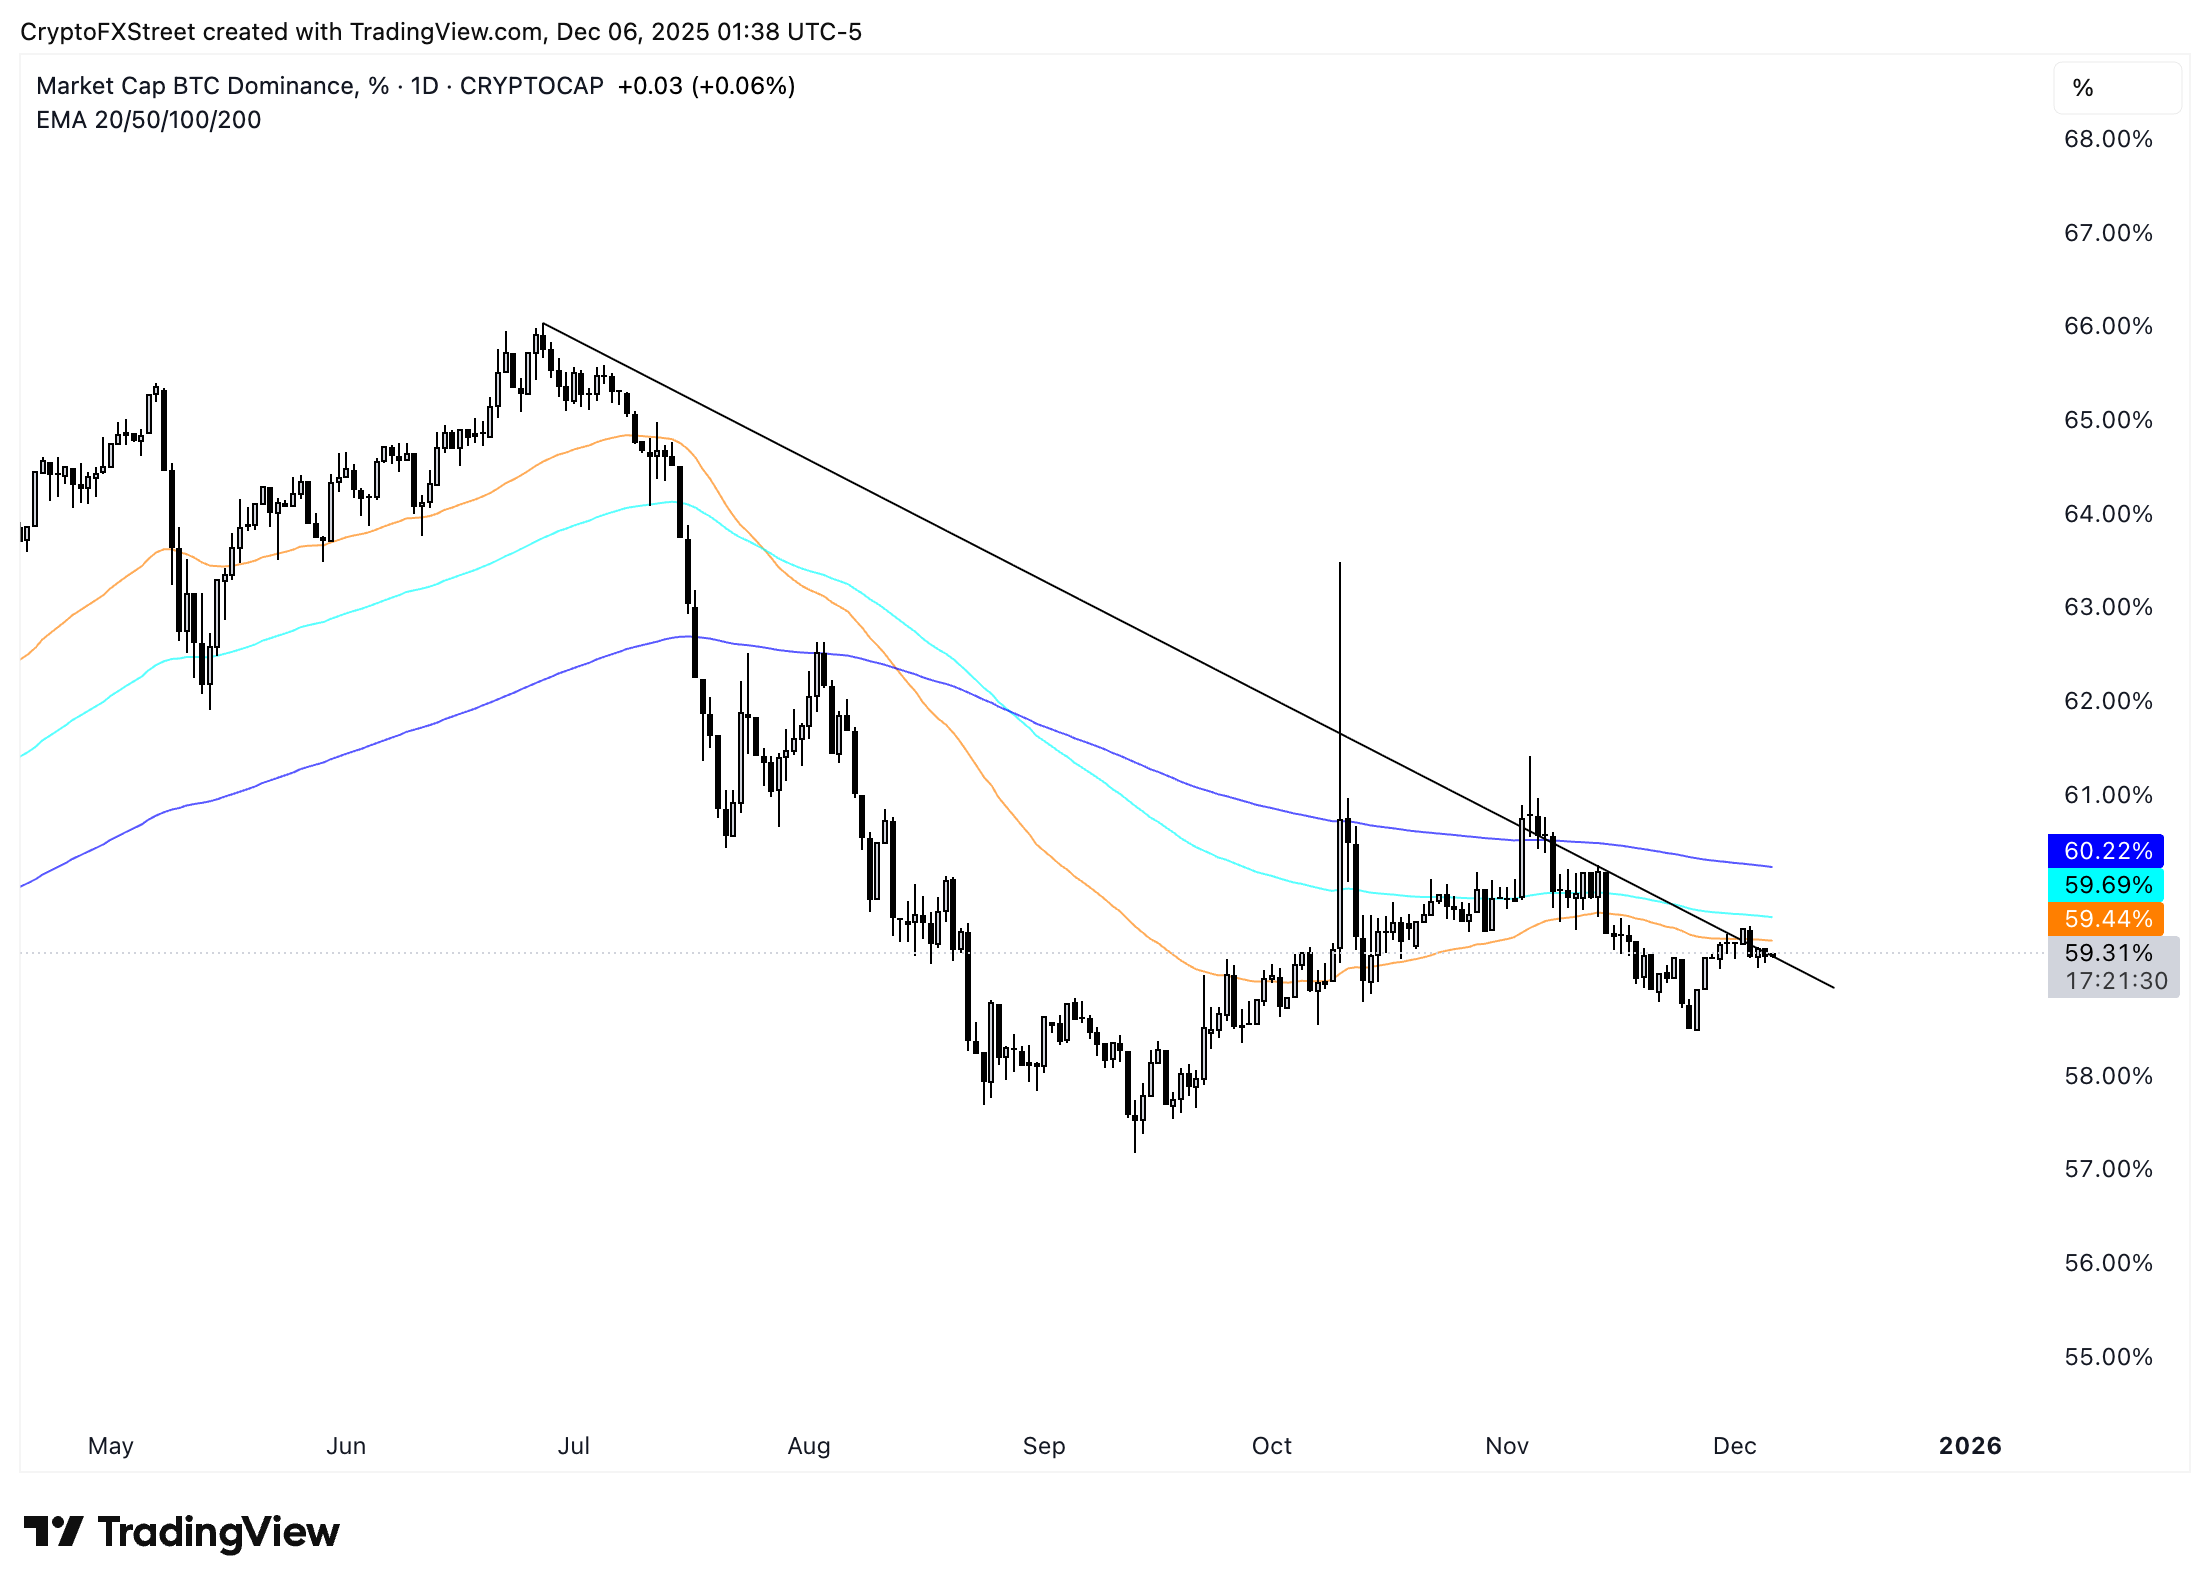
Dominance hovers above 59%, just as it did for the most part in the last two months. An increase in dominance could act as a catalyst for Bitcoin’s recovery.
Typically, decline in Bitcoin dominance signals the end of the bull run and it is followed by capital rotation into altcoins and other tokens in the market.
Traders sell Bitcoin at a loss
If there was one metric to help determine the state of the market, it would be the network realized profit/loss. The on-chain metric on Santiment tracks the net profit or loss realized by traders on a given day. Several days in November and December, the metric shows traders realizing losses, a sign of capitulation or increased selling pressure on Bitcoin.
Large negative spikes in the metric signal a change in Bitcoin price trend. After consistent profit-taking, traders are now realizing losses on their Bitcoin holdings, they likely anticipate further decline in BTC price.
 [12-1765005475835-1765005475835.21.58, 06 Dec, 2025].png)
If a large volume of loss taking continues it could negatively impact the price in the weeks to come.
Besides the three catalysts, macroeconomic developments, rate-cut expectations influence Bitcoin price.
Bitcoin price analysis: Key levels to watch
Bitcoin is hovering above support at $83,828, a key level on the price chart. Two key resistance levels are R1 and R2 at $91,361, and $98,019 respectively. The $100,000 milestone is another key resistance for Bitcoin.
Bitcoin has been consolidating for over two weeks and it remains to be seen whether there will be a recovery or further decline. The two key momentum indicators on the daily BTC/USDT price chart show positive underlying momentum in Bitcoin price trend.
RSI reads 43, climbing towards neutral and MACD shows consecutive green histogram bars.
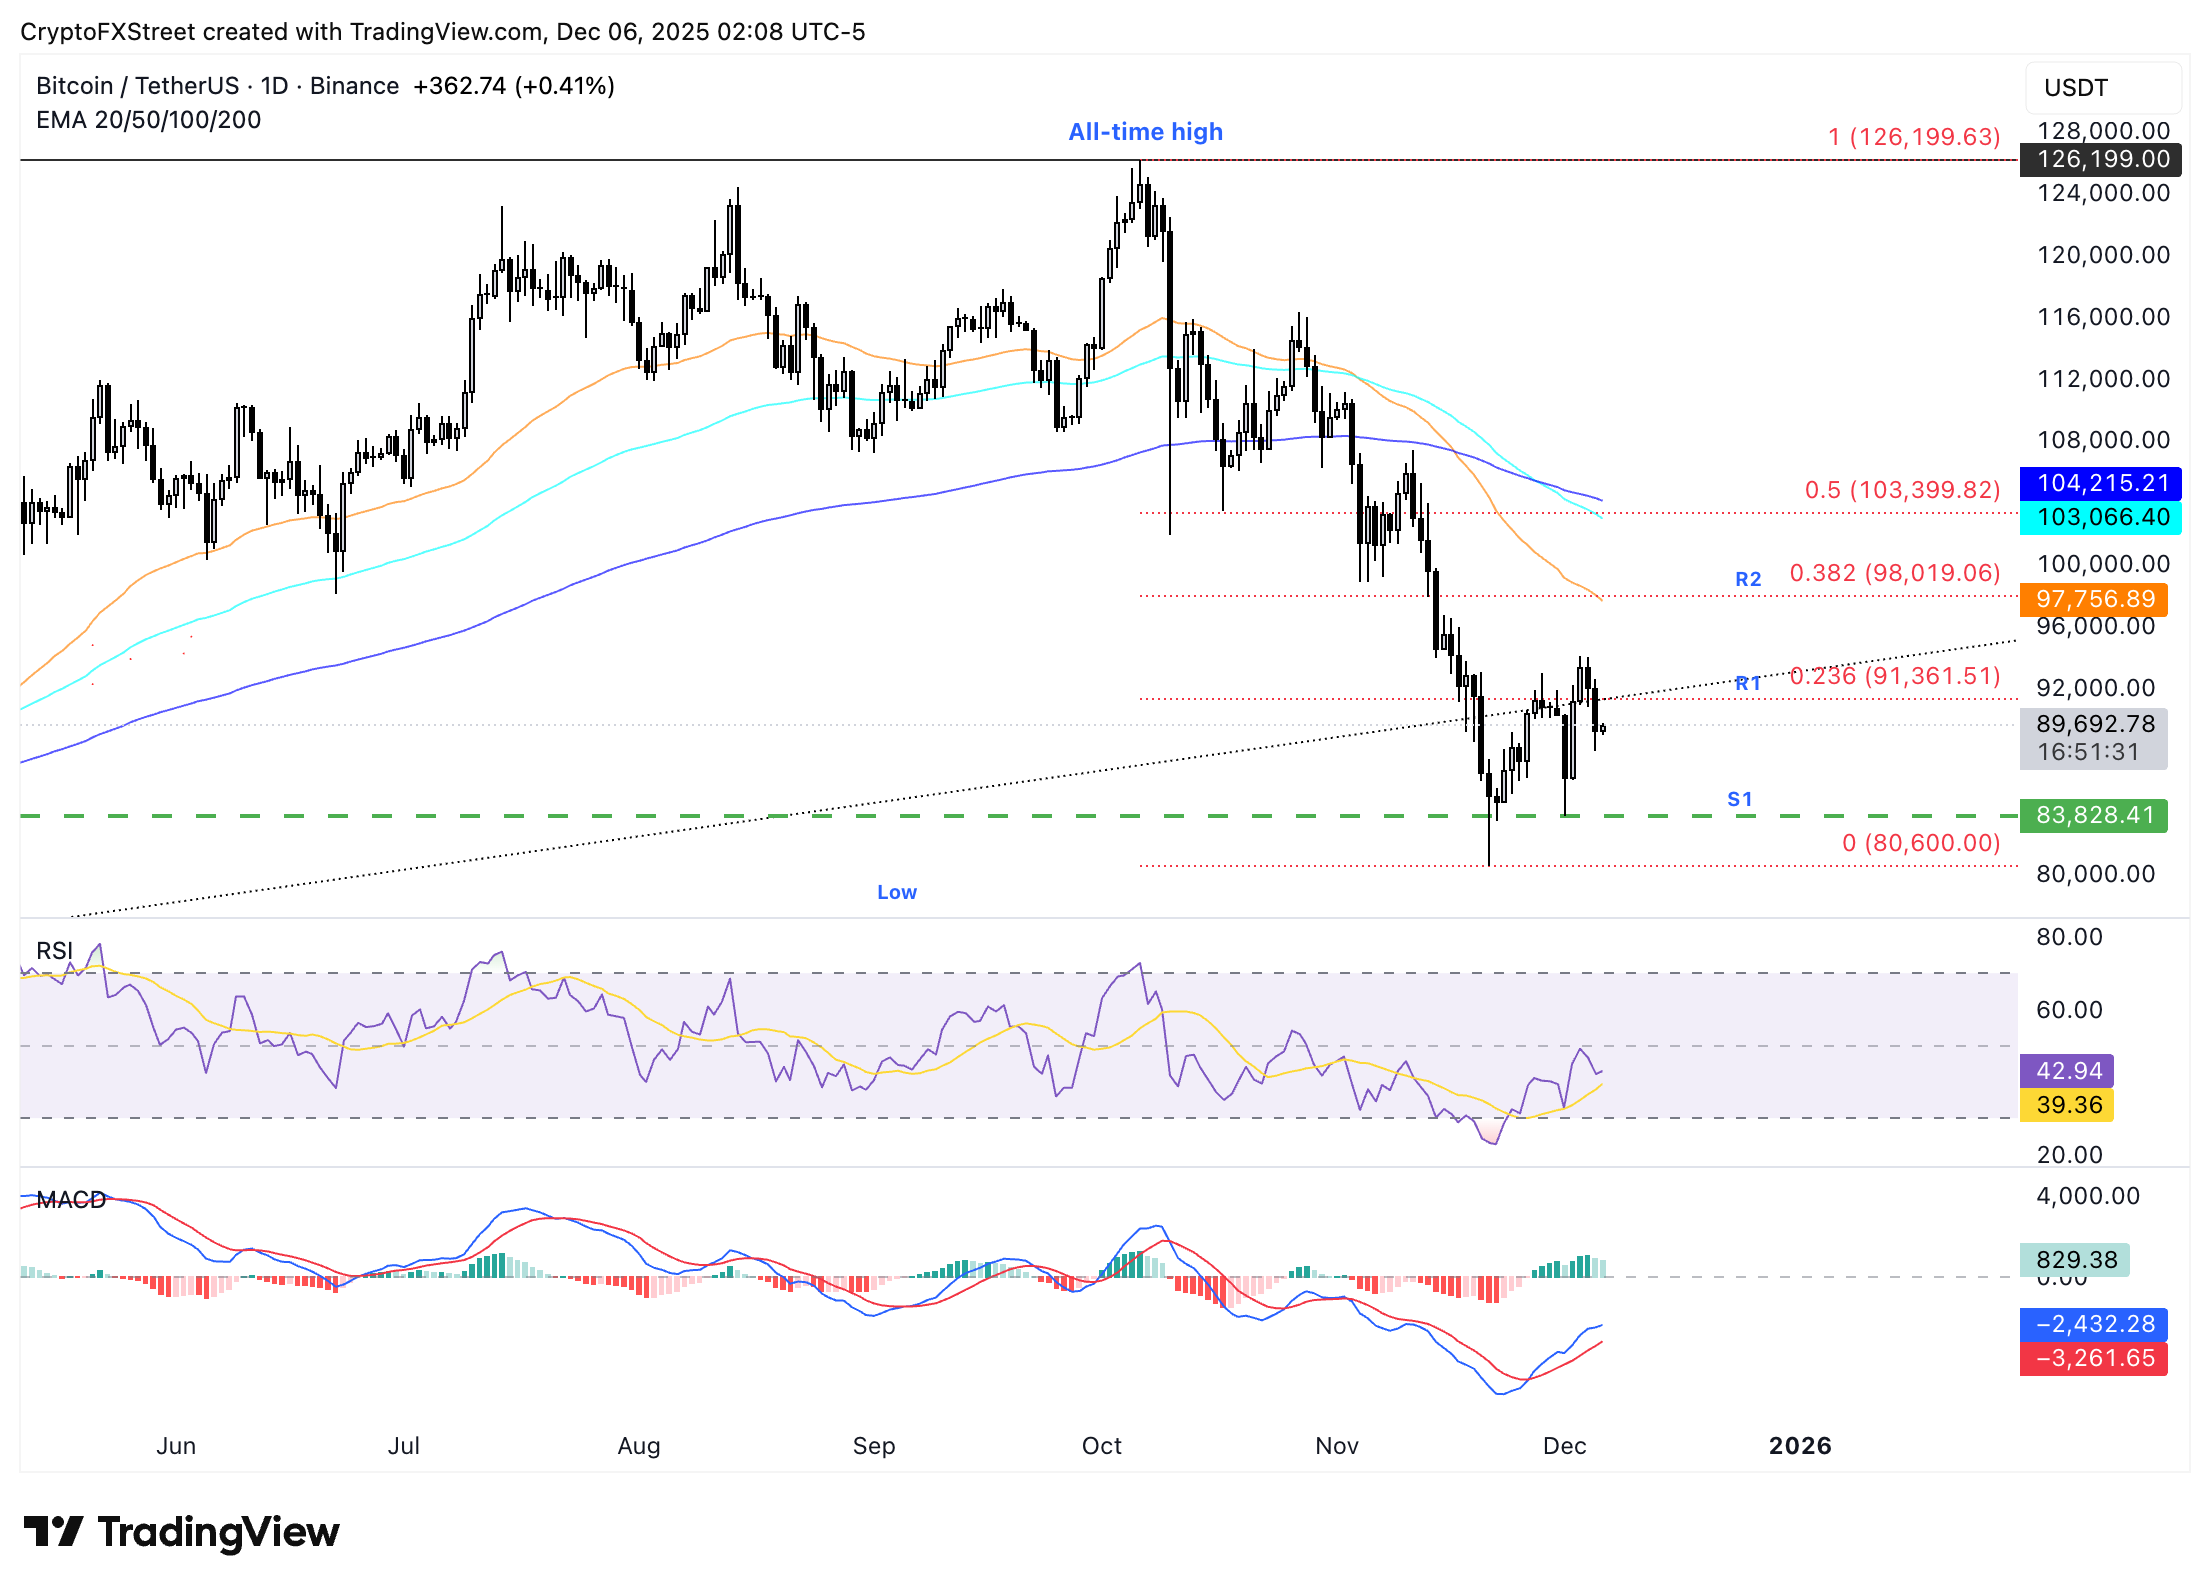
The three Exponential Moving Averages, at the 20,50 and 100 level come into play when Bitcoin sees a daily candlestick close above R2. A correction could send Bitcoin to test the $83,000 support.
Bitcoin, altcoins, stablecoins FAQs
Bitcoin is the largest cryptocurrency by market capitalization, a virtual currency designed to serve as money. This form of payment cannot be controlled by any one person, group, or entity, which eliminates the need for third-party participation during financial transactions.
Altcoins are any cryptocurrency apart from Bitcoin, but some also regard Ethereum as a non-altcoin because it is from these two cryptocurrencies that forking happens. If this is true, then Litecoin is the first altcoin, forked from the Bitcoin protocol and, therefore, an “improved” version of it.
Stablecoins are cryptocurrencies designed to have a stable price, with their value backed by a reserve of the asset it represents. To achieve this, the value of any one stablecoin is pegged to a commodity or financial instrument, such as the US Dollar (USD), with its supply regulated by an algorithm or demand. The main goal of stablecoins is to provide an on/off-ramp for investors willing to trade and invest in cryptocurrencies. Stablecoins also allow investors to store value since cryptocurrencies, in general, are subject to volatility.
Bitcoin dominance is the ratio of Bitcoin's market capitalization to the total market capitalization of all cryptocurrencies combined. It provides a clear picture of Bitcoin’s interest among investors. A high BTC dominance typically happens before and during a bull run, in which investors resort to investing in relatively stable and high market capitalization cryptocurrency like Bitcoin. A drop in BTC dominance usually means that investors are moving their capital and/or profits to altcoins in a quest for higher returns, which usually triggers an explosion of altcoin rallies.

超過一百萬用戶依賴 FXStreet 獲取即時市場數據、圖表工具、專家洞見與外匯新聞。其全面的經濟日曆與教育網路研討會協助交易者保持資訊領先、做出審慎決策。FXStreet 擁有約 60 人的團隊,分布於巴塞隆納總部及全球各地。
閱讀更多


