
Crypto Today: Bitcoin and Ethereum aim for recovery, XRP holds key support
作者 John Isige
發布日期: 12 Dec 2025 | 修改日期: 12 Dec 2025


熱門文章

Bitcoin (BTC) is trading above $92,000 at the time of writing on Friday, as volatility across the cryptocurrency market cools following the Federal Reserve’s (Fed) hawkish interest rate cut.
- Bitcoin steadies above $92,000 as the dust from the Fed decision settles amid continuing macroeconomic uncertainty.
- Ethereum stabilizes above $3,200, supported by uptrending momentum indicators.
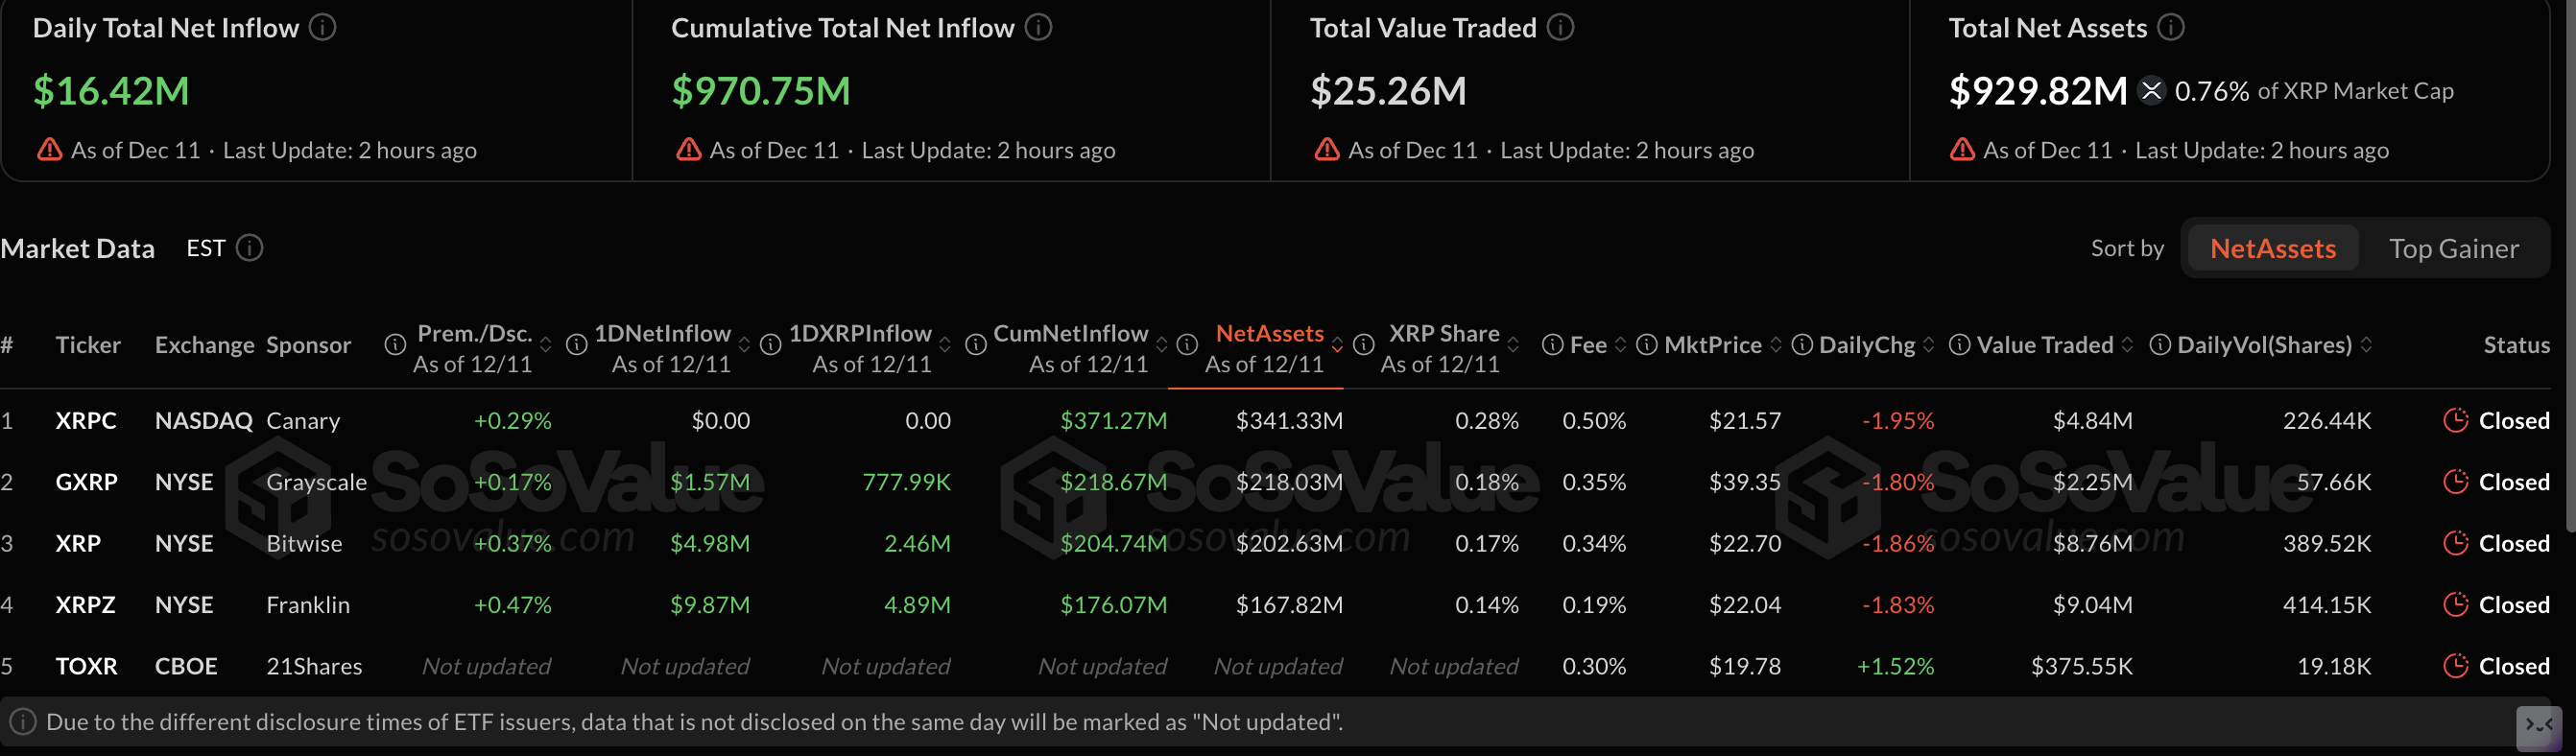
- XRP remains above $2.00 as total cumulative ETF inflows advance toward $1 billion milestone.
Bitcoin (BTC) is trading above $92,000 at the time of writing on Friday, as volatility across the cryptocurrency market cools following the Federal Reserve’s (Fed) hawkish interest rate cut.
Ethereum (ETH) is paring losses above $3,200 as momentum indicators signal a plausible recovery heading into the weekend. Ripple (XRP), on the other hand, is struggling to hold above the pivotal $2.00 support level amid increasing headwinds.
XRP ETFs extend inflows, as BTC and ETH bleed
XRP spot Exchange Traded Funds (ETFs) extended their inflow streak for the 19th consecutive day, with approximately $16 million deposited on Thursday. According to SoSoValue data, the cumulative inflow volume currently stands at $971 million and is quickly approaching the $1 billion milestone. In total, XRP ETFs account for net assets of $930 million.
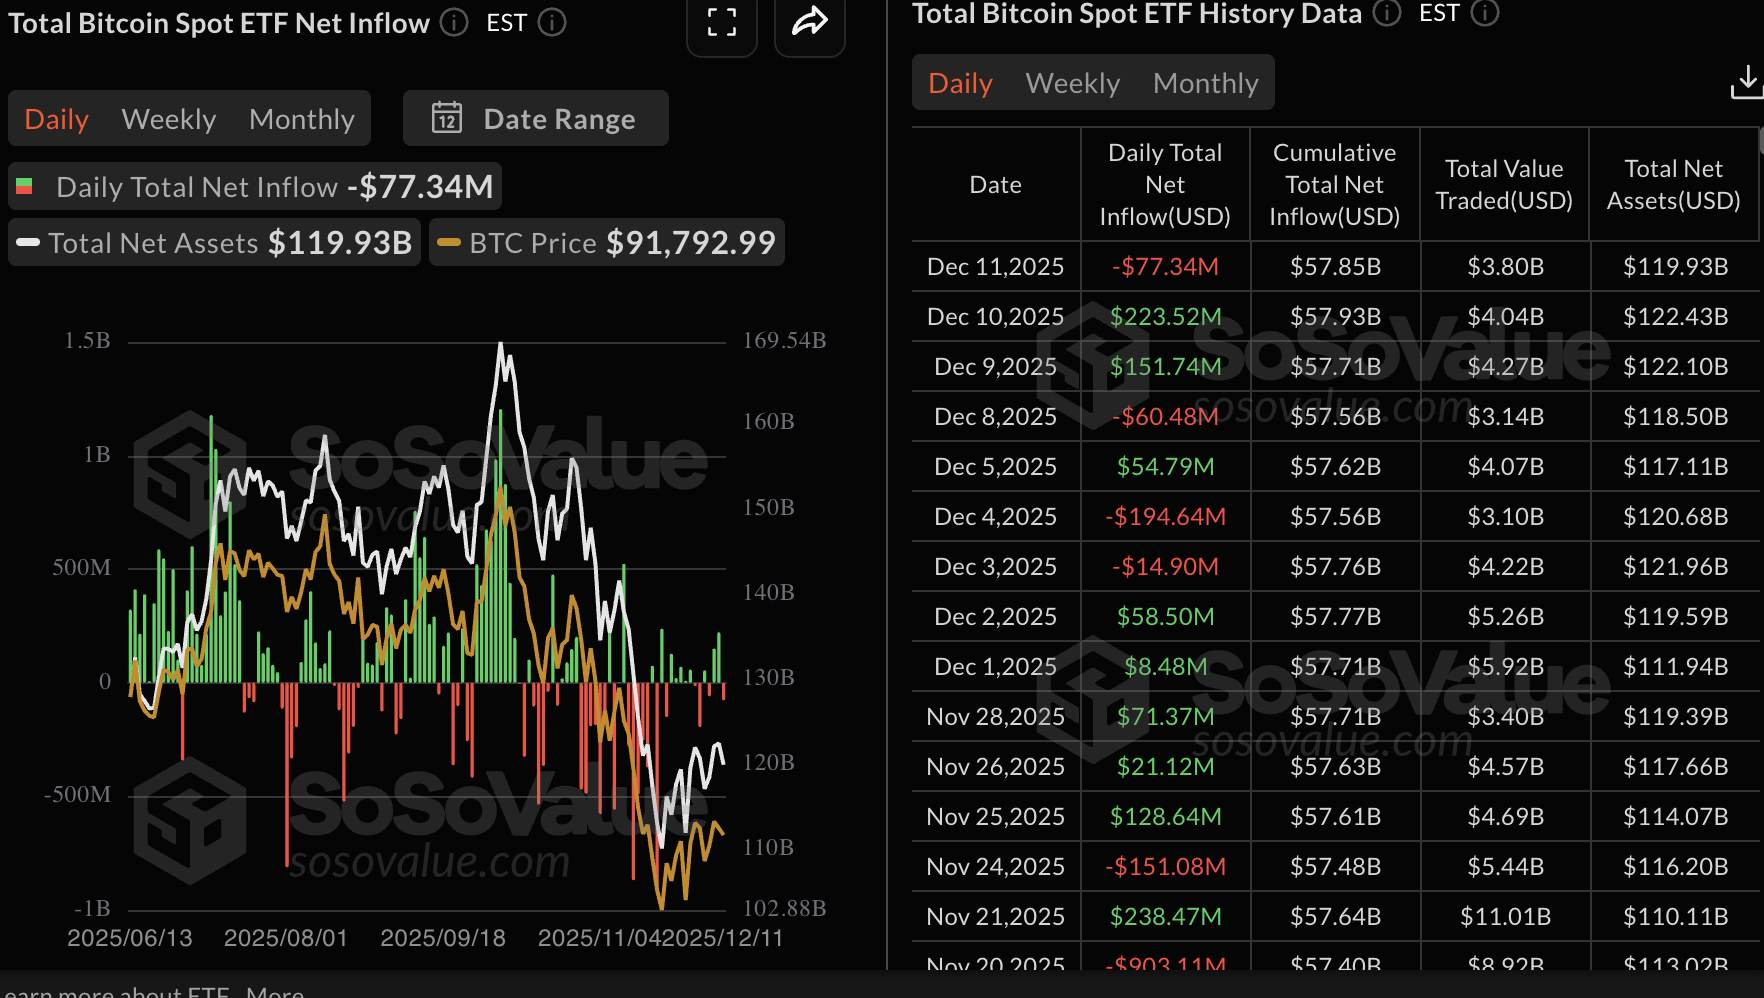
Bitcoin spot ETFs, unlike XRP, resumed outflows on Thursday, with approximately $77 million withdrawn. Fidelity’s FBTC performed the worst, with outflows of $104 million, followed by VanEck’s HOLD with $19 million. BlackRock’s IBIT and Bitwise’s BITB recorded inflows of $77 million and $8 million, respectively. The cumulative inflow volume stands at $57.85 billion, and net assets are nearly $120 billion.
Ethereum spot ETFs listed in the United States (US) posted approximately $42 million in outflows on Thursday, breaking three days of consecutive inflows. 21Shares’ TETH was the only product in the green with inflows of $2 million, while Grayscale’s ETHA saw the largest outflows of $31 million. The cumulative inflow volume stands at $13.11 billion, and net assets are $20.31 billion.
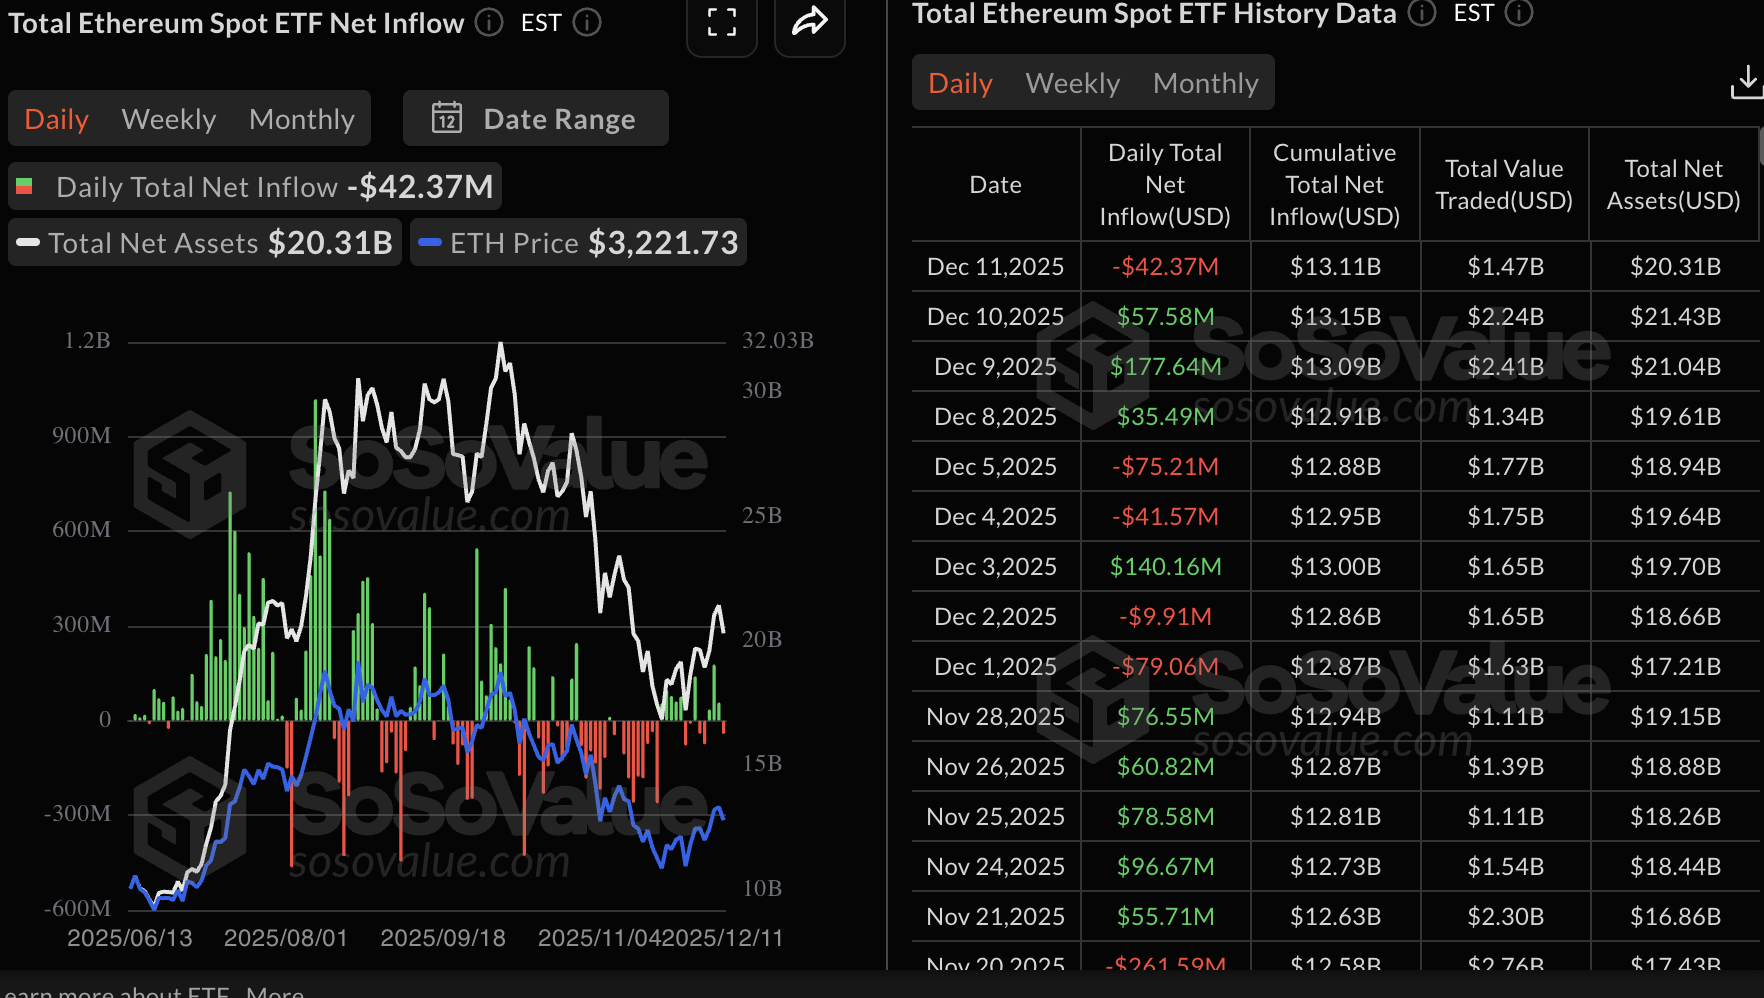
Chart of the day: Bitcoin recovery slows as bulls hold support
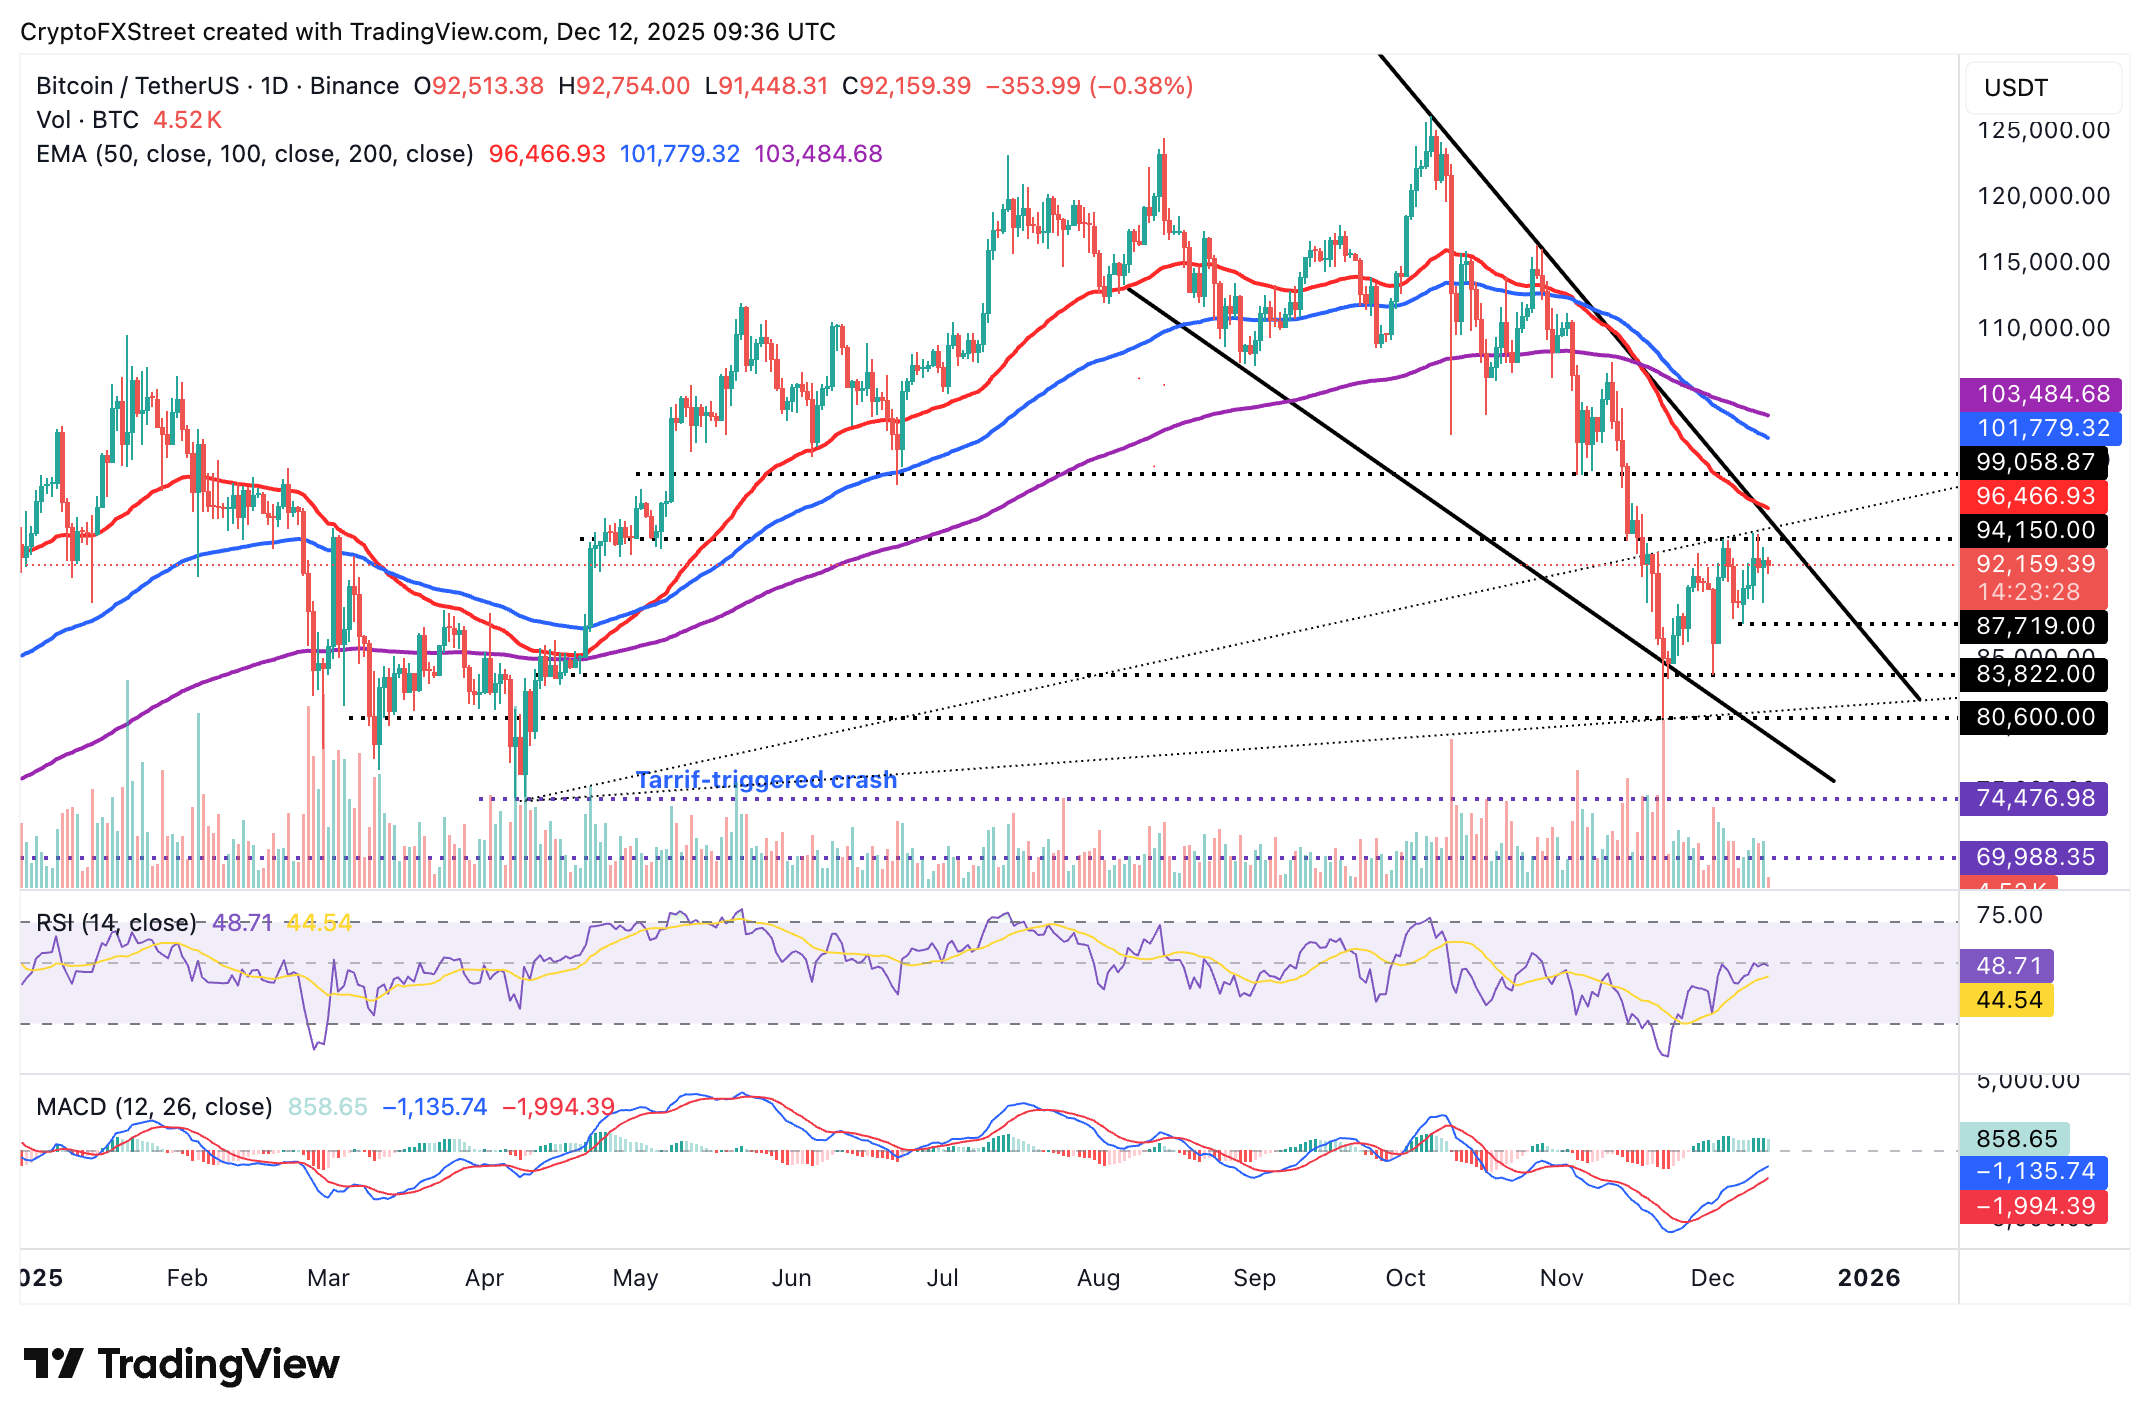
Bitcoin is trading above $92,000 at the time of writing on Friday, supported by positive momentum indicators. The Moving Average Convergence Divergence (MACD) indicator edges higher, reinforcing a short-term bullish outlook on the daily chart. As long as the green histogram bars keep expanding above the mean line, BTC would lean bullishly as more investors increase their risk exposure.
A break above the initial barrier at $94,150 could pave the way for an extended recovery to the 50-day Exponential Moving Average (EMA) at $96,466. Bulls should flip this level into support to maintain the bullish outlook toward $100,000.
However, the Relative Strength Index (RSI) has stalled below the 50 midline, suggesting a weakening of bullish momentum. A decline in the RSI would extend bearish momentum and increase the odds of Bitcoin sliding below $90,000.
Altcoins update: Ethereum, XRP hold below key moving averages
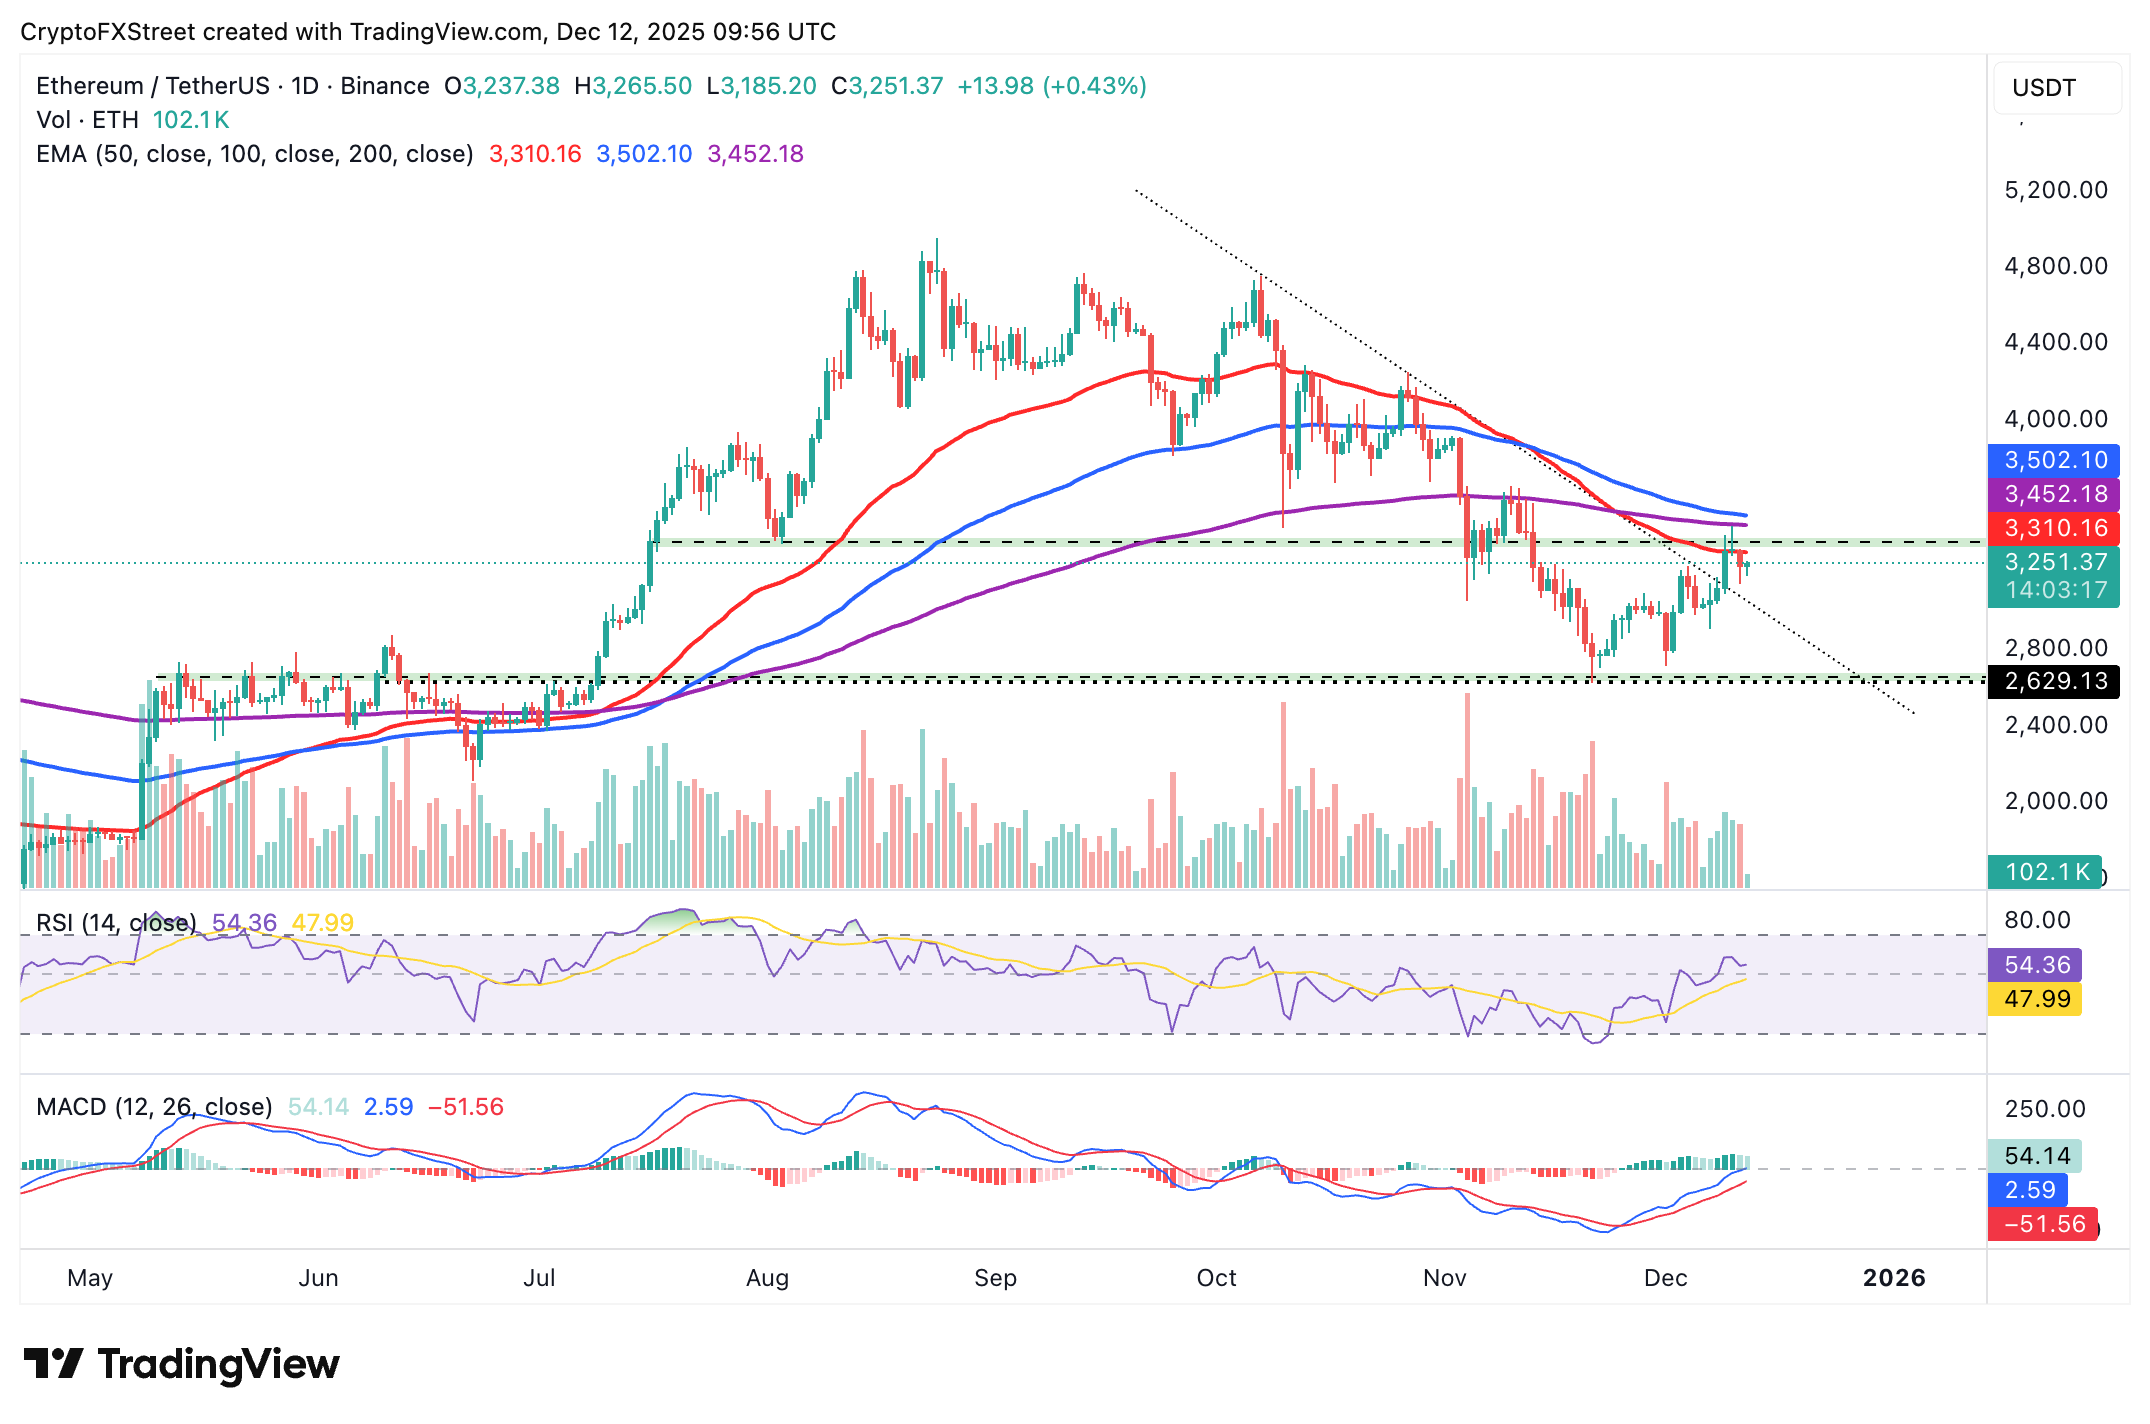
Ethereum is hovering above $3,200 at the time of writing on Friday, but also sits below the 50-day EMA at $3,310, the 200-day EMA at $3,452 and the 200-day EMA at $3,502, which uphold an overall bearish bias.
The MACD indicator on the daily chart is almost entering bullish territory, supported by a buy signal since November 26. The green histogram bars expanding above the mean line underscore a potentially steady upward momentum.
The RSI at 54 in the bullish region backs a short-term bullish outlook. However, a move toward overbought territory is required to sustain momentum.
A daily close above the 50-day EMA at $3,310 would pave the way for recovery past the 200-day EMA at $3,452 and the 100-day EMA at $3,502. If the 50-day EMA caps the rebound, chances of an extended correction toward $3,000 would increase.
XRP, on the other hand, is hovering above its short-term support at $2.00, but remains below the 50-day EMA at $2.24, the 100-day EMA at $2.40, and the 200-day EMA at $2.46, which slope lower and maintain an overall bearish alignment.
The MACD on the daily chart sits below the zero line in the bearish region, with the blue MACD line marginally above the red signal line. Hardly positive and contracting green histogram bars indicate neutral momentum. The RSI at 42 leans bearish, suggesting rallies could stay limited.
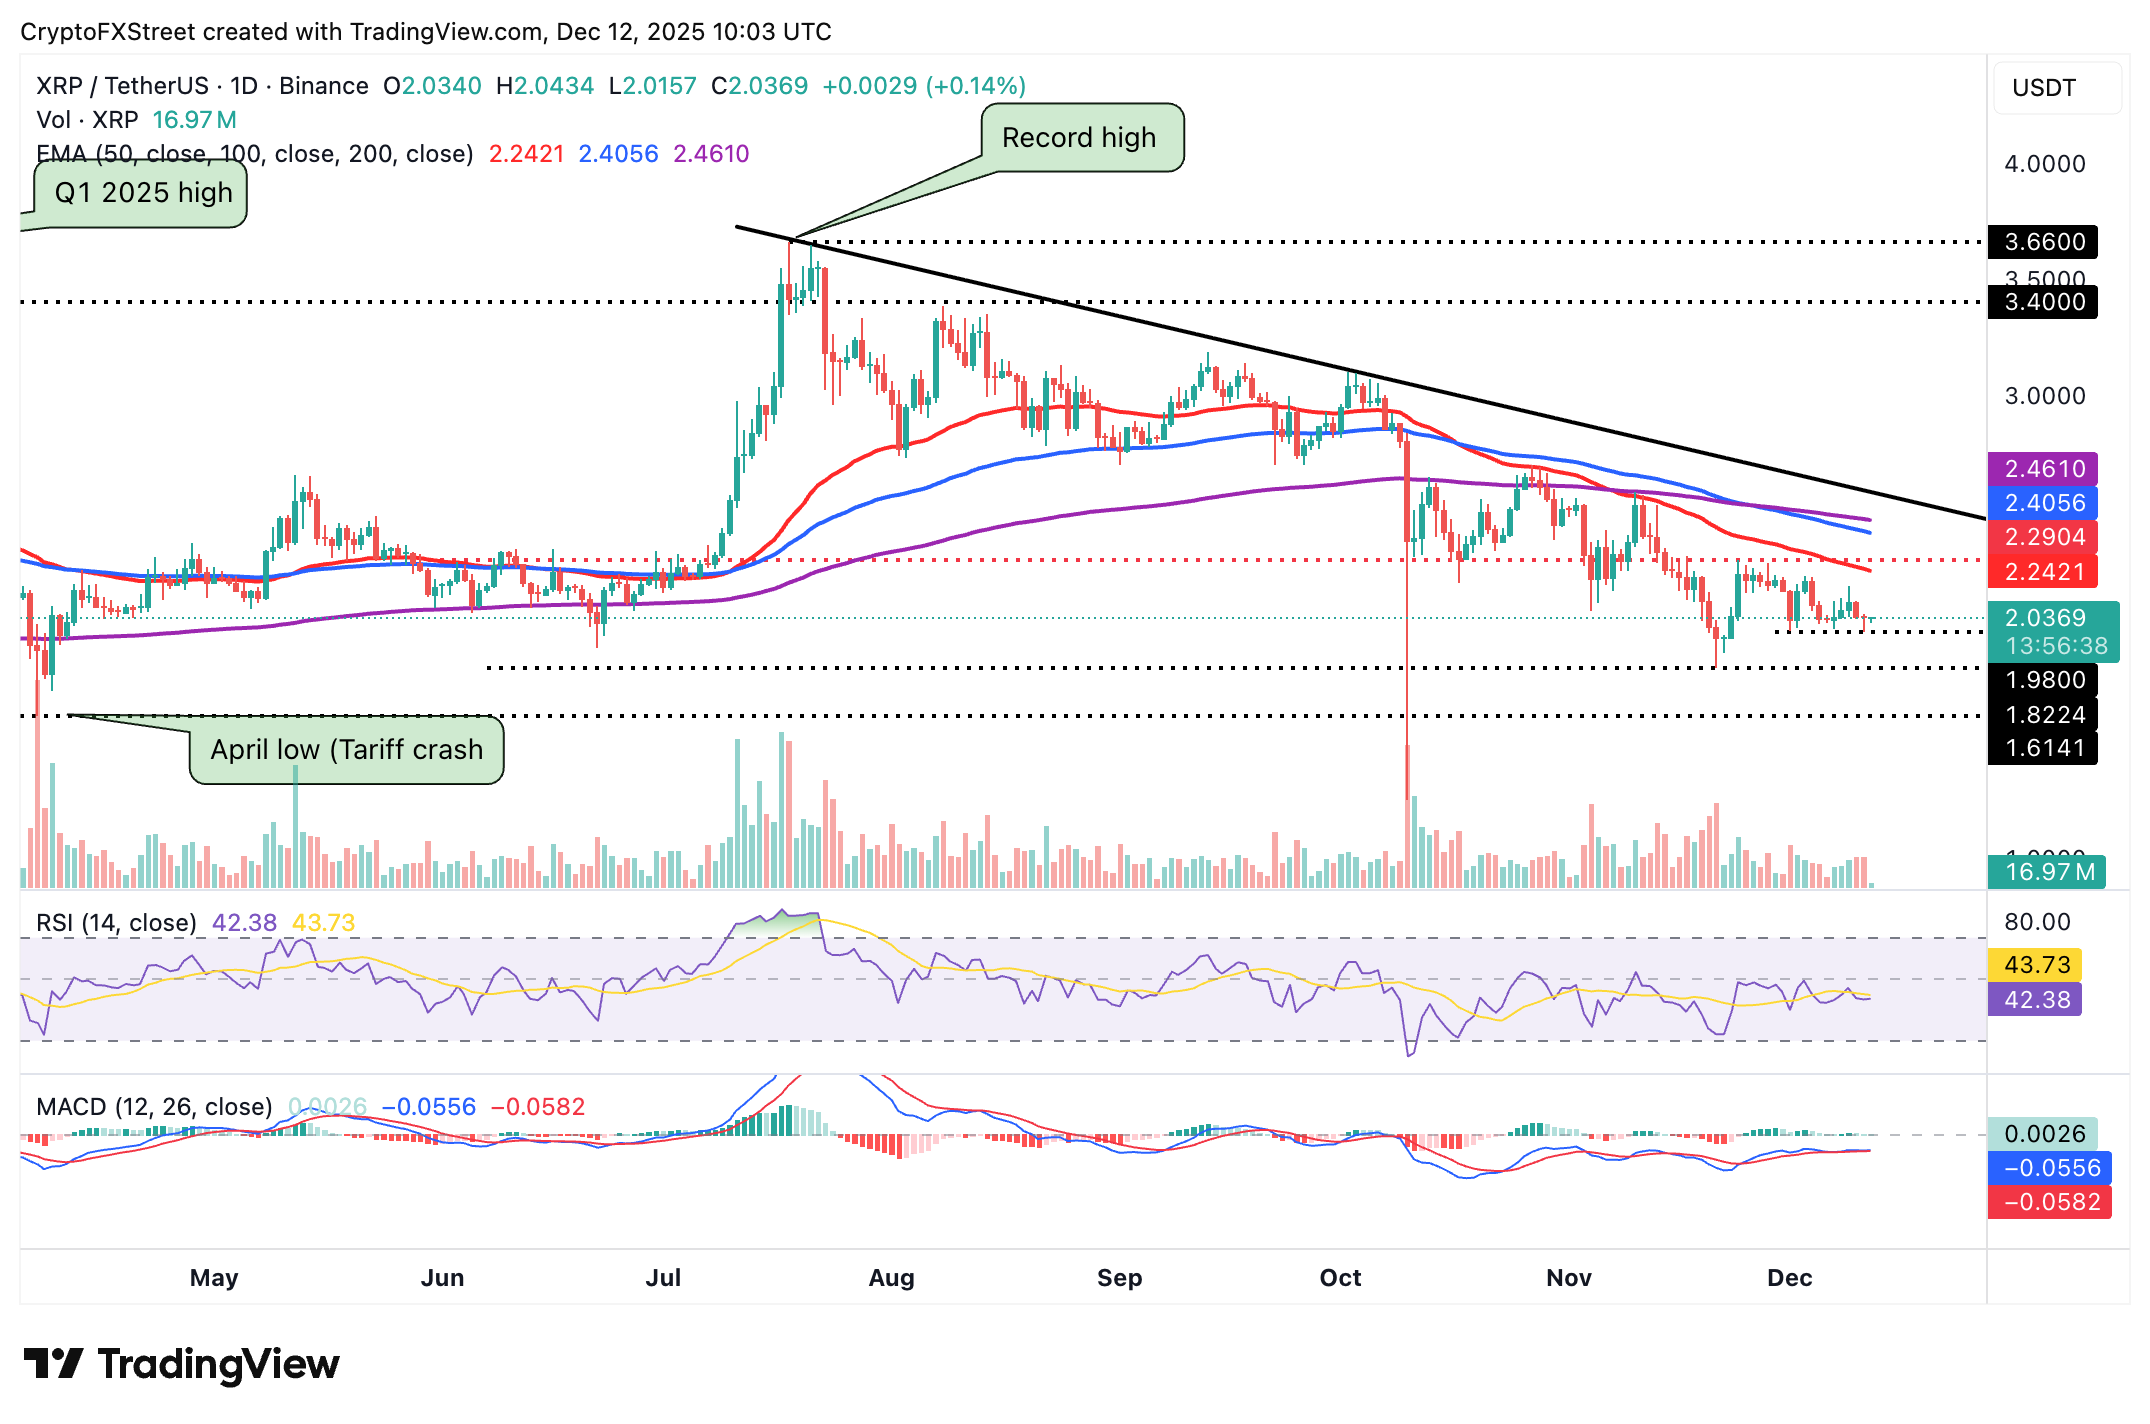
Still, a daily close above the hurdle $2.24 (50-day EMA) could ease pressure and open the path toward the resistance band at $2.40-$2.46. Failure to reclaim the first barrier ($2.24) would keep sellers in control beneath the trend-line cap.
Crypto ETF FAQs
An Exchange-Traded Fund (ETF) is an investment vehicle or an index that tracks the price of an underlying asset. ETFs can not only track a single asset, but a group of assets and sectors. For example, a Bitcoin ETF tracks Bitcoin’s price. ETF is a tool used by investors to gain exposure to a certain asset.
Yes. The first Bitcoin futures ETF in the US was approved by the US Securities & Exchange Commission in October 2021. A total of seven Bitcoin futures ETFs have been approved, with more than 20 still waiting for the regulator’s permission. The SEC says that the cryptocurrency industry is new and subject to manipulation, which is why it has been delaying crypto-related futures ETFs for the last few years.
Yes. The SEC approved in January 2024 the listing and trading of several Bitcoin spot Exchange-Traded Funds, opening the door to institutional capital and mainstream investors to trade the main crypto currency. The decision was hailed by the industry as a game changer.
The main advantage of crypto ETFs is the possibility of gaining exposure to a cryptocurrency without ownership, reducing the risk and cost of holding the asset. Other pros are a lower learning curve and higher security for investors since ETFs take charge of securing the underlying asset holdings. As for the main drawbacks, the main one is that as an investor you can’t have direct ownership of the asset, or, as they say in crypto, “not your keys, not your coins.” Other disadvantages are higher costs associated with holding crypto since ETFs charge fees for active management. Finally, even though investing in ETFs reduces the risk of holding an asset, price swings in the underlying cryptocurrency are likely to be reflected in the investment vehicle too.

超過一百萬用戶依賴 FXStreet 獲取即時市場數據、圖表工具、專家洞見與外匯新聞。其全面的經濟日曆與教育網路研討會協助交易者保持資訊領先、做出審慎決策。FXStreet 擁有約 60 人的團隊,分布於巴塞隆納總部及全球各地。
閱讀更多


