
EUR/JPY Price Forecast: Remains above nine-day EMA near 182.50
作者 Akhtar Faruqui
發布日期: 24 Feb 2026 | 修改日期: 24 Feb 2026


熱門文章

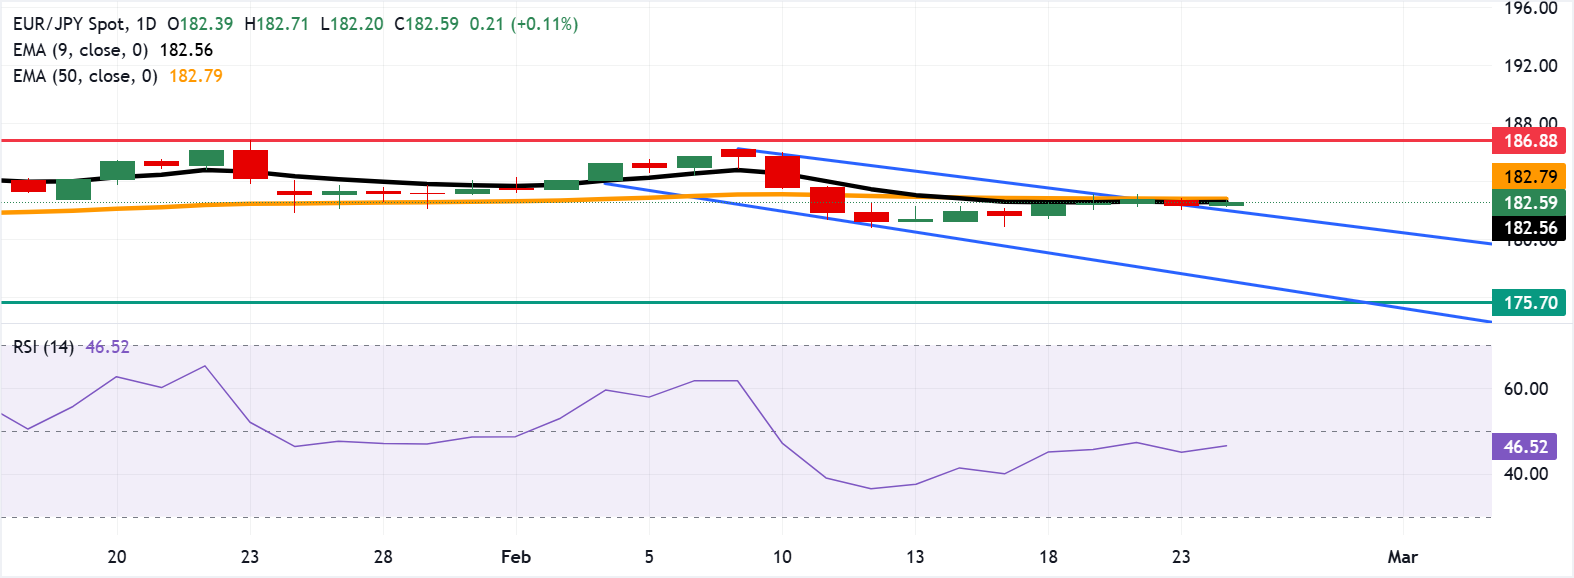
EUR/JPY pares its recent losses from the previous session, trading around 182.60 during the Asian hours on Tuesday. The technical analysis of the daily chart points to a potential bullish reversal, with the currency cross holding slightly above the upper boundary of the descending channel pattern.
- EUR/JPY tests the immediate barrier at the 50-day Exponential Moving Average at 182.78.
- The short-term average stabilizes as the medium-term slope flattens, signaling consolidation.
- The pair treads water above the initial support at the nine-day EMA at 182.57.
EUR/JPY pares its recent losses from the previous session, trading around 182.60 during the Asian hours on Tuesday. The technical analysis of the daily chart points to a potential bullish reversal, with the currency cross holding slightly above the upper boundary of the descending channel pattern. However, the 14-day Relative Strength Index (RSI) at 46.84 (neutral) signals modest improvement in momentum without a clear trend resumption.
The EUR/JPY cross holds just above the nine-day Exponential Moving Average (EMA) at 182.57, while the 50-day EMA at 182.78 caps near-term recoveries. The short-term average has stabilized, and the medium-term slope is flattening, pointing to consolidation. Failure to reclaim the medium-term average would leave the pair vulnerable to range extension, while a sustained hold above the short-term average could keep dips contained.
A daily close above the 50-day EMA would cause the emergence of the bullish bias and support the EUR/JPY cross to explore the region around the all-time high of 186.88, which was recorded on January 23.
A break below the nine-day EMA could drag the EUR/JPY cross back into the descending channel and target the lower boundary of the channel around 177.30. Further declines below the channel would reinforce the bearish bias and put downward pressure on the currency cross to navigate the region around the four-month low of 175.70.
(The technical analysis of this story was written with the help of an AI tool.)
Euro Price Today
The table below shows the percentage change of Euro (EUR) against listed major currencies today. Euro was the strongest against the Japanese Yen.
| USD | EUR | GBP | JPY | CAD | AUD | NZD | CHF | |
|---|---|---|---|---|---|---|---|---|
| USD | 0.06% | -0.03% | 0.17% | 0.00% | -0.14% | -0.17% | 0.12% | |
| EUR | -0.06% | -0.09% | 0.13% | -0.05% | -0.20% | -0.23% | 0.06% | |
| GBP | 0.03% | 0.09% | 0.21% | 0.03% | -0.11% | -0.14% | 0.15% | |
| JPY | -0.17% | -0.13% | -0.21% | -0.16% | -0.30% | -0.34% | -0.04% | |
| CAD | -0.00% | 0.05% | -0.03% | 0.16% | -0.14% | -0.17% | 0.12% | |
| AUD | 0.14% | 0.20% | 0.11% | 0.30% | 0.14% | -0.03% | 0.26% | |
| NZD | 0.17% | 0.23% | 0.14% | 0.34% | 0.17% | 0.03% | 0.29% | |
| CHF | -0.12% | -0.06% | -0.15% | 0.04% | -0.12% | -0.26% | -0.29% |
The heat map shows percentage changes of major currencies against each other. The base currency is picked from the left column, while the quote currency is picked from the top row. For example, if you pick the Euro from the left column and move along the horizontal line to the US Dollar, the percentage change displayed in the box will represent EUR (base)/USD (quote).

超過一百萬用戶依賴 FXStreet 獲取即時市場數據、圖表工具、專家洞見與外匯新聞。其全面的經濟日曆與教育網路研討會協助交易者保持資訊領先、做出審慎決策。FXStreet 擁有約 60 人的團隊,分布於巴塞隆納總部及全球各地。
閱讀更多


