
Pi Network Price Forecast: PI extends decline as steady mainnet migration adds pressure
作者 Vishal Dixit
發布日期: 9 Feb 2026 | 修改日期: 9 Feb 2026


熱門文章

Pi Network (PI) edges lower by over 3% at press time on Monday, marking a third consecutive day of losses. The declining trend in PI aligns with the steady mainnet migration of PI tokens, which may fuel selling pressure.
- Pi Network extends its decline for the third consecutive day after being rejected near $0.1500 last week.
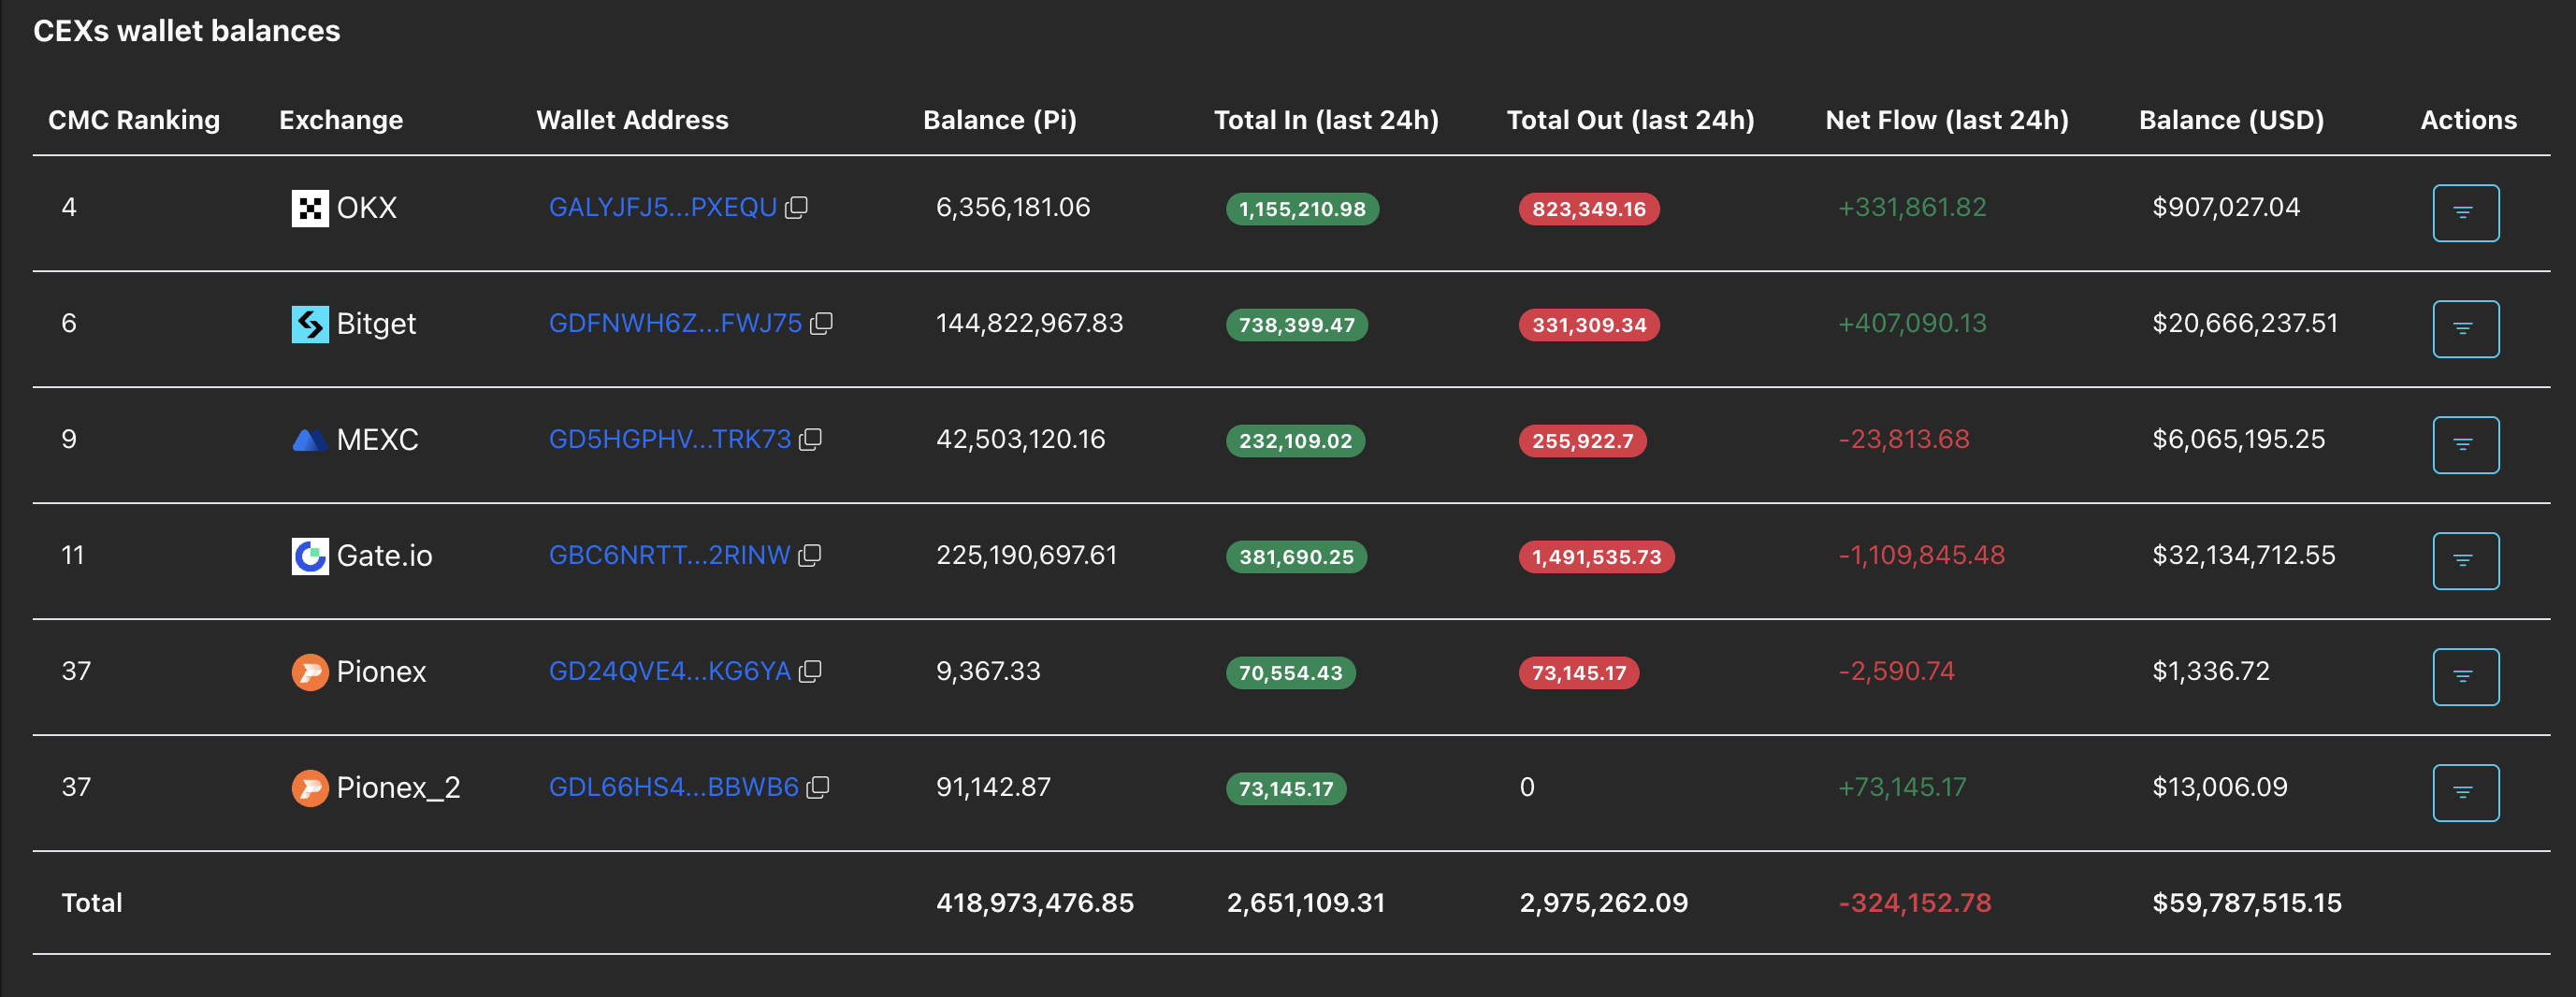
- PiScan data shows CEXs' outflows struggling to curb selling pressure as more than 33 million PI tokens migrate to the mainnet on Monday.
- The technical outlook for PI remains bearish as selling pressure grows.
Pi Network (PI) edges lower by over 3% at press time on Monday, marking a third consecutive day of losses. The declining trend in PI aligns with the steady mainnet migration of PI tokens, which may fuel selling pressure. The technical outlook for PI remains bearish, with bearish momentum persisting.
Mainnet migration adds selling pressure
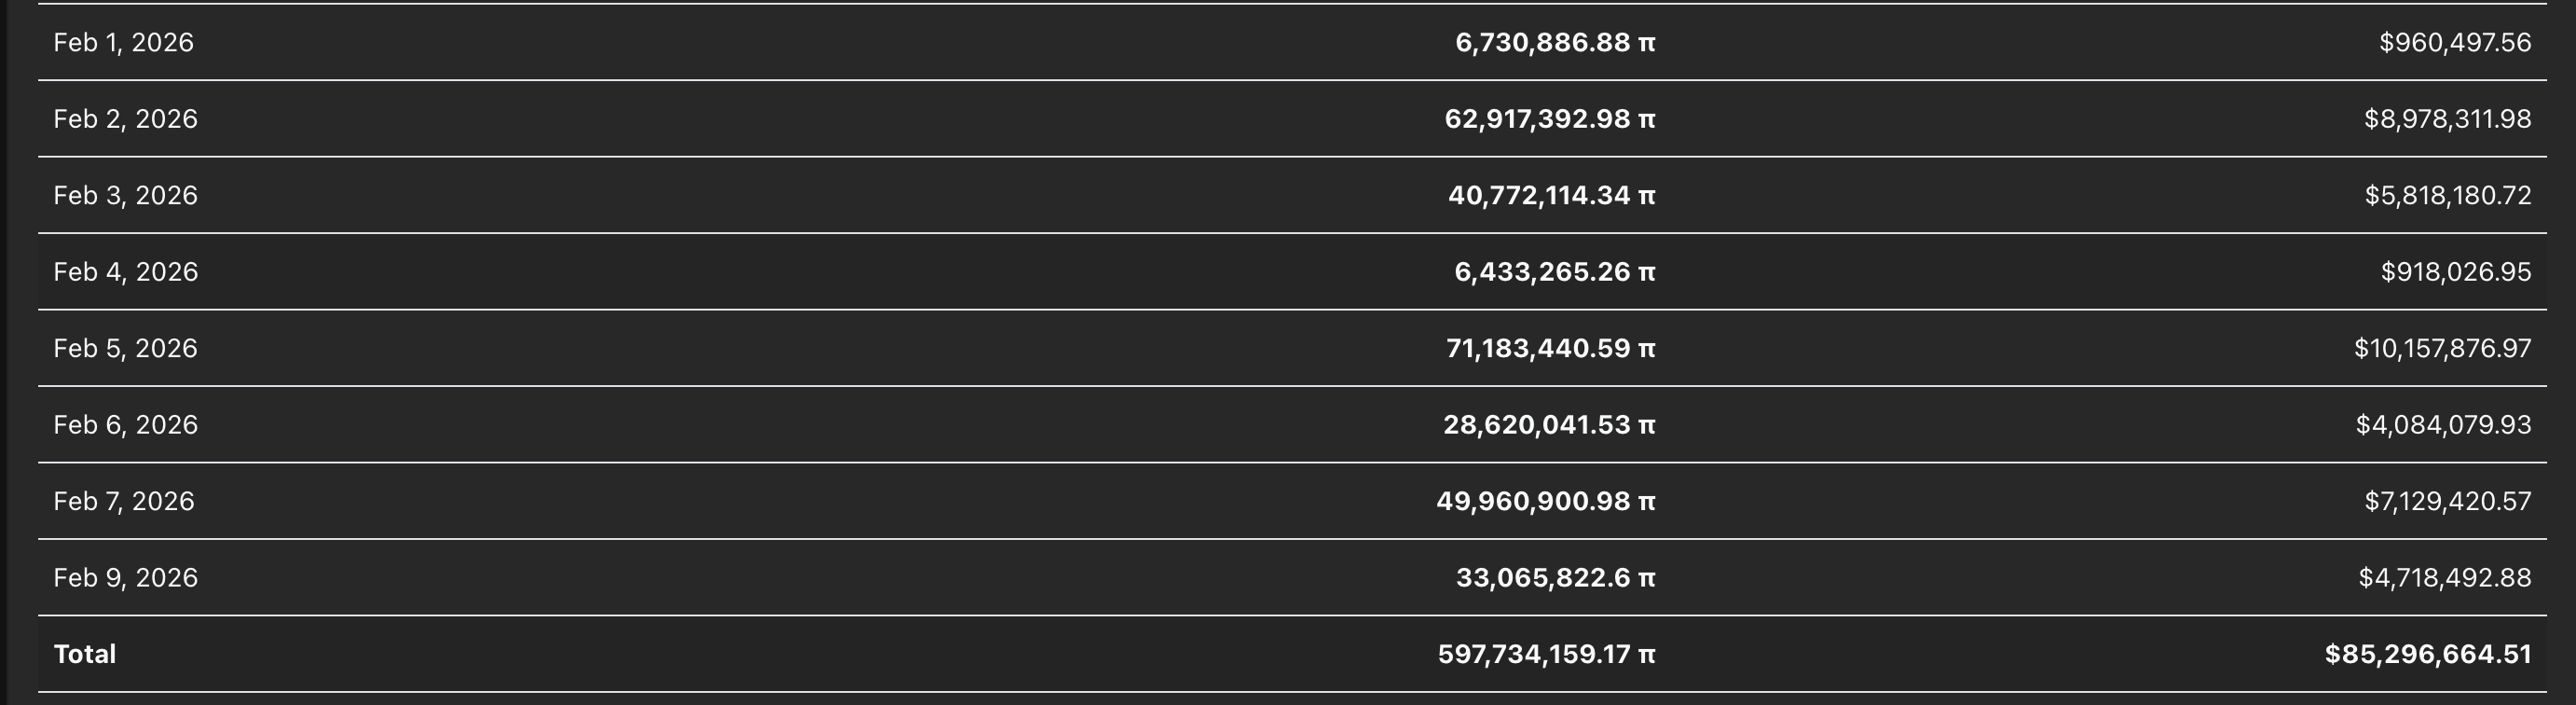
PiScan data show a consistent mainnet migration, giving holders an opportunity to offload PI tokens, adding to selling pressure. PiScan data show 33.06 million PI tokens were transferred to the mainnet on Monday, bringing February's total to roughly 300 million PI tokens.
Meanwhile, the PI-supporting Centralized Exchanges (CEXs) recorded an outflow of 324,152 PI tokens in the last 24 hours. Typically, withdrawals from CEXs indicate reduced selling pressure, suggesting that the supply pressure is likely driven by off-exchange channels, including Over-the-Counter (OTC) trades.
Technical outlook: Will PI token hit a fresh low?
Pi Network extends its decline by over 3% at press time on Monday, approaching the $0.1400 round figure. A decisive close below $0.1400 on the 4-hour chart would likely trigger a move to the S1 Pivot Point at $0.1283.
The momentum indicators on the 4-hour chart suggest a sell-side dominance. The Moving Average Convergence Divergence (MACD) dips toward the signal line as green histogram bars contract, raising the risk of a bearish crossover. At the same time, the Relative Strength Index (RSI) has dropped to 32, inching closer to the oversold zone. If the MACD indicator displays a bearish crossover and the RSI enters the oversold zone, the PI token is likely to experience a steeper correction.
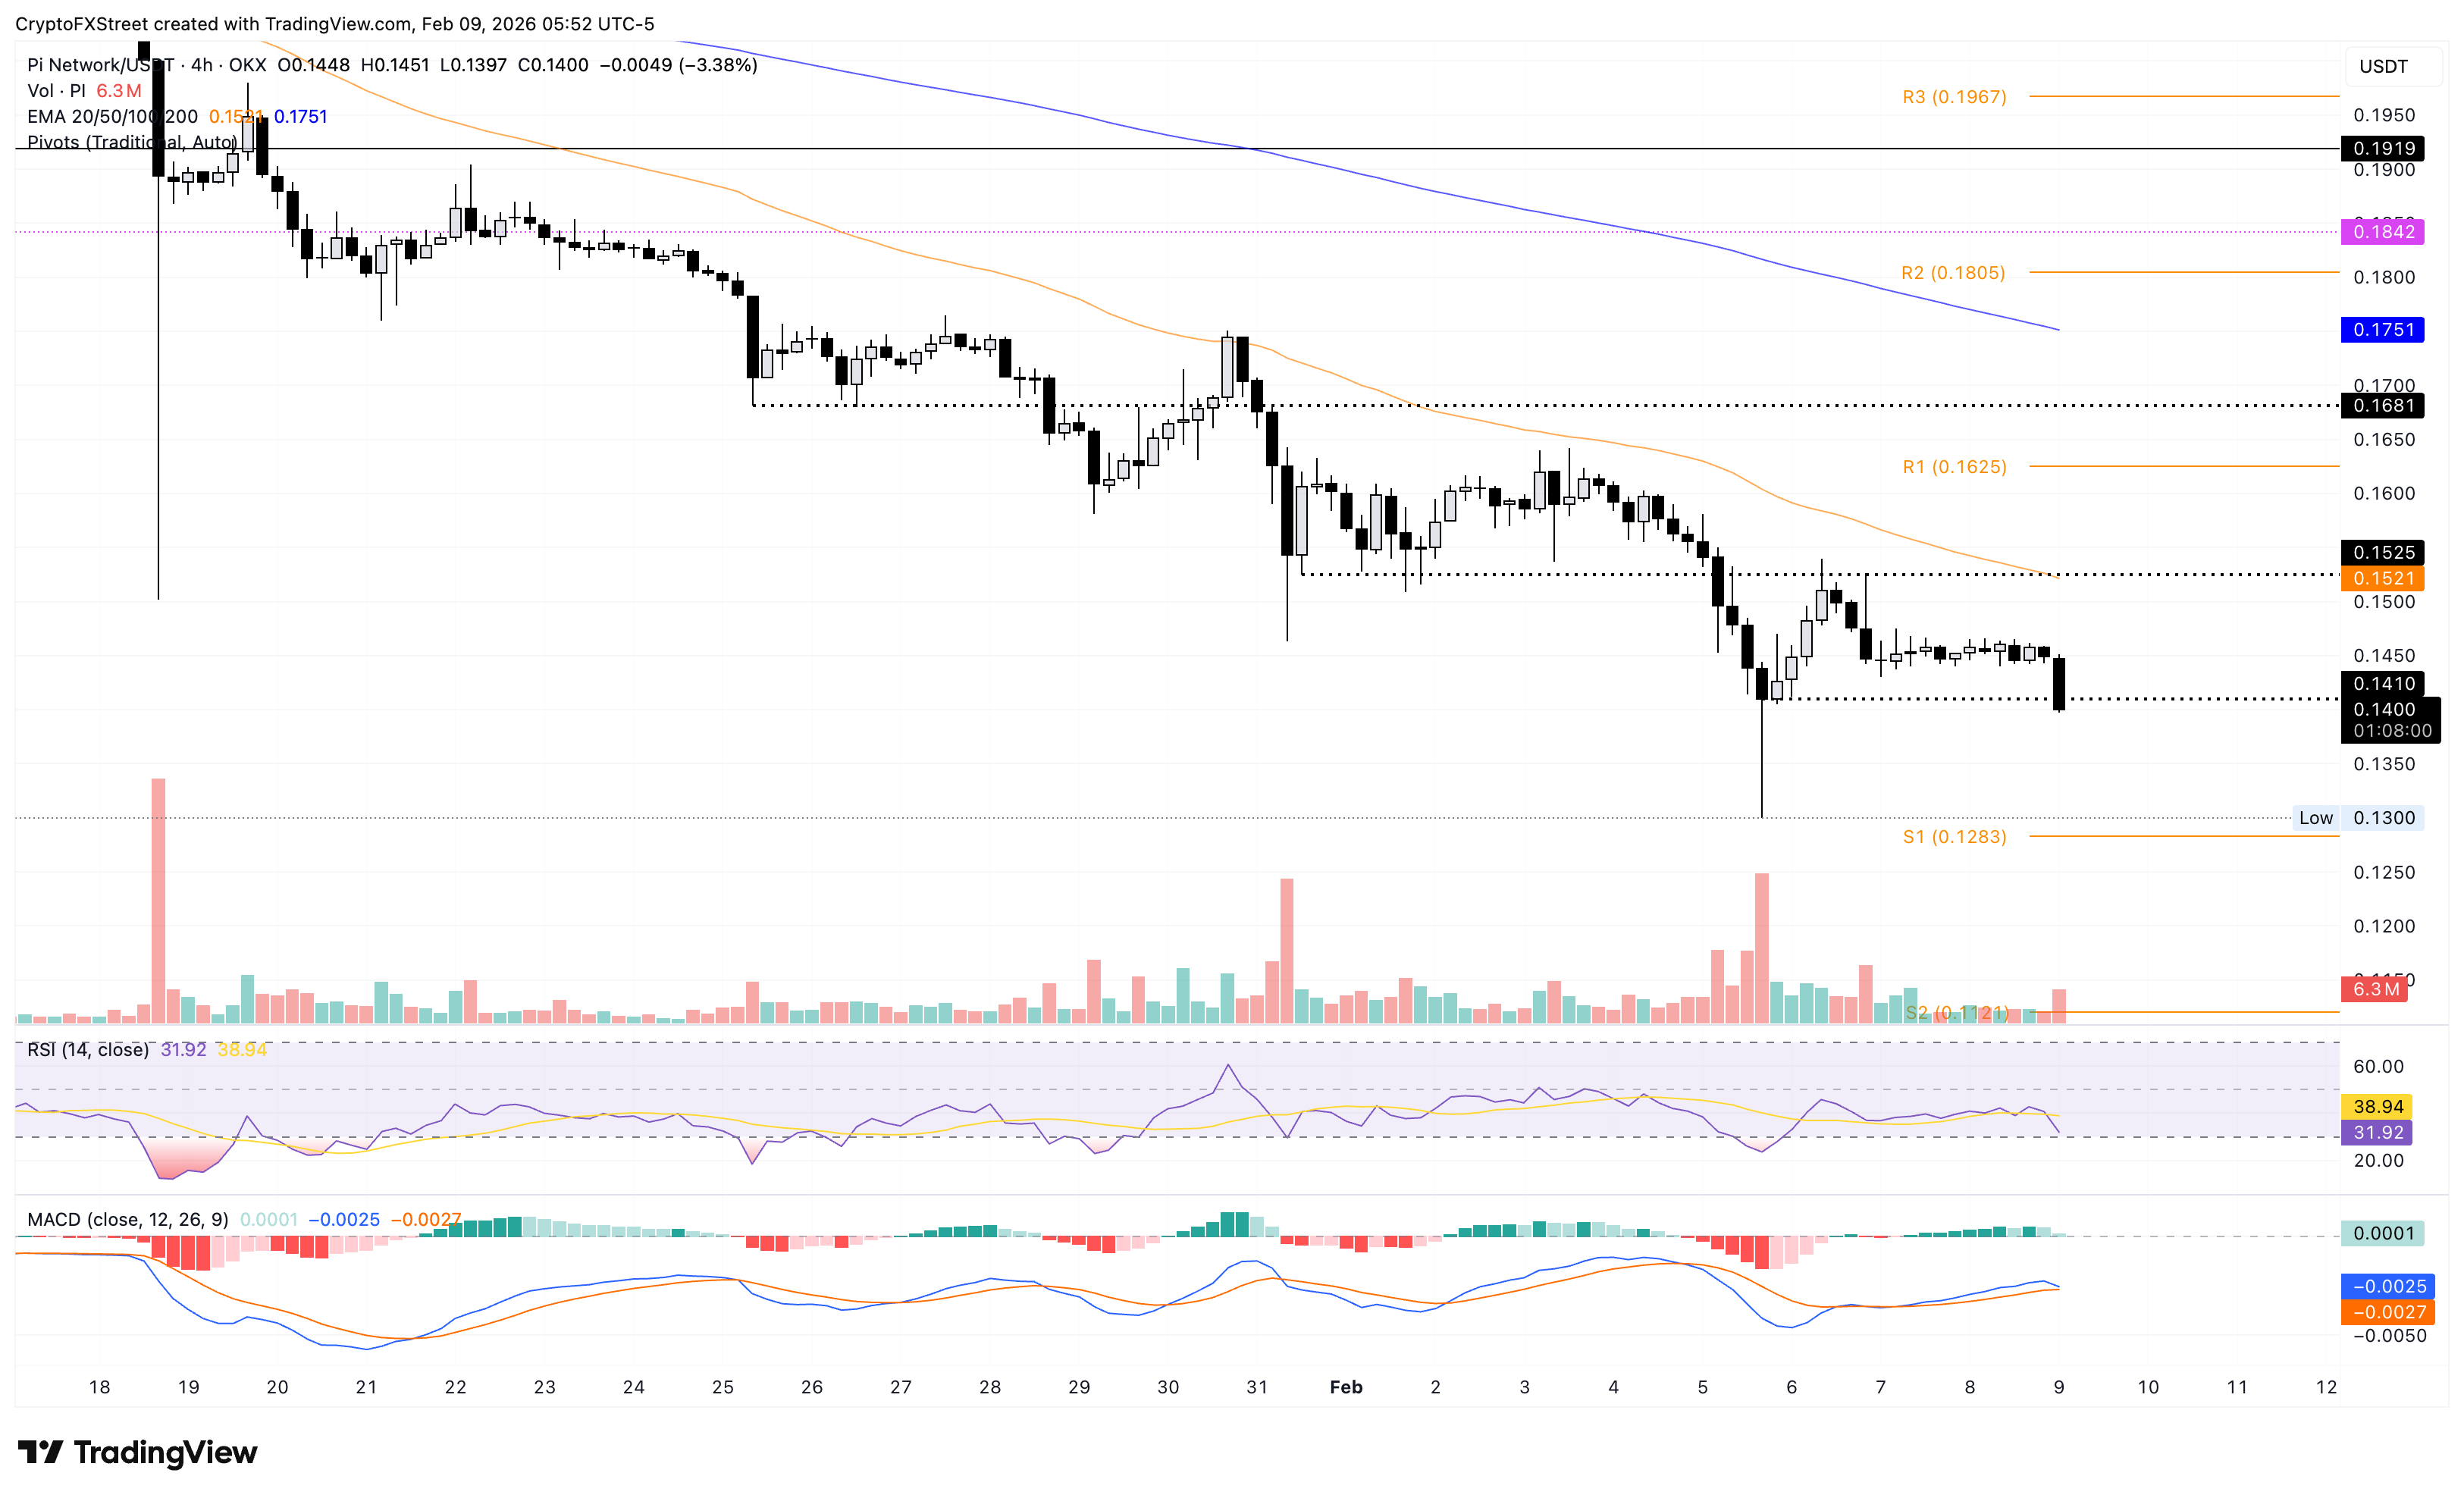
On the upside, a close above $0.1450 would ease downside pressure and could lift PI token toward the $0.1500 round figure.

超過一百萬用戶依賴 FXStreet 獲取即時市場數據、圖表工具、專家洞見與外匯新聞。其全面的經濟日曆與教育網路研討會協助交易者保持資訊領先、做出審慎決策。FXStreet 擁有約 60 人的團隊,分布於巴塞隆納總部及全球各地。
閱讀更多


