
XRP accelerates decline amid weak retail interest and mild ETF inflows
作者 John Isige
發布日期: 11 Feb 2026 | 修改日期: 11 Feb 2026


熱門文章

Ripple (XRP) is edging lower around $1.36 at the time of writing on Wednesday, weighed down by low retail interest and macroeconomic uncertainty, which is accelerating risk-off sentiment.
- XRP extends sell-off as risk-off sentiment weighs across the broader crypto market.
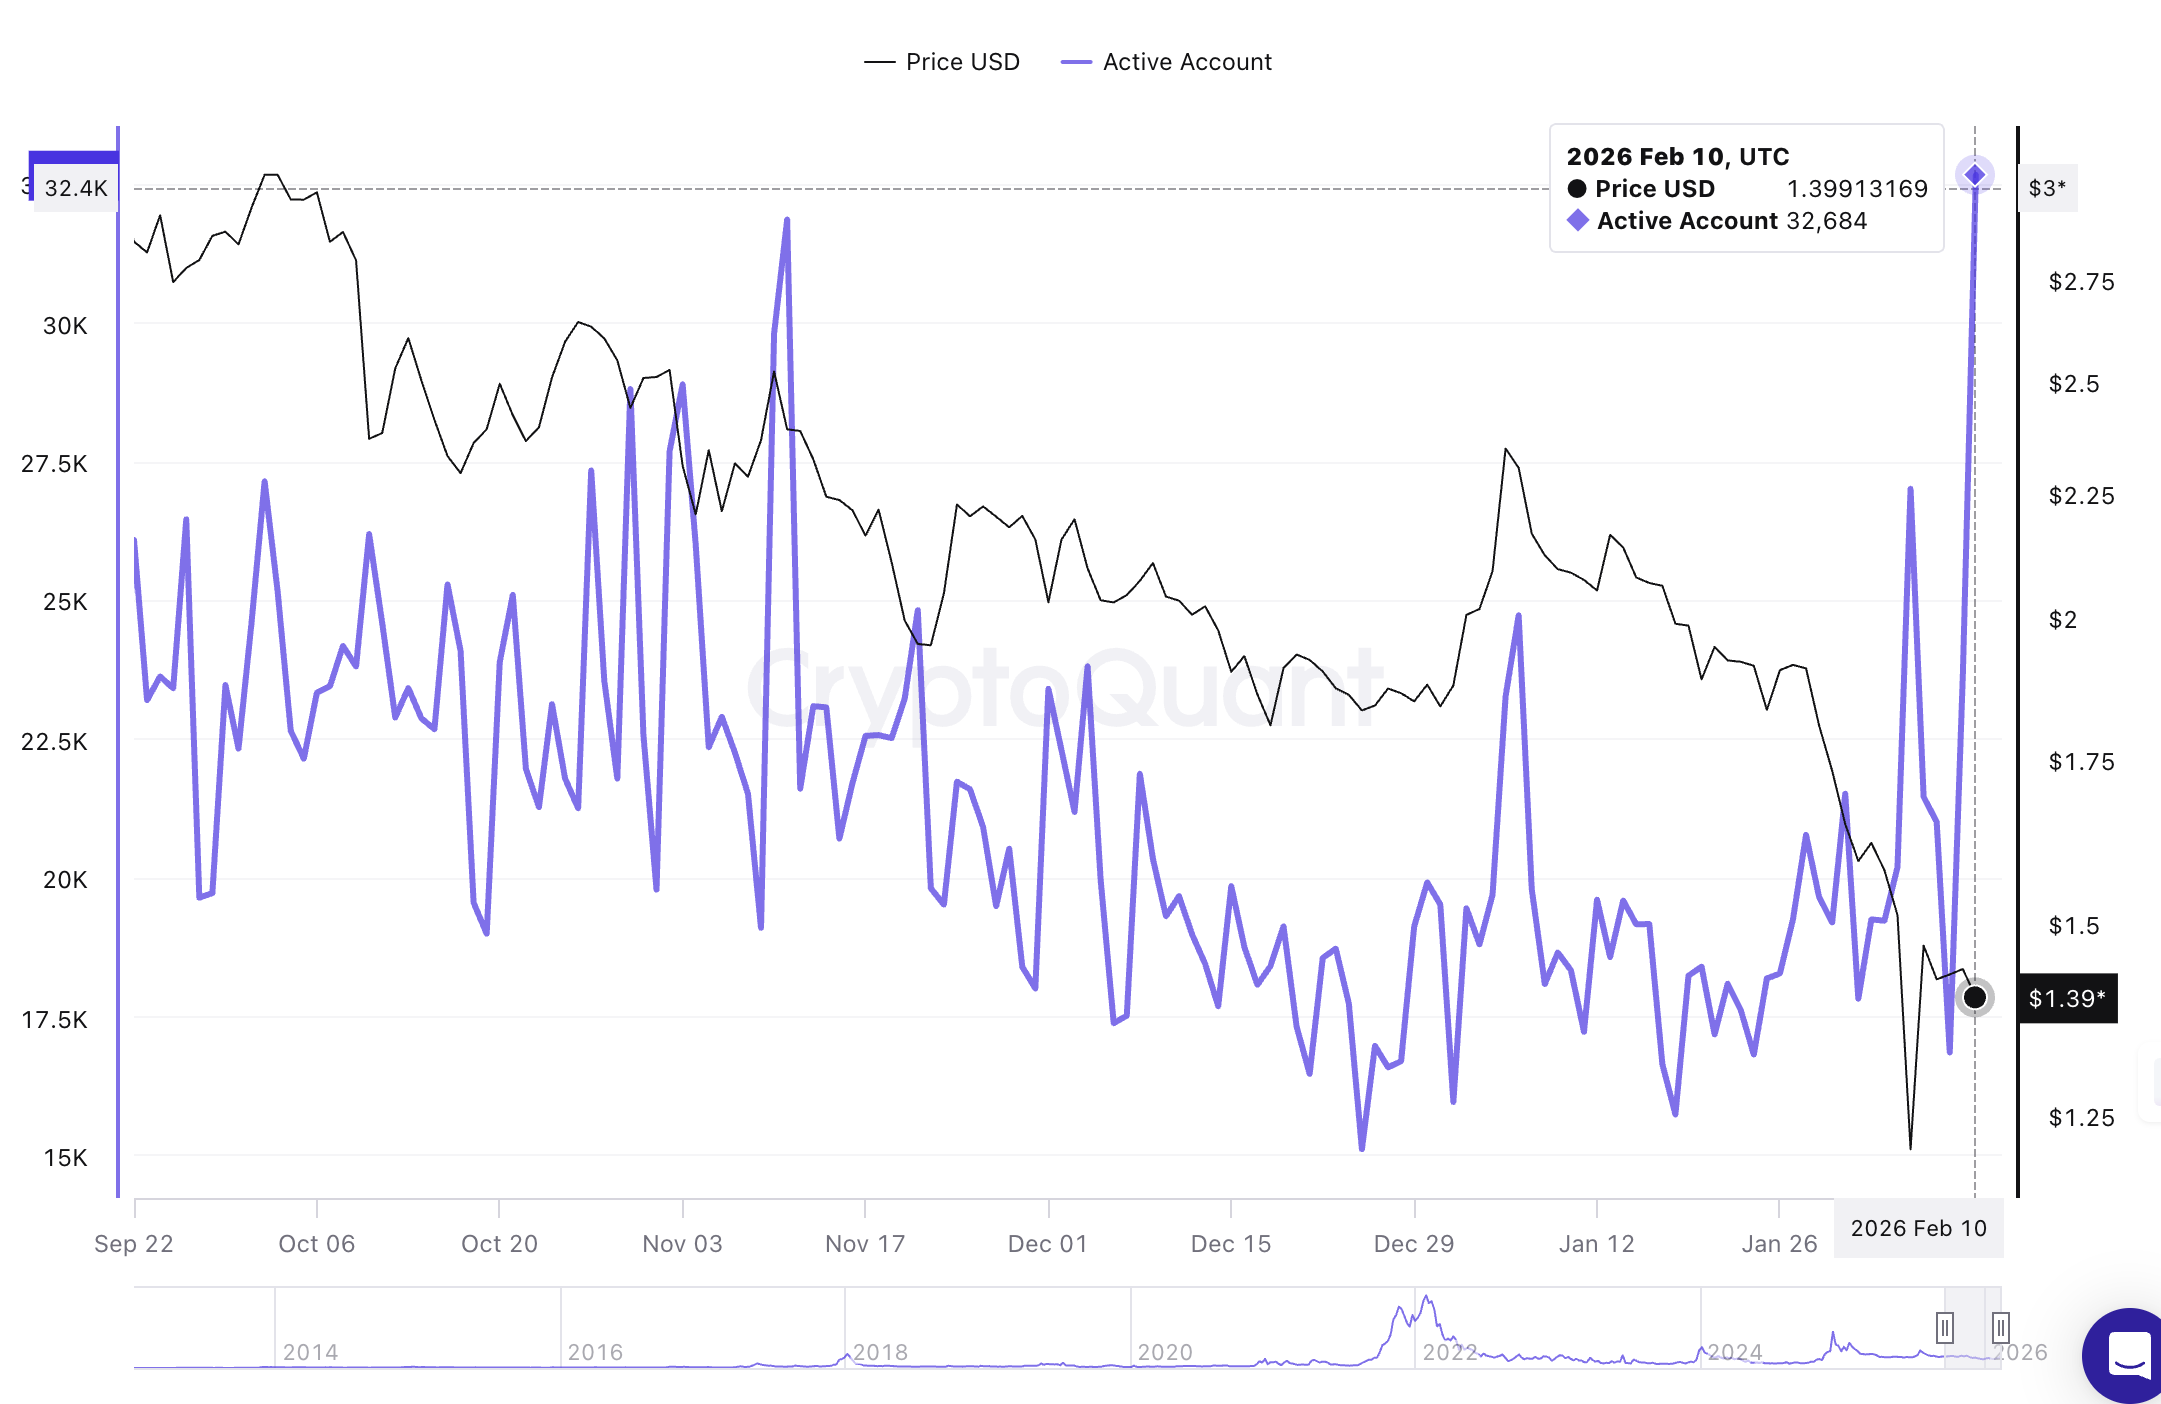
- The XRP Ledger records a significant increase in active addresses above 32,000.
- Mild institutional support via spot ETFs fails to absorb selling pressure, leaving XRP vulnerable to a weak retail market.
Ripple (XRP) is edging lower around $1.36 at the time of writing on Wednesday, weighed down by low retail interest and macroeconomic uncertainty, which is accelerating risk-off sentiment.
The remittance token has corrected so far by 19% in February, 7% this week and approximately 3% intraday. Unless the short-term technical structure stabilizes and is supported by steady institutional interest, the path of least resistance would remain downcast toward the October 10 low at $1.25 and Friday’s support at $1.12.
XRP Ledger’s on-chain activity soars
The XRP Ledger (XRPL) has since Monday recorded a significant increase in the number of active addresses transacting on-chain. According to CryptoQuant’s data, the Active Addresses metric nearly doubled from approximately 17,000 addresses on Sunday to 32,700 on Wednesday.
The surge in addresses transacting on the XRPL indicates greater engagement with the protocol and reflects growing interest in XRP. Moreover, it signals rising confidence among holders as sentiment gradually improves.
However, investors should temper expectations, as the same increase may signal volatility, leading to instability and price fluctuations.
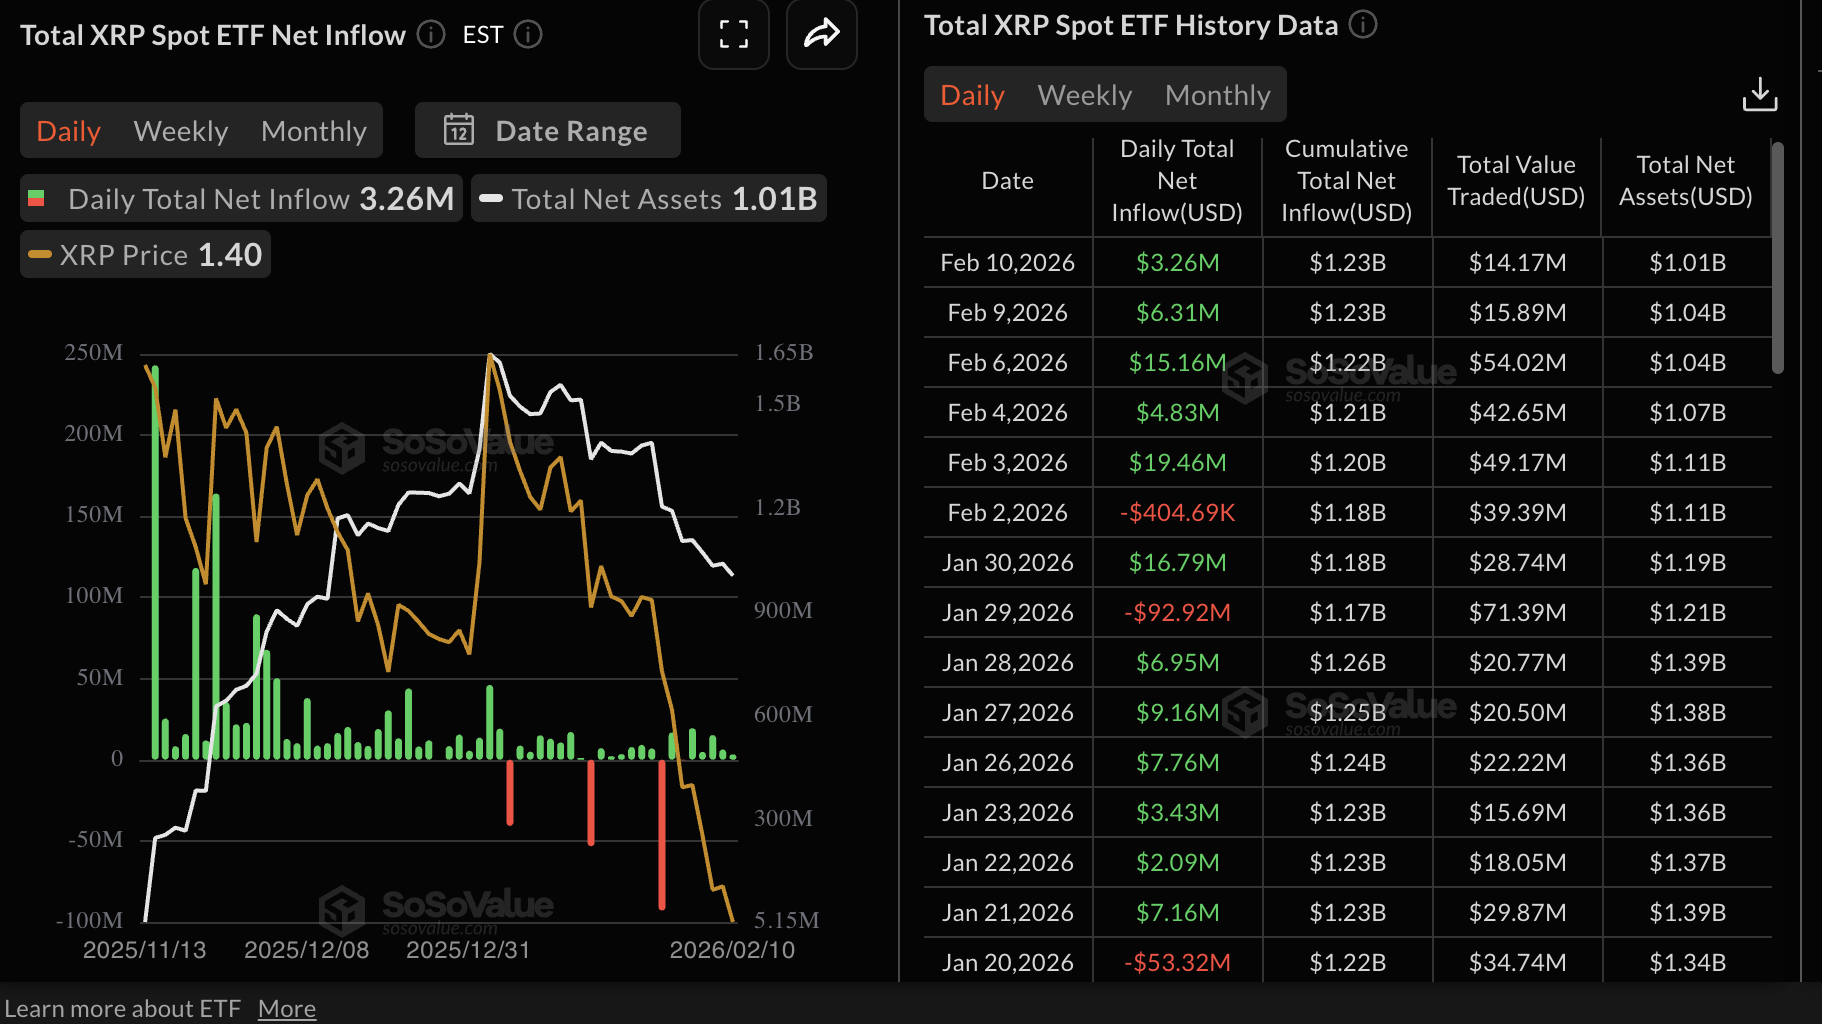
Meanwhile, institutional interest in XRP remains steady, albeit with mild inflows into XRP spot Exchange-Traded Funds (ETFs). For five consecutive days, US-listed XRP ETFs have recorded inflows, with $3.26 million deposited on Tuesday.
The cumulative inflow stands at $1.23 billion, and the net assets under management at $1.01 billion, according to SoSoValue. Steady inflows into ETFs suggest positive sentiment around the underlying asset.
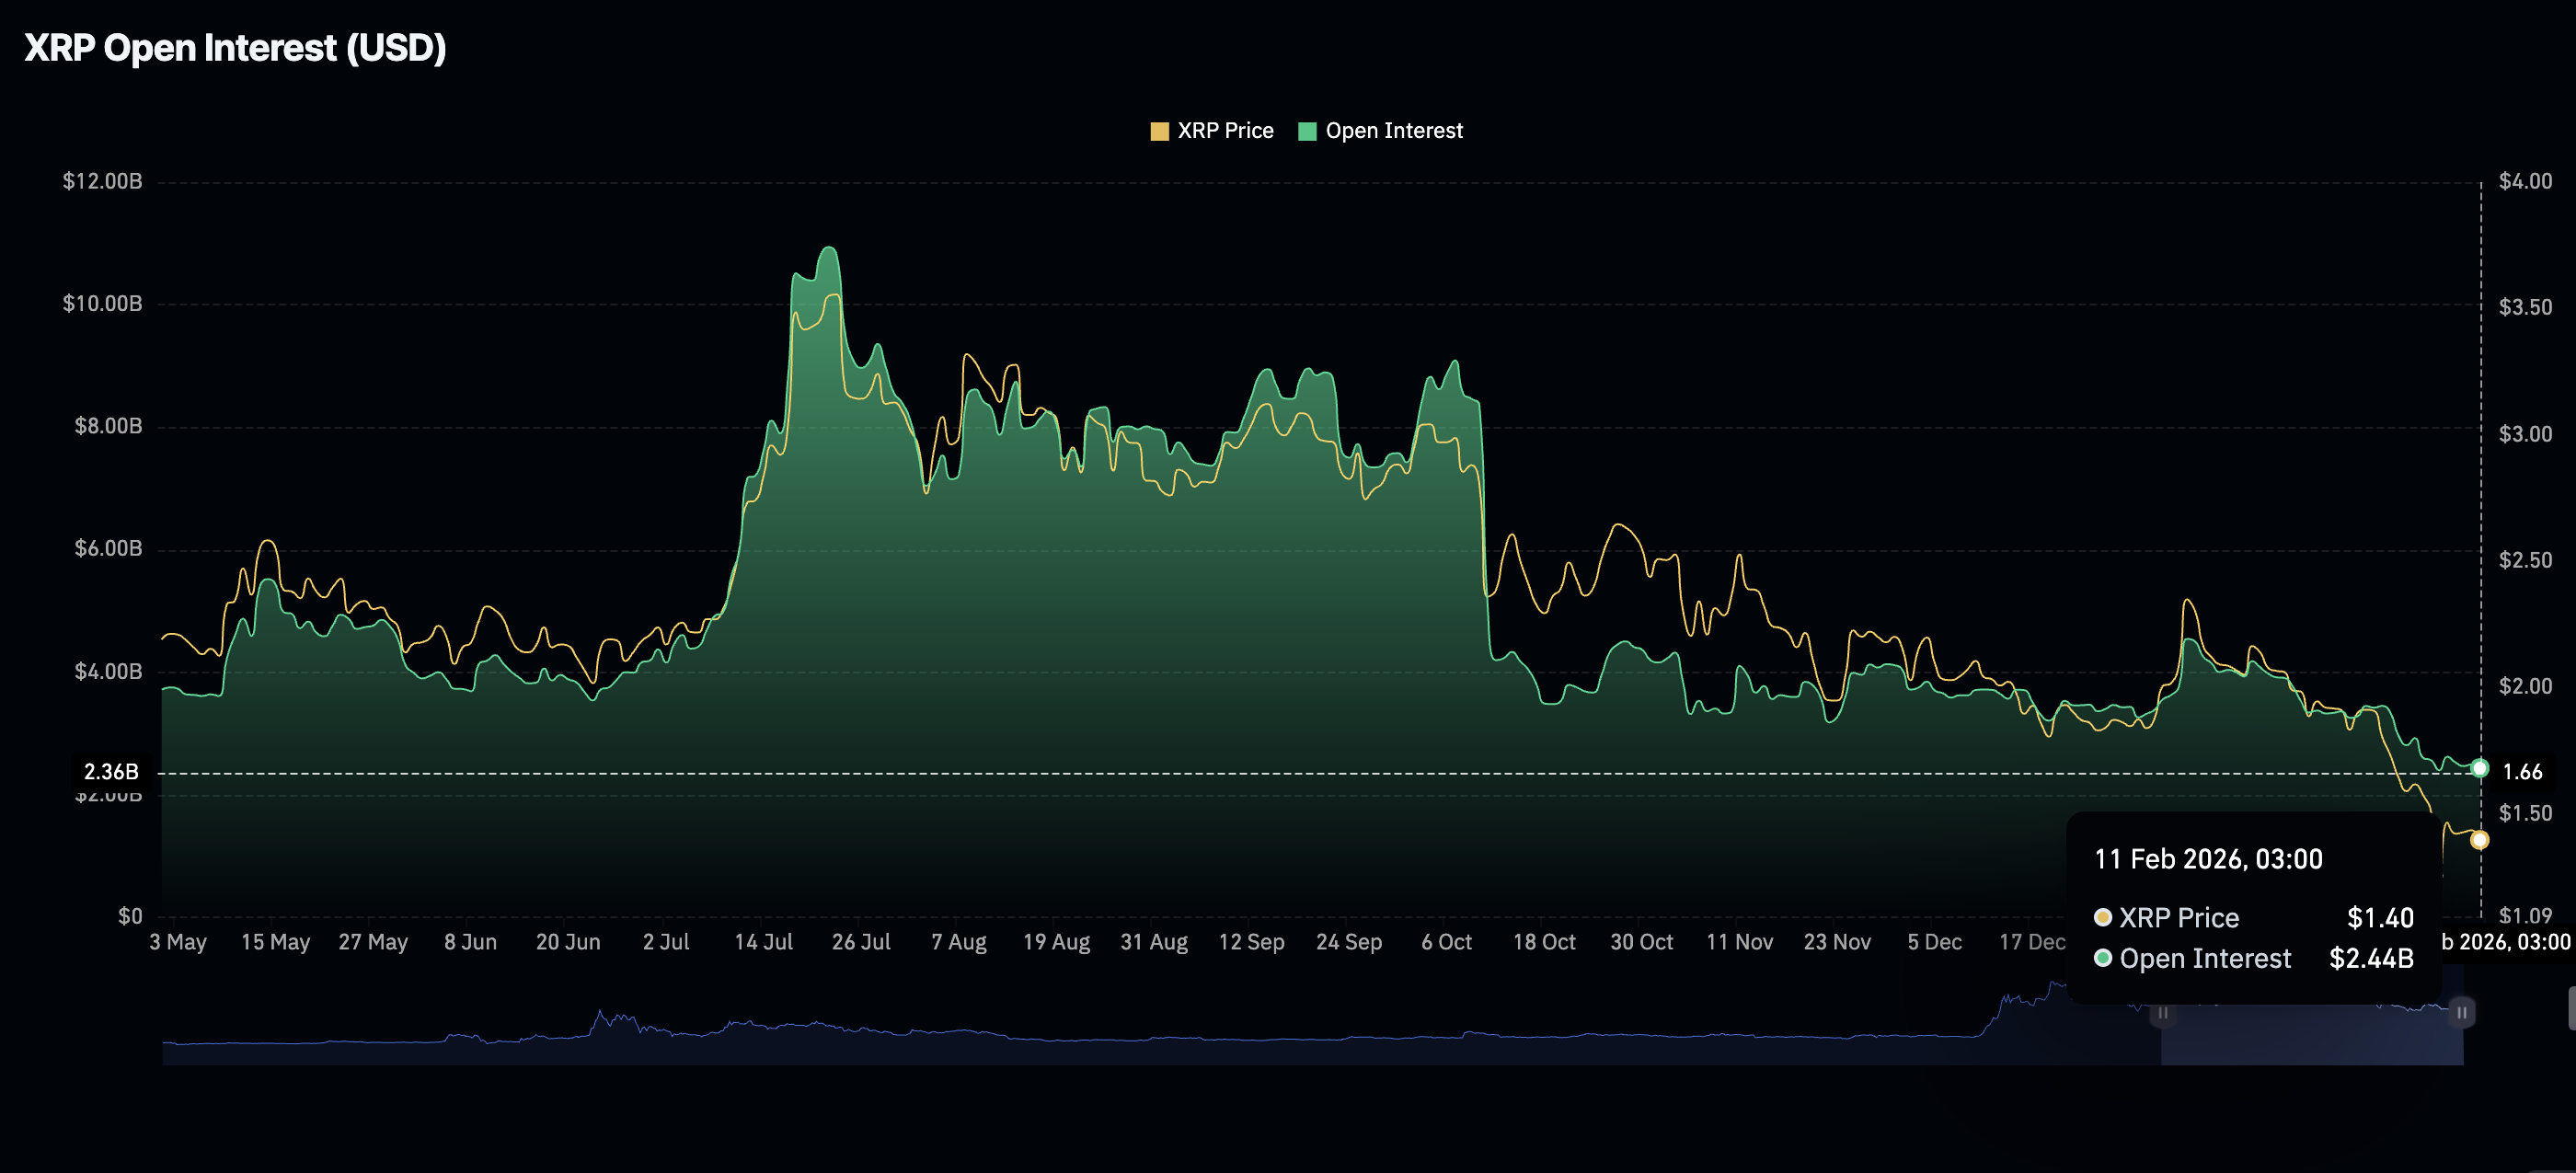
Despite stable institutional demand, retail interest in XRP is on the back foot, as futures Open Interest (OI) falls to $2.44 billion on Wednesday, slightly below $2.5 billon the previous day. OI has generally stayed in a downtrend since the record high of $10.94 billion in July, suggesting that investors lack confidence in XRP’s ability to recover and sustain an uptrend.
Technical outlook: XRP edges lower amid weak technicals
XRP is trading well below the 50-day Exponential Moving Average (EMA) at $1.80, the 100-day EMA at $1.99 and the 200-day EMA at $2.18. All three moving averages are sloping downward, indicating a bearish momentum bias.
The Relative Strength Index (RSI) at 32 is poised to enter oversold territory on the daily chart, proposing sellers have the upper hand. Meanwhile, the support-turned-resistance at $1.40 limits XRP’s upside, putting the demand zone at $1.25 in focus. Below this level, losses may escalate to retest Friday’s low at $1.12.
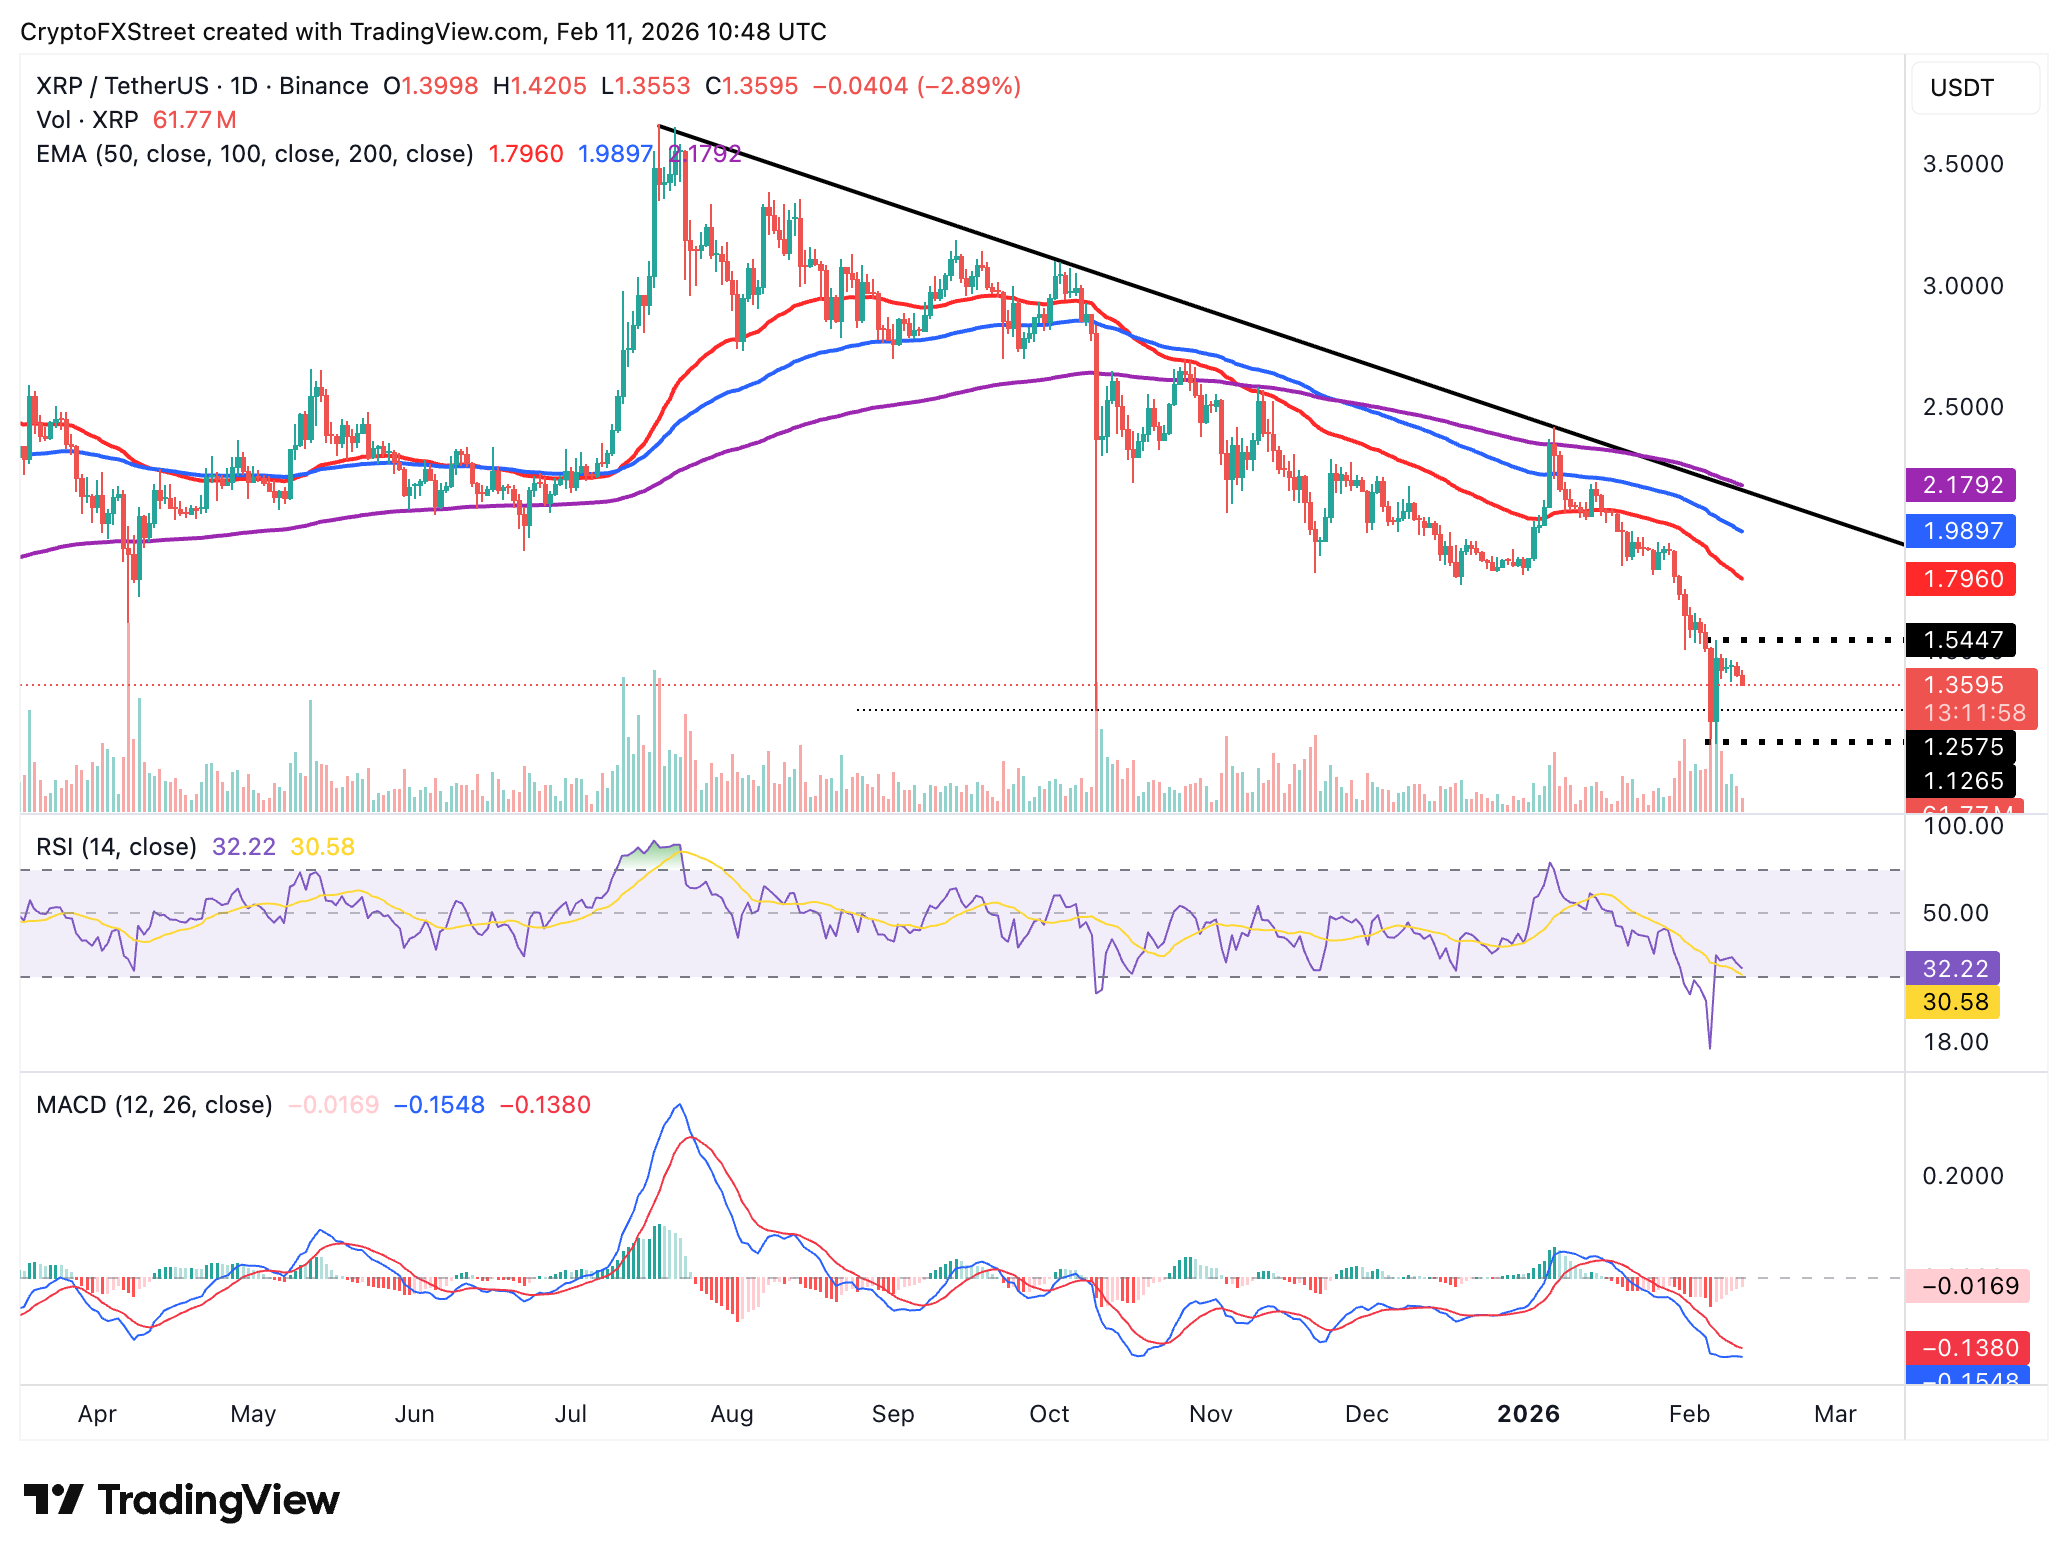
Conversely, a knee-jerk reversal would not be a pipe dream if the Moving Average Convergence Divergence (MACD) indicator lifts above the signal line on the same chart. The red histogram bars should continue their contract to usher in a bullish transition that may push XRP above Friday’s high at $1.54.
Cryptocurrency metrics FAQs
The developer or creator of each cryptocurrency decides on the total number of tokens that can be minted or issued. Only a certain number of these assets can be minted by mining, staking or other mechanisms. This is defined by the algorithm of the underlying blockchain technology. On the other hand, circulating supply can also be decreased via actions such as burning tokens, or mistakenly sending assets to addresses of other incompatible blockchains.
Market capitalization is the result of multiplying the circulating supply of a certain asset by the asset’s current market value.
Trading volume refers to the total number of tokens for a specific asset that has been transacted or exchanged between buyers and sellers within set trading hours, for example, 24 hours. It is used to gauge market sentiment, this metric combines all volumes on centralized exchanges and decentralized exchanges. Increasing trading volume often denotes the demand for a certain asset as more people are buying and selling the cryptocurrency.
Funding rates are a concept designed to encourage traders to take positions and ensure perpetual contract prices match spot markets. It defines a mechanism by exchanges to ensure that future prices and index prices periodic payments regularly converge. When the funding rate is positive, the price of the perpetual contract is higher than the mark price. This means traders who are bullish and have opened long positions pay traders who are in short positions. On the other hand, a negative funding rate means perpetual prices are below the mark price, and hence traders with short positions pay traders who have opened long positions.

超過一百萬用戶依賴 FXStreet 獲取即時市場數據、圖表工具、專家洞見與外匯新聞。其全面的經濟日曆與教育網路研討會協助交易者保持資訊領先、做出審慎決策。FXStreet 擁有約 60 人的團隊,分布於巴塞隆納總部及全球各地。
閱讀更多


