
Silver Price Forecast: Double-top signals fatigue, but the broader uptrend is not broken
作者 Vishal Chaturvedi
發布日期: 21 Nov 2025 | 修改日期: 21 Nov 2025


熱門文章

Silver (XAG/USD) trims a part of its earlier losses on Friday after marking a fresh weekly low at $48.64. At the time of writing, the metal is trading around $49.69, recovering modestly but still down nearly 1.50% on the day, and remains on track for a weekly decline.
- Silver trims losses after hitting a fresh weekly low at $48.64, still set for a weekly decline.
- Double-top pattern on the daily chart keeps bearish pressure in play.
- Immediate support rests at the $49.50-$49.00 zone aligned with the 21-day SMA.
Silver (XAG/USD) trims a part of its earlier losses on Friday after marking a fresh weekly low at $48.64. At the time of writing, the metal is trading around $49.69, recovering modestly but still down nearly 1.50% on the day, and remains on track for a weekly decline.
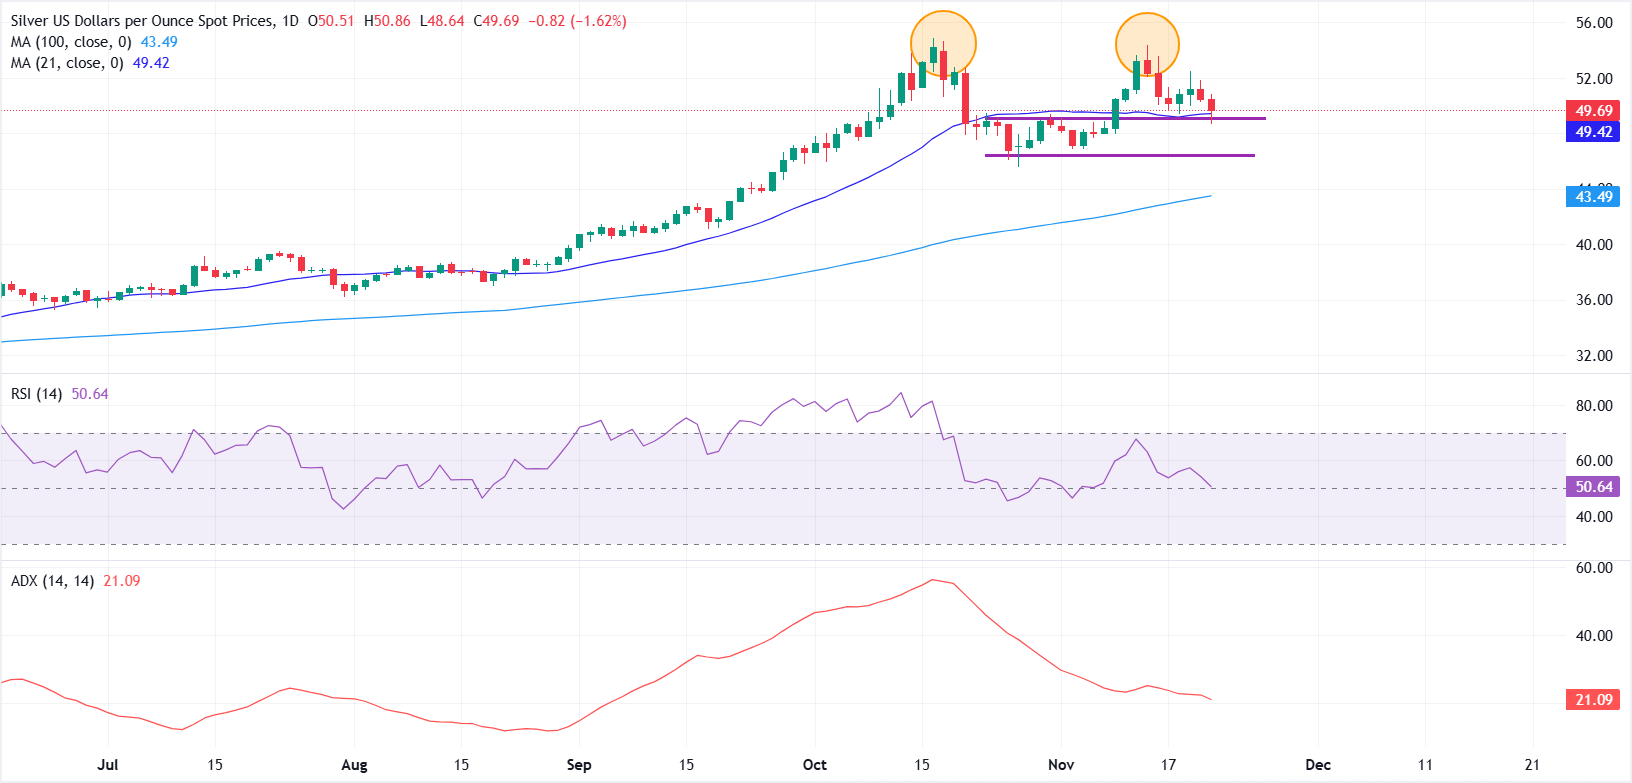
From a technical perspective, Silver is flashing early signs of fatigue after forming a double-top pattern on the daily chart, with peaks around the $54.50-$55.00 region. The pattern is beginning to exert mild bearish pressure, although the neckline remains intact, keeping sellers cautious for now.
Despite the pullback, the broader uptrend structure remains intact, with prices still comfortably above the key moving averages. The 21-day Simple Moving Average (SMA) has flattened around $49.42, reinforcing the immediate $49.50-$49.00 support band. This is the first line in the sand for bulls.
A decisive break below this confluence zone would expose downside toward $46.50, which corresponds to the double-top neckline. A close below $46.50 would constitute a technical breakdown and shift the near-term bias firmly in favour of sellers.
On the upside, the $50.00 psychological level is the first hurdle. Bulls would need a sustained break above this level to attempt a move toward this week’s top near $52.47. A push through the double-top highs would invalidate the bearish formation and reinstall bullish momentum.
The Relative Strength Index (RSI) stands near 50, signaling balanced forces after earlier overbought readings faded. The Average Directional Index (ADX) eases to 21.09, indicating weak trend strength and a risk of range-bound trade unless momentum rebuilds.
Silver FAQs
Silver is a precious metal highly traded among investors. It has been historically used as a store of value and a medium of exchange. Although less popular than Gold, traders may turn to Silver to diversify their investment portfolio, for its intrinsic value or as a potential hedge during high-inflation periods. Investors can buy physical Silver, in coins or in bars, or trade it through vehicles such as Exchange Traded Funds, which track its price on international markets.
Silver prices can move due to a wide range of factors. Geopolitical instability or fears of a deep recession can make Silver price escalate due to its safe-haven status, although to a lesser extent than Gold's. As a yieldless asset, Silver tends to rise with lower interest rates. Its moves also depend on how the US Dollar (USD) behaves as the asset is priced in dollars (XAG/USD). A strong Dollar tends to keep the price of Silver at bay, whereas a weaker Dollar is likely to propel prices up. Other factors such as investment demand, mining supply – Silver is much more abundant than Gold – and recycling rates can also affect prices.
Silver is widely used in industry, particularly in sectors such as electronics or solar energy, as it has one of the highest electric conductivity of all metals – more than Copper and Gold. A surge in demand can increase prices, while a decline tends to lower them. Dynamics in the US, Chinese and Indian economies can also contribute to price swings: for the US and particularly China, their big industrial sectors use Silver in various processes; in India, consumers’ demand for the precious metal for jewellery also plays a key role in setting prices.
Silver prices tend to follow Gold's moves. When Gold prices rise, Silver typically follows suit, as their status as safe-haven assets is similar. The Gold/Silver ratio, which shows the number of ounces of Silver needed to equal the value of one ounce of Gold, may help to determine the relative valuation between both metals. Some investors may consider a high ratio as an indicator that Silver is undervalued, or Gold is overvalued. On the contrary, a low ratio might suggest that Gold is undervalued relative to Silver.

超過一百萬用戶依賴 FXStreet 獲取即時市場數據、圖表工具、專家洞見與外匯新聞。其全面的經濟日曆與教育網路研討會協助交易者保持資訊領先、做出審慎決策。FXStreet 擁有約 60 人的團隊,分布於巴塞隆納總部及全球各地。
閱讀更多


