
Solana Price Forecast: SOL under pressure as retail interest stays low
作者 Vishal Dixit
發布日期: 9 Feb 2026 | 修改日期: 9 Feb 2026


熱門文章

Solana (SOL) remains below $90 at press time on Monday, consolidating for the third consecutive day after Friday’s 11% rebound, which reduced last week’s loss to 14%.
- Solana approaches $90 on Monday, holding the 11% rebound from Friday.
- Derivatives data show that retail interest continues to decline as Open Interest falls and the funding rate remains negative.
- The technical outlook for Solana is skewed bearish, with recovery lagging.
Solana (SOL) remains below $90 at press time on Monday, consolidating for the third consecutive day after Friday’s 11% rebound, which reduced last week’s loss to 14%. The layer-1 token struggles to retain institutional and retail demand amid a crypto bear market driven by the Bitcoin (BTC) price decline, thereby increasing downside risk. The technical outlook for Solana remains bearish as the broader cryptocurrency market remains under pressure.
Market confidence declines in Solana
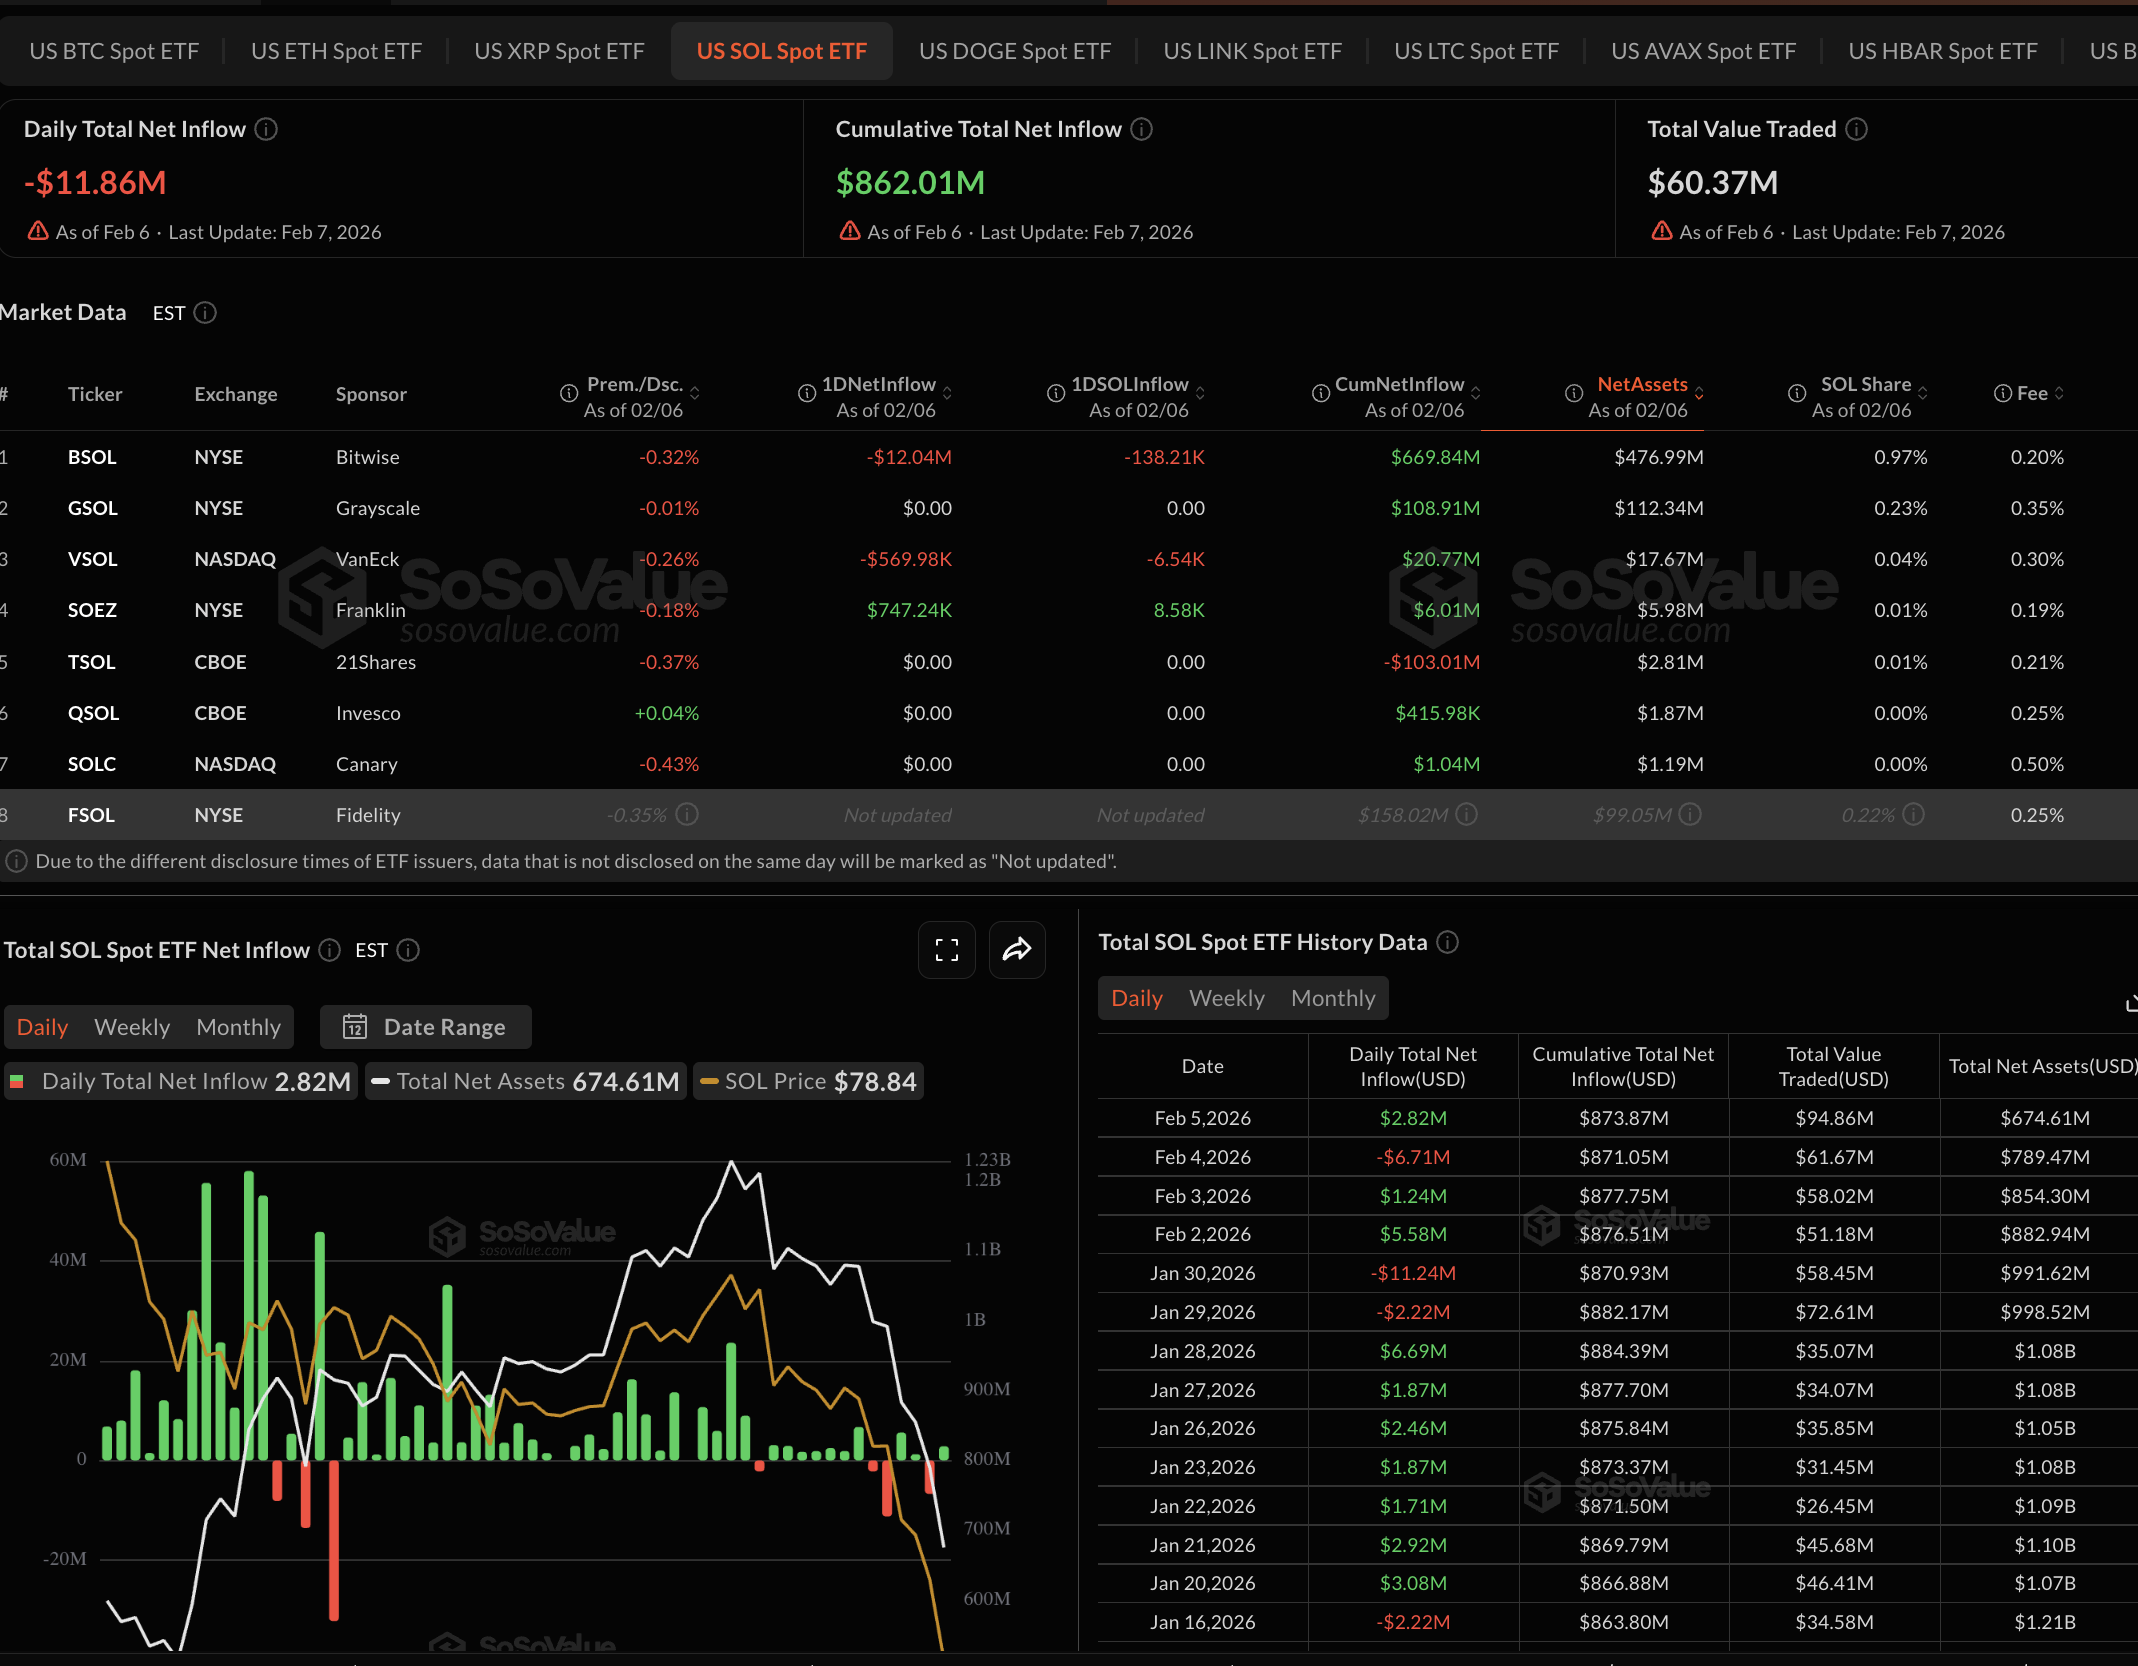
Broad market confidence in Solana remains low amid reduced investor risk appetite, with Bitcoin down 50% from its all-time high. The SOL-focused Exchange-Traded Funds (ETFs) recorded nearly $11.86 million in outflows, excluding Fidelity’s FSOL, which has yet to report its numbers.
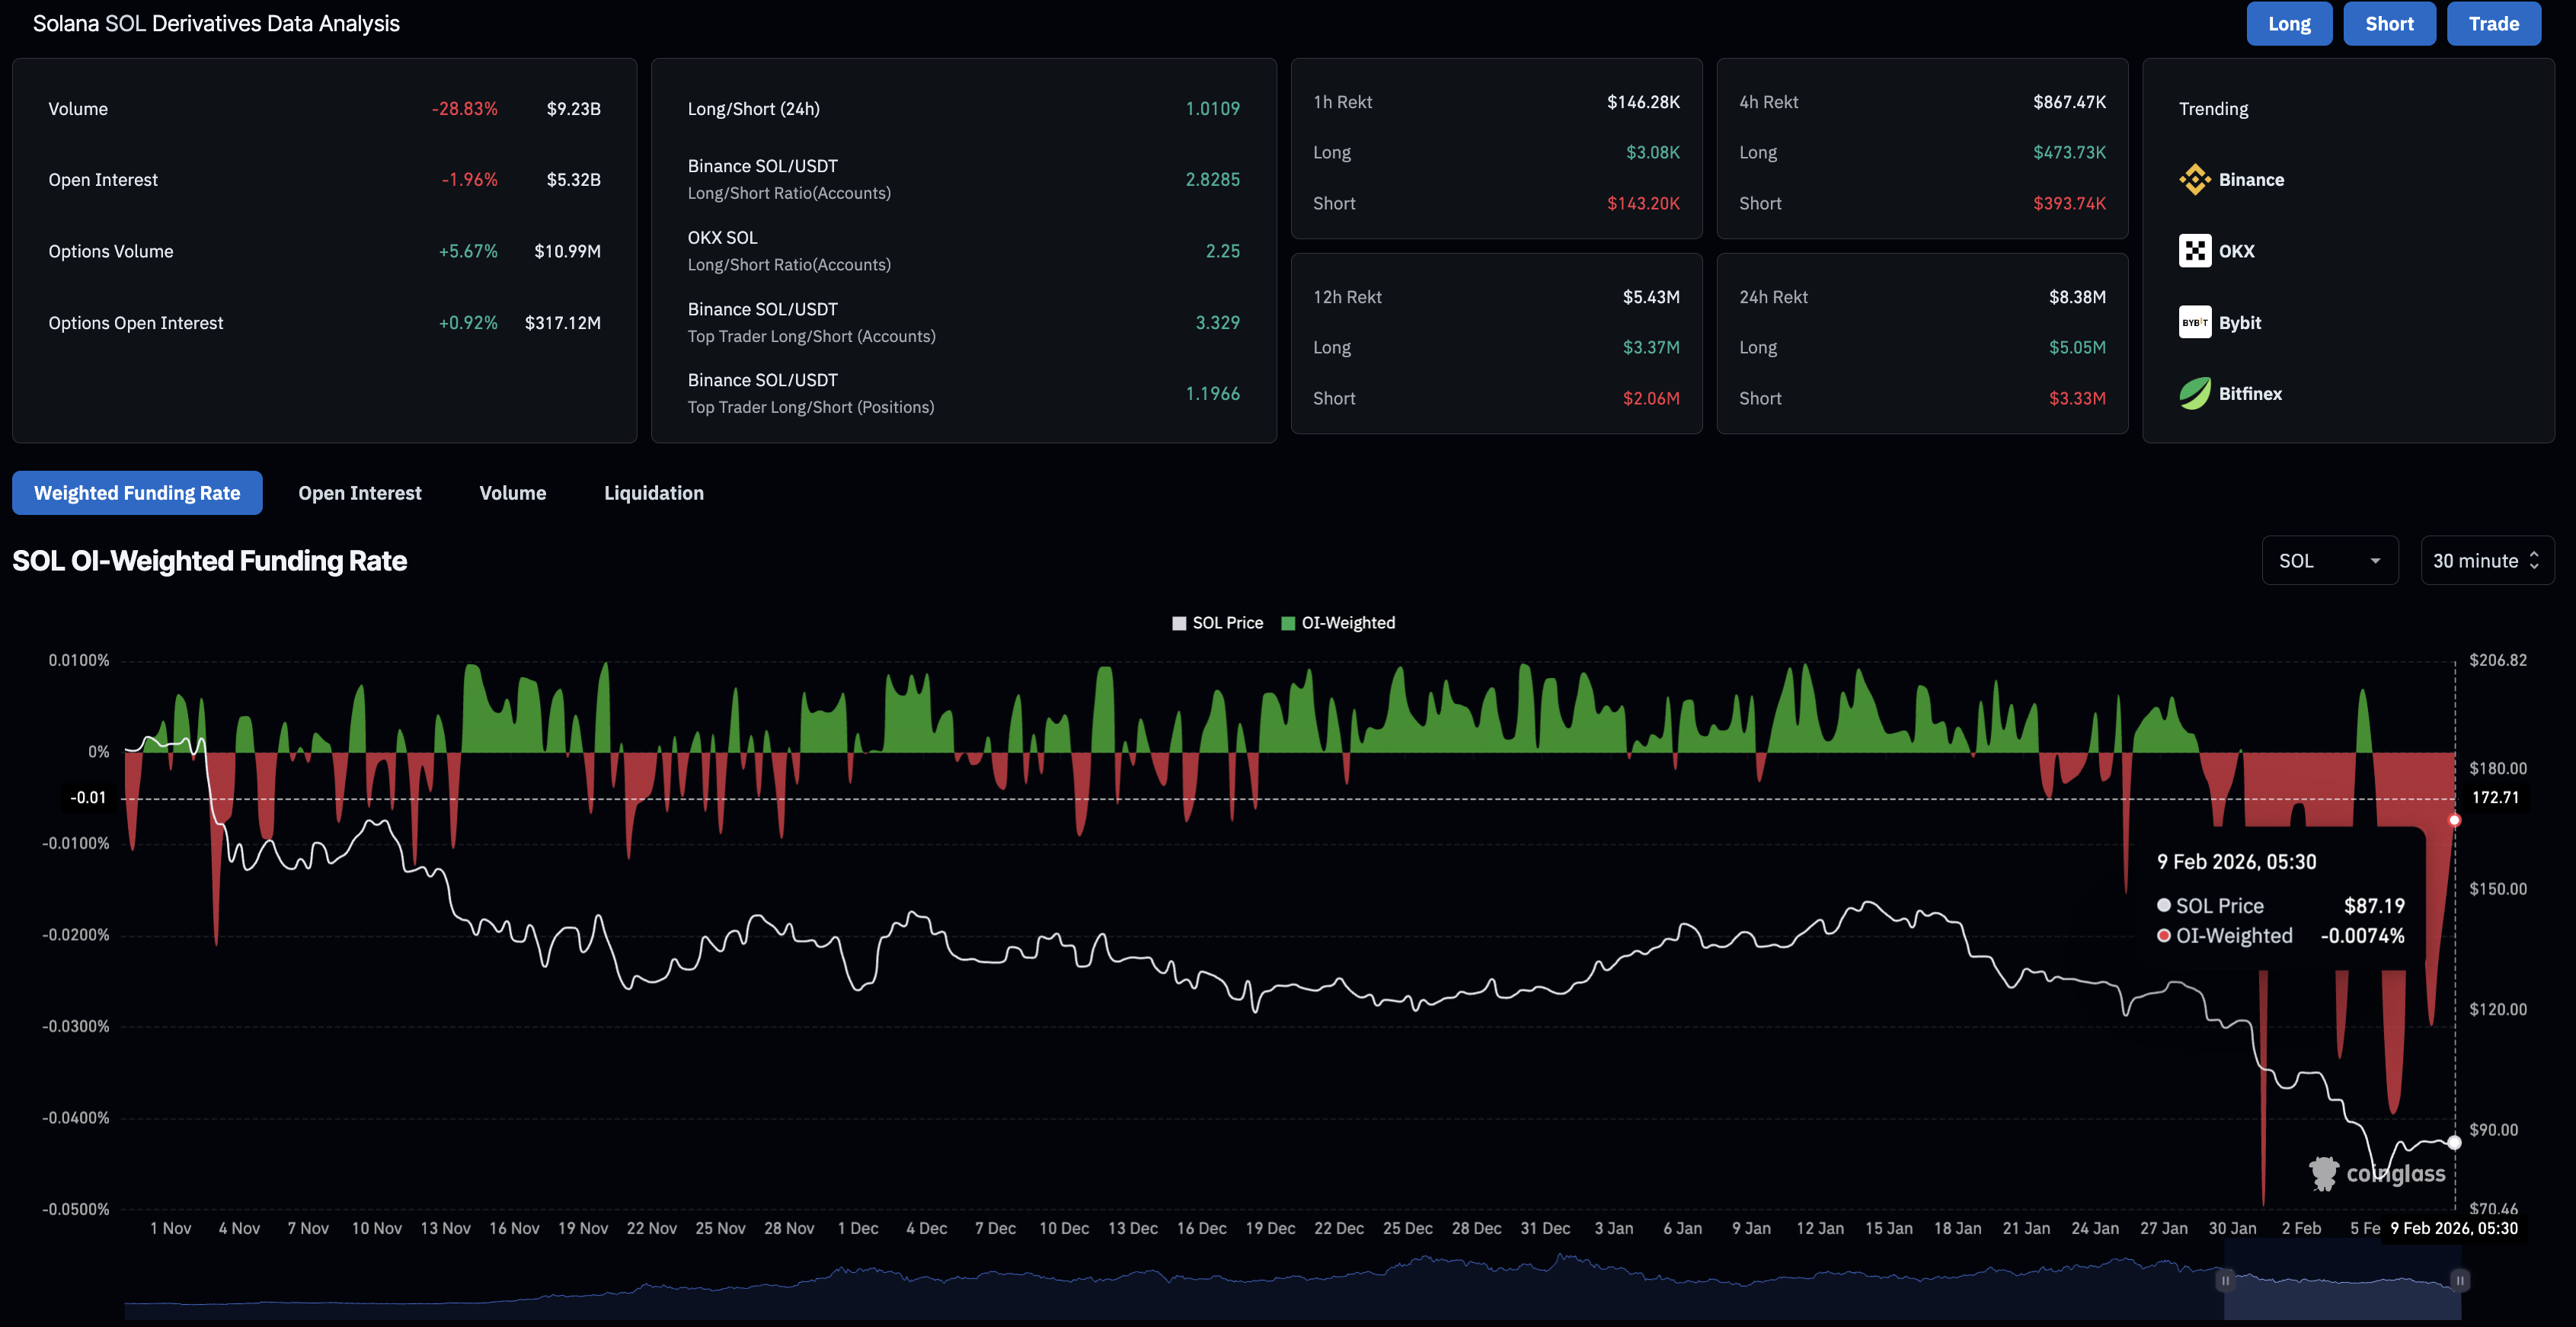
On the derivatives side, CoinGlass data shows the SOL futures Open Interest (OI) is down nearly 2% over the last 24 hours to $5.32 billion. A reduction in OI indicates lower capital exposure, as traders adopt a wait-and-see approach.
Consistent with the OI drop, SOL derivatives recorded $8.38 million in total liquidations over the last 24 hours, consisting of $5.05 million of long liquidations and $3.33 million of short liquidations. Similar liquidations across both ends of the market spectrum indicate increased volatility, keeping traders at bay.
Technical outlook: Will Solana resurface above $100?
Solana is trading far below the 50- and 200-day Exponential Moving Averages (EMAs), confirming a broader bearish bias. Minor recoveries in Solana could face supply pressure toward the shorter average line.
The Moving Average Convergence Divergence (MACD) on the daily chart has moved sideways after a steep decline last week, with the negative histogram contracting, suggesting fading bearish pressure. At the same time, the Relative Strength Index (RSI) at 29 remains oversold, hinting that a mean-reversion bounce could emerge, though momentum remains fragile.
The 23.6% and 38.2% Fibonacci retracement levels at $111 and $138, measured from the September 18 high at $253 to the February 6 low at $67, serve as nearby barriers to recovery. A daily close above the first retracement resistance would improve the tone.
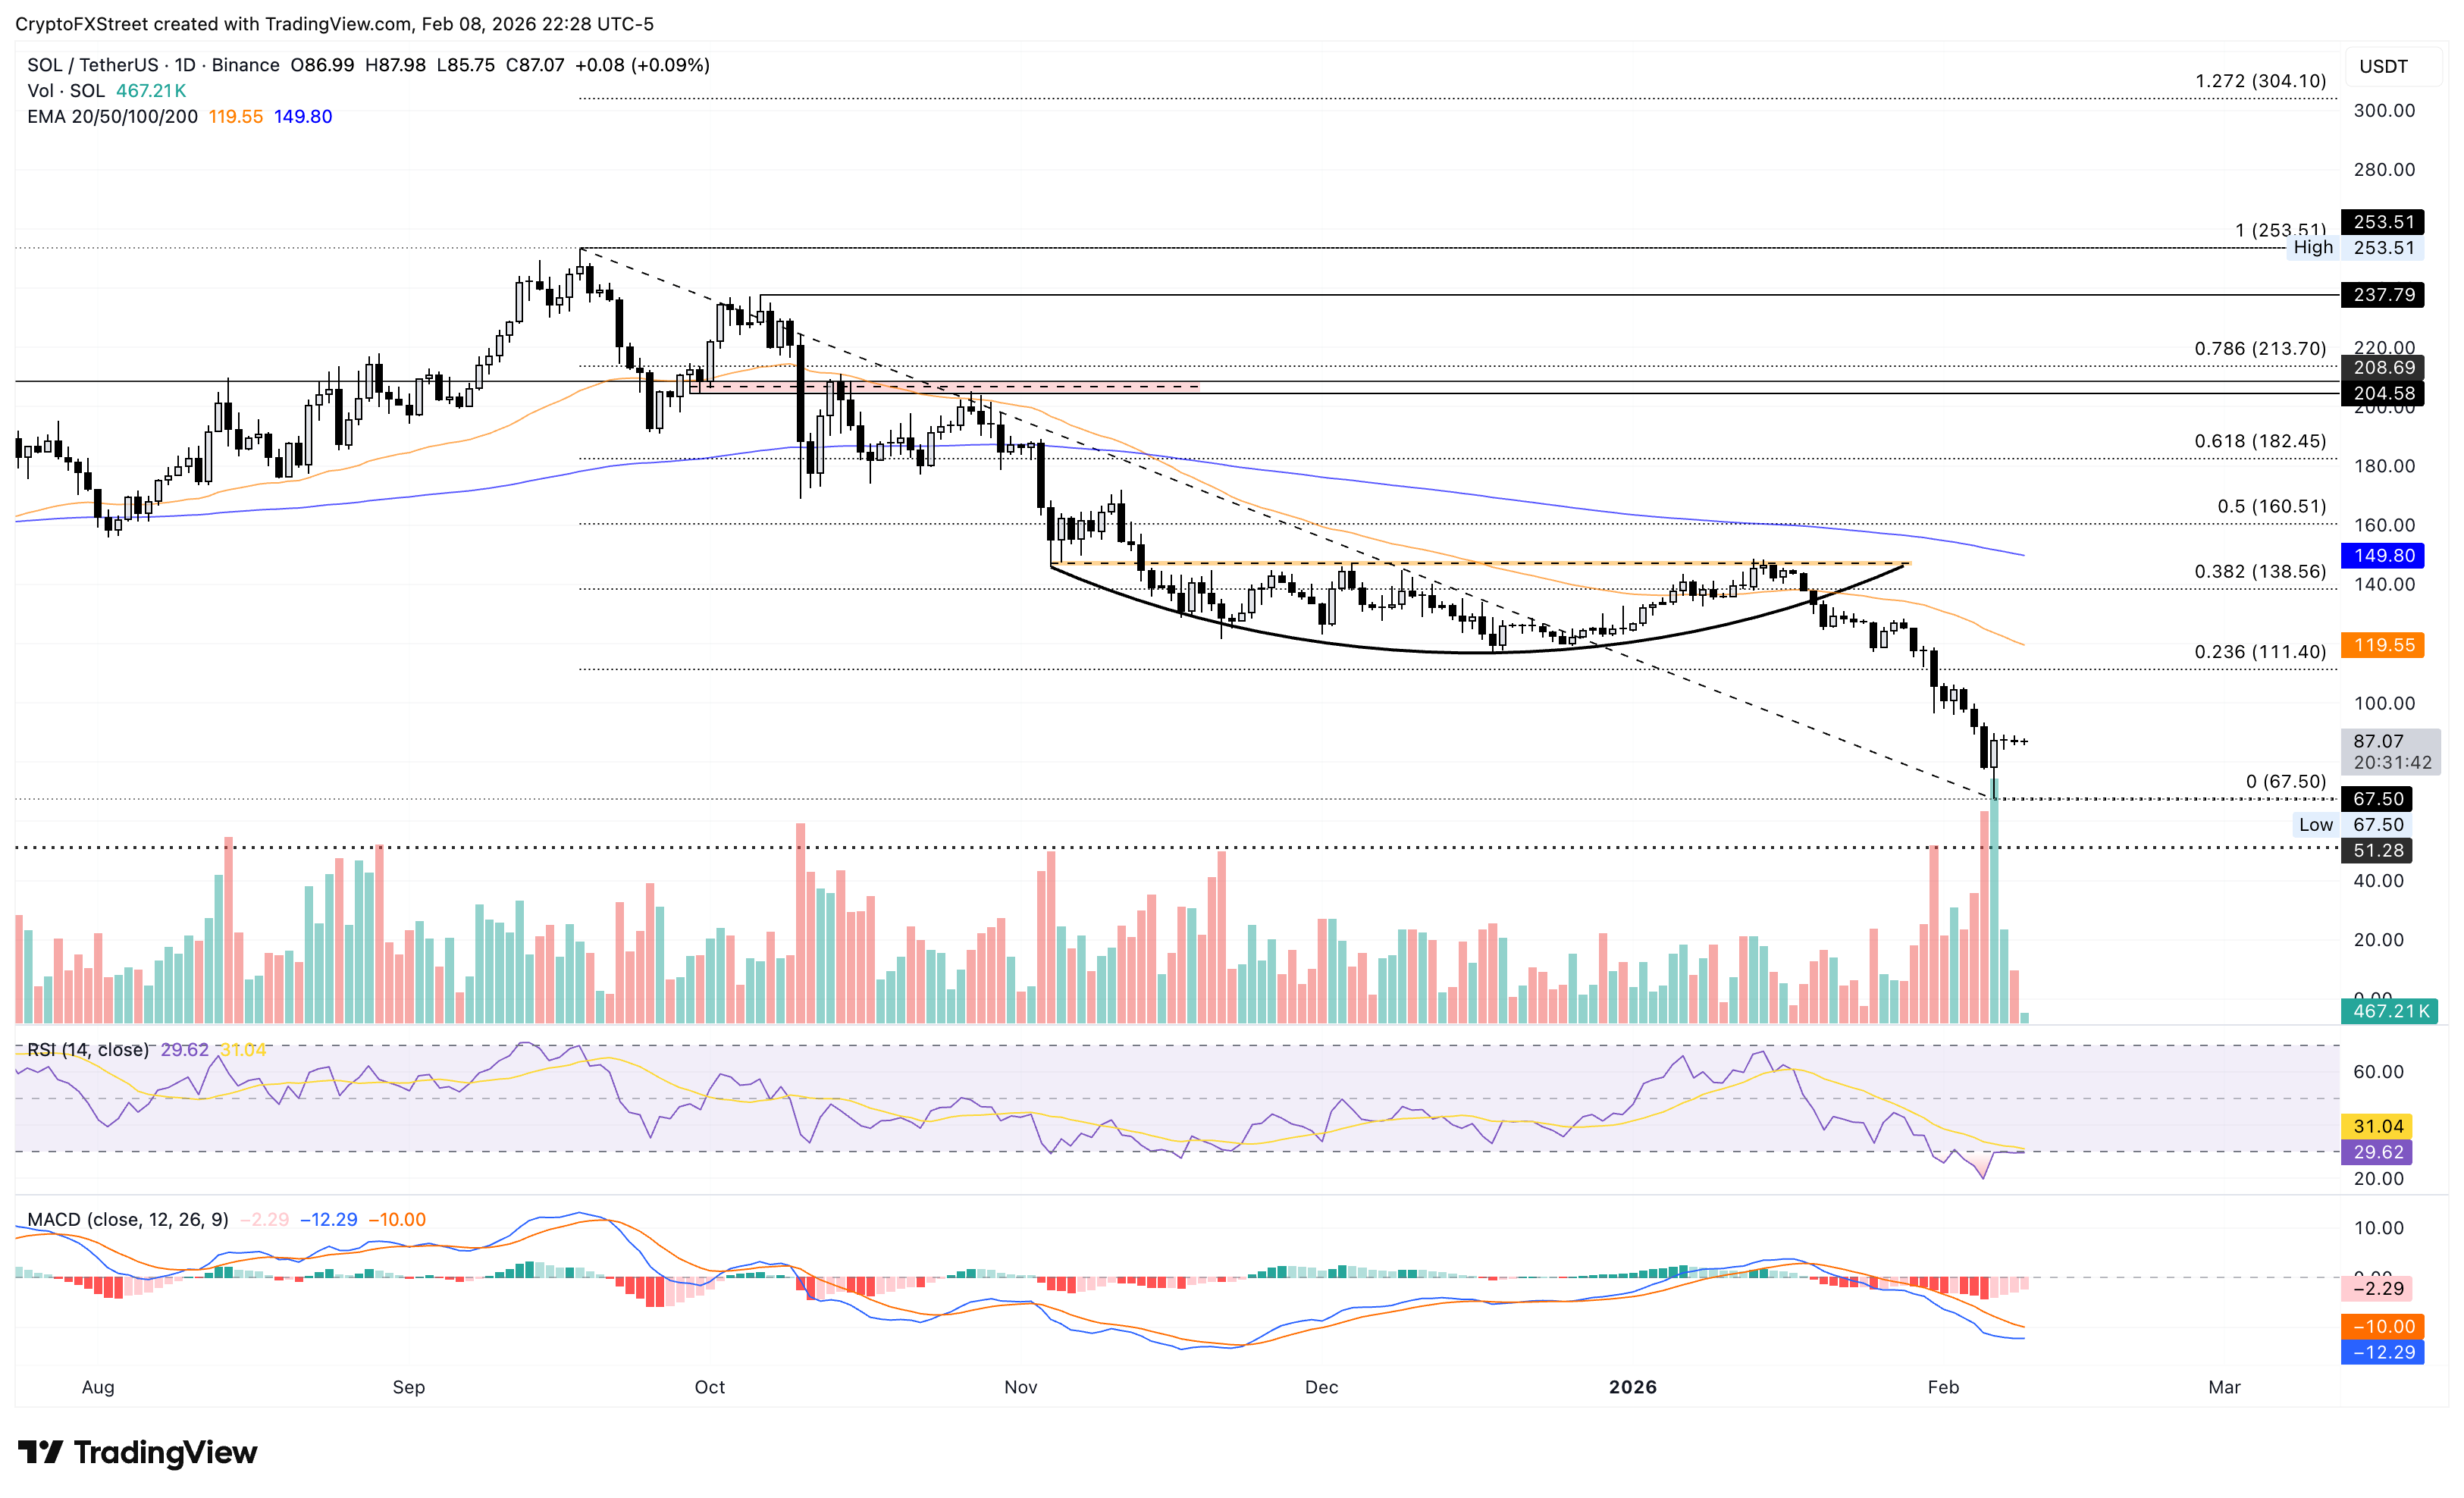
However, failing to clear $111 would keep recoveries capped and preserve downside risk, with immediate support at $67 and a deeper zone at $51, which previously helped drive a bounce back in November 2023.
(The technical analysis of this story was written with the help of an AI tool.)

超過一百萬用戶依賴 FXStreet 獲取即時市場數據、圖表工具、專家洞見與外匯新聞。其全面的經濟日曆與教育網路研討會協助交易者保持資訊領先、做出審慎決策。FXStreet 擁有約 60 人的團隊,分布於巴塞隆納總部及全球各地。
閱讀更多


