
Stellar Price Forecast: Correction deepens with bearish signals prevailing
作者 Manish Chhetri
發布日期: 5 Feb 2026 | 修改日期: 5 Feb 2026


熱門文章

Stellar (XLM) price is extending its correction, trading below $0.167 at the time of writing on Thursday after being rejected at a key level. The derivatives data shows signs of weakness, with XLM’s short bets rising amid falling Open Interest (OI).
- Stellar price extends the correction on Thursday after a rejection at the previously broken trendline.
- Derivatives data indicates weakness, as short bets are rising alongside falling open interest.
- The technical outlook suggests bears are still in control, aiming for a deeper correction.
Stellar (XLM) price is extending its correction, trading below $0.167 at the time of writing on Thursday after being rejected at a key level. The derivatives data shows signs of weakness, with XLM’s short bets rising amid falling Open Interest (OI). On the technical side, bears remain in control, aiming for lower lows in XLM.
XLM’s derivatives data shows bearish bias
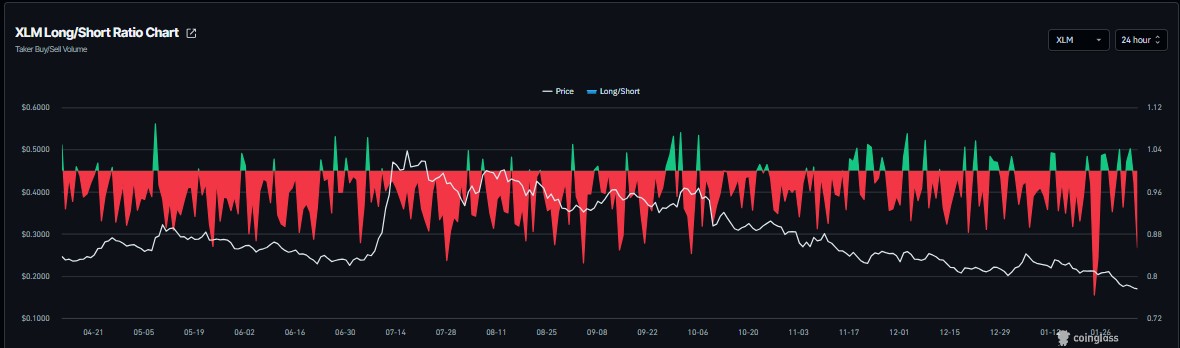
CoinGlass’s XLM long-to-short ratio stands at 0.85 on Thursday, nearing the lowest value in a month. This ratio, below one, reflects bearish sentiment in the markets, as more traders are betting on the asset price to fall.
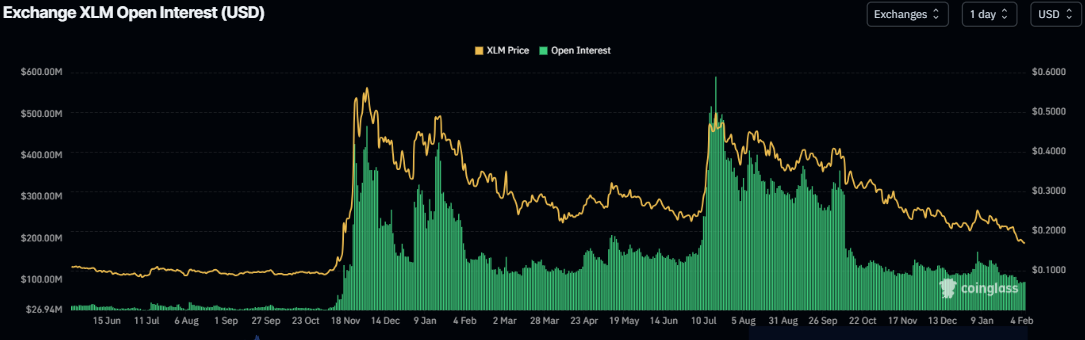
In addition, Stellar’s futures OI dropped to $95 million on Thursday, the lowest level since November 2024, and has been steadily falling since the start of this year. This drop in OI reflects waning investor participation and projects a bearish outlook.
Stellar Price Forecast: XLM extends correction after closing below key support
Stellar price declined more than 13% last week, closing below the lower trendline of the falling wedge pattern on Saturday. XLM has been rejected around this broken trendline through Wednesday, extending losses to over 5%. As of Thursday, XLM is trading at $0.169.
If XLM continues its correction, it could extend the drop toward the 2025 yearly low of $0.160, set on October 10.
The Relative Strength Index (RSI) reads 26 on the daily chart, an oversold condition, indicating strong bearish momentum. The Moving Average Convergence Divergence (MACD) also showed a bearish crossover in mid-January, which remains intact with rising red histogram bars below the neutral level, further supporting the negative outlook.
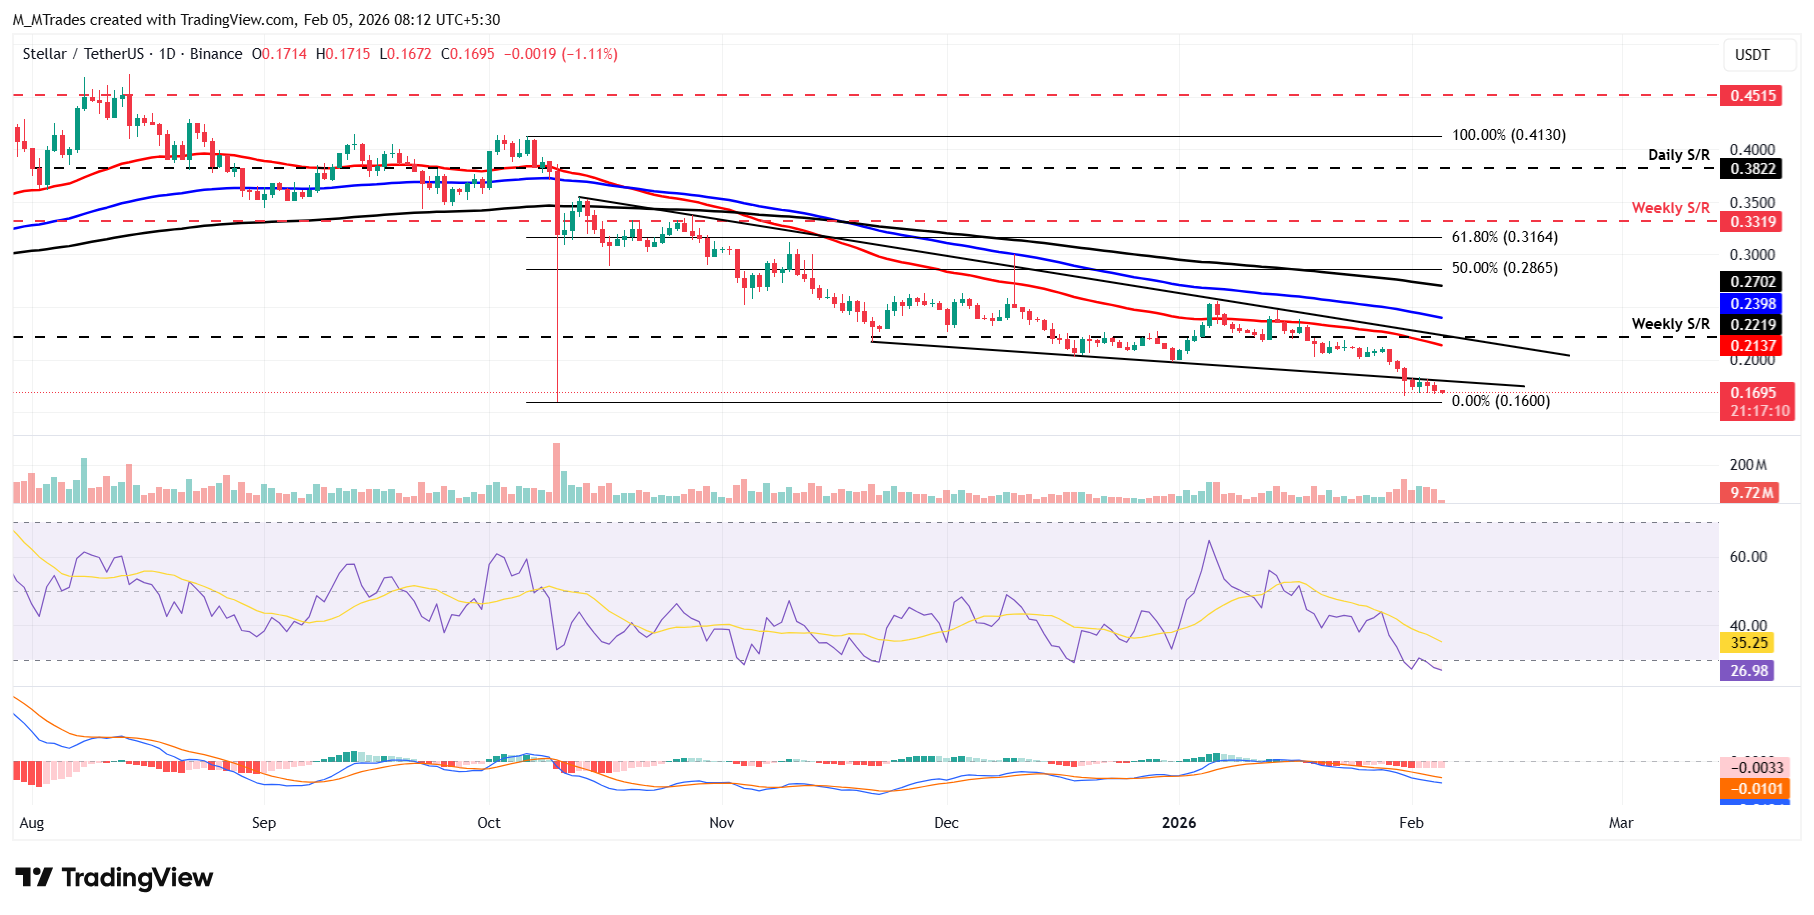
On the other hand, if XLM recovers, it could extend the advance toward the lower trendline boundary at around $0.180.

超過一百萬用戶依賴 FXStreet 獲取即時市場數據、圖表工具、專家洞見與外匯新聞。其全面的經濟日曆與教育網路研討會協助交易者保持資訊領先、做出審慎決策。FXStreet 擁有約 60 人的團隊,分布於巴塞隆納總部及全球各地。
閱讀更多


