
Stellar Price Forecast: XLM risks deeper losses as derivatives metrics turn negative
作者 Manish Chhetri
發布日期: 3 Mar 2026 | 修改日期: 3 Mar 2026


熱門文章

Stellar (XLM) is trading red below $0.16 at the time of writing on Tuesday, after a slight recovery the previous day. Weakening derivatives data caps the recovery, while an unfavorable technical outlook projects a deeper correction for the XLM token in the upcoming days.
- Stellar price trades in red on Tuesday after a slight recovery on the previous day.
- Derivatives data caps the recovery, with XLM’s funding rates negative, short positions rising and falling open interest, signaling bearish sentiment.
- The broader technical structure remains under pressure, keeping the overall outlook tilted to the downside.
Stellar (XLM) is trading red below $0.16 at the time of writing on Tuesday, after a slight recovery the previous day. Weakening derivatives data caps the recovery, while an unfavorable technical outlook projects a deeper correction for the XLM token in the upcoming days.
Derivatives data shows bearish sentiment
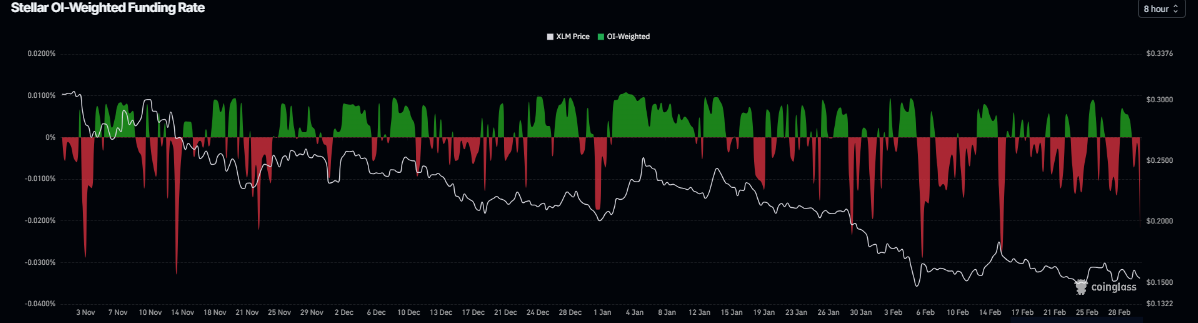
Stellar’s derivatives metrics support a bearish bias. CoinGlass funding rate metric flipped to a negative rate on Monday and stands at -0.021% on Tuesday, nearing levels seen during the mid-February market dip. These negative rates indicate shorts are paying longs, suggesting bearish sentiment toward XLM.
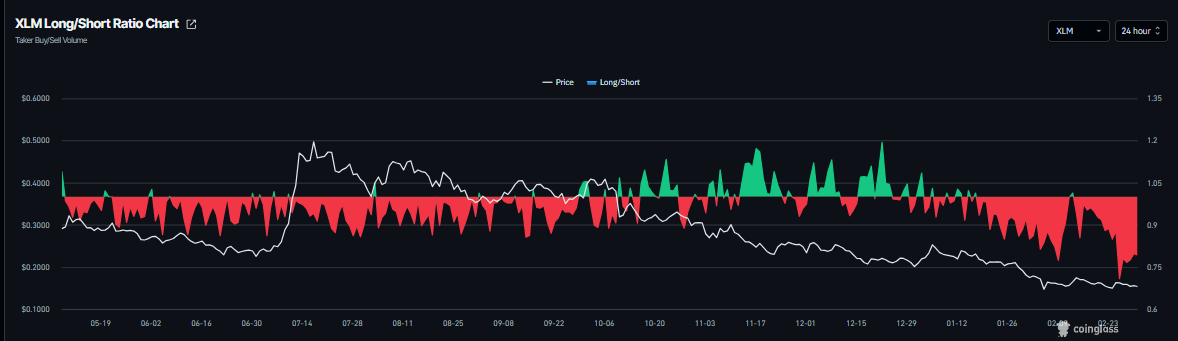
In addition, XLM’s long-to-short ratio stands at 0.79 on Tuesday, nearing its lowest level in over a month. This ratio below 1 indicates bearish sentiment as traders are betting on the Stellar price to fall.
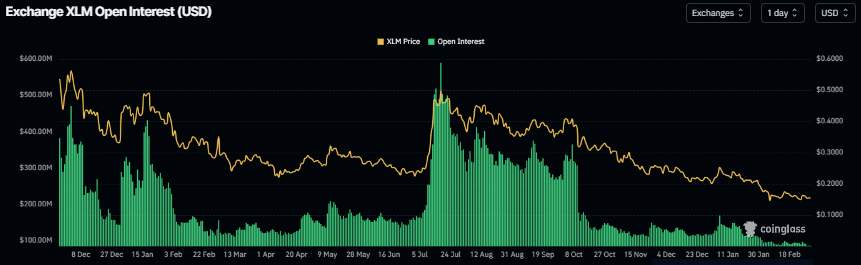
Stellar’s futures Open Interest (OI) falls to $84.87 million on Tuesday, having been steadily declining since early January and reaching levels not seen since mid-November 2024. This drop in OI reflects waning investor participation and projects a bearish outlook.
Stellar Price Forecast: XLM’s broader structure remains bearish
Stellar is trading at $0.15 as of writing on Tuesday. The near-term bias remains bearish, with price entrenched well below the 50-day and 100-day Exponential Moving Averages (EMAs), which continue to slope lower, underscoring a dominant downtrend.
The recent break back under the descending trend-line break area near $0.17 signals that sellers still control rebounds rather than a completed reversal. Momentum metrics echo this tone, as the Relative Strength Index (RSI) on the daily chart slips back toward the low-40s from mid-range readings while the Moving Average Convergence Divergence (MACD) indicator holds above the zero line but with a softening positive histogram, suggesting fading upside pressure within a broader bearish structure.
Immediate resistance aligns at $0.16, where recent highs converge with the broken trend-line region, followed by stronger resistance at the 23.6% Fibonacci retracement of the $0.13–$0.25 slide at $0.16 and then the 38.2% retracement at $0.18, which also sits near the last reaction peak.
On the downside, initial support emerges around $0.15, with a break exposing the prior swing low near $0.14 and then the Fibonacci origin zone toward $0.14–$0.13. As long as XLM remains capped below $0.16–$0.18, rallies would face supply, and the risk of a retest of the lower supports stays elevated.
(The technical analysis of this story was written with the help of an AI tool.)

超過一百萬用戶依賴 FXStreet 獲取即時市場數據、圖表工具、專家洞見與外匯新聞。其全面的經濟日曆與教育網路研討會協助交易者保持資訊領先、做出審慎決策。FXStreet 擁有約 60 人的團隊,分布於巴塞隆納總部及全球各地。
閱讀更多


