
Toncoin Price Forecast: TON bullish breakout confirmed as sentiment improves
作者 Manish Chhetri
發布日期: 25 Dec 2025 | 修改日期: 25 Dec 2025


熱門文章

Toncoin (TON) price is trading above $1.51 on Thursday after closing above the falling wedge pattern, which favours bulls. On-chain and derivatives data show a bullish bias, with large whale orders, rising bullish bets among traders, and buy-side dominance.
- Toncoin price breaks above the falling wedge pattern, signaling a bullish move ahead.
- On-chain and derivatives data support a bullish sentiment with large whale orders, rising bullish bets, and buy-side dominance.
- The technical outlook suggests upside, as momentum indicators signal a fading bearish trend.
Toncoin (TON) price is trading above $1.51 on Thursday after closing above the falling wedge pattern, which favours bulls. On-chain and derivatives data show a bullish bias, with large whale orders, rising bullish bets among traders, and buy-side dominance. On the technical side, momentum indicators suggest fading bearish strength, hinting at an upside move in the coming days.
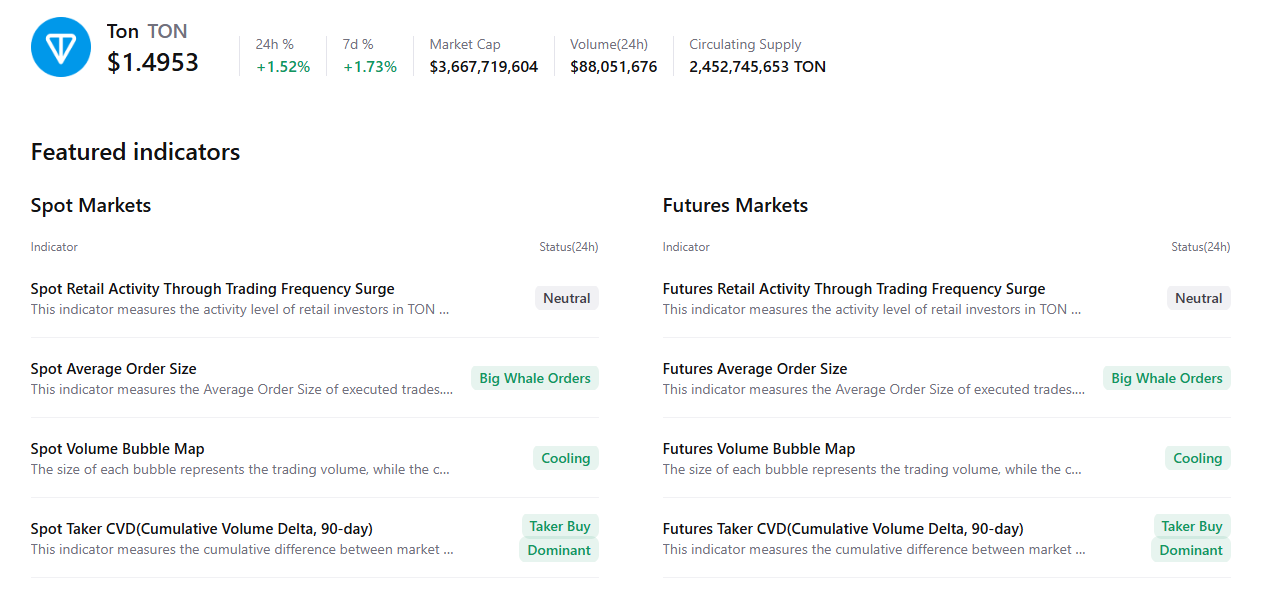
Toncoin’s on-chain and derivatives data suggest improving sentiment
CryptoQuant’s summary data point to a bullish outlook, as Toncoin’s spot and futures markets show large whale orders, cooling conditions, and buy dominance. All these factors signal an improving sentiment among traders, hinting at a potential rally in the upcoming days.
On the derivatives side, CoinGlass’s long-to-short ratio for Toncoin reads 1.14 on Thursday, nearing the monthly high. The ratio above one suggests bullish sentiment in the market, as traders are betting on the TON price to rally.

Toncoin Price Forecast: TON
Toncoin price closed above the falling wedge pattern (formed by connecting multiple highs and lows with two trendlines) on Wednesday. As of Thursday, TON is trading above $1.51.
If TON continues its upward trend, it could extend the rally toward the December 10 high of $1.70.
The Relative Strength Index (RSI) reads 44, pointing upward toward the neutral level of 50, indicating fading bearish momentum. For the bullish momentum to be sustained, the RSI must move above its neutral level. The Moving Average Convergence Divergence (MACD) indicator showed a bullish crossover on Tuesday, further supporting the positive outlook.
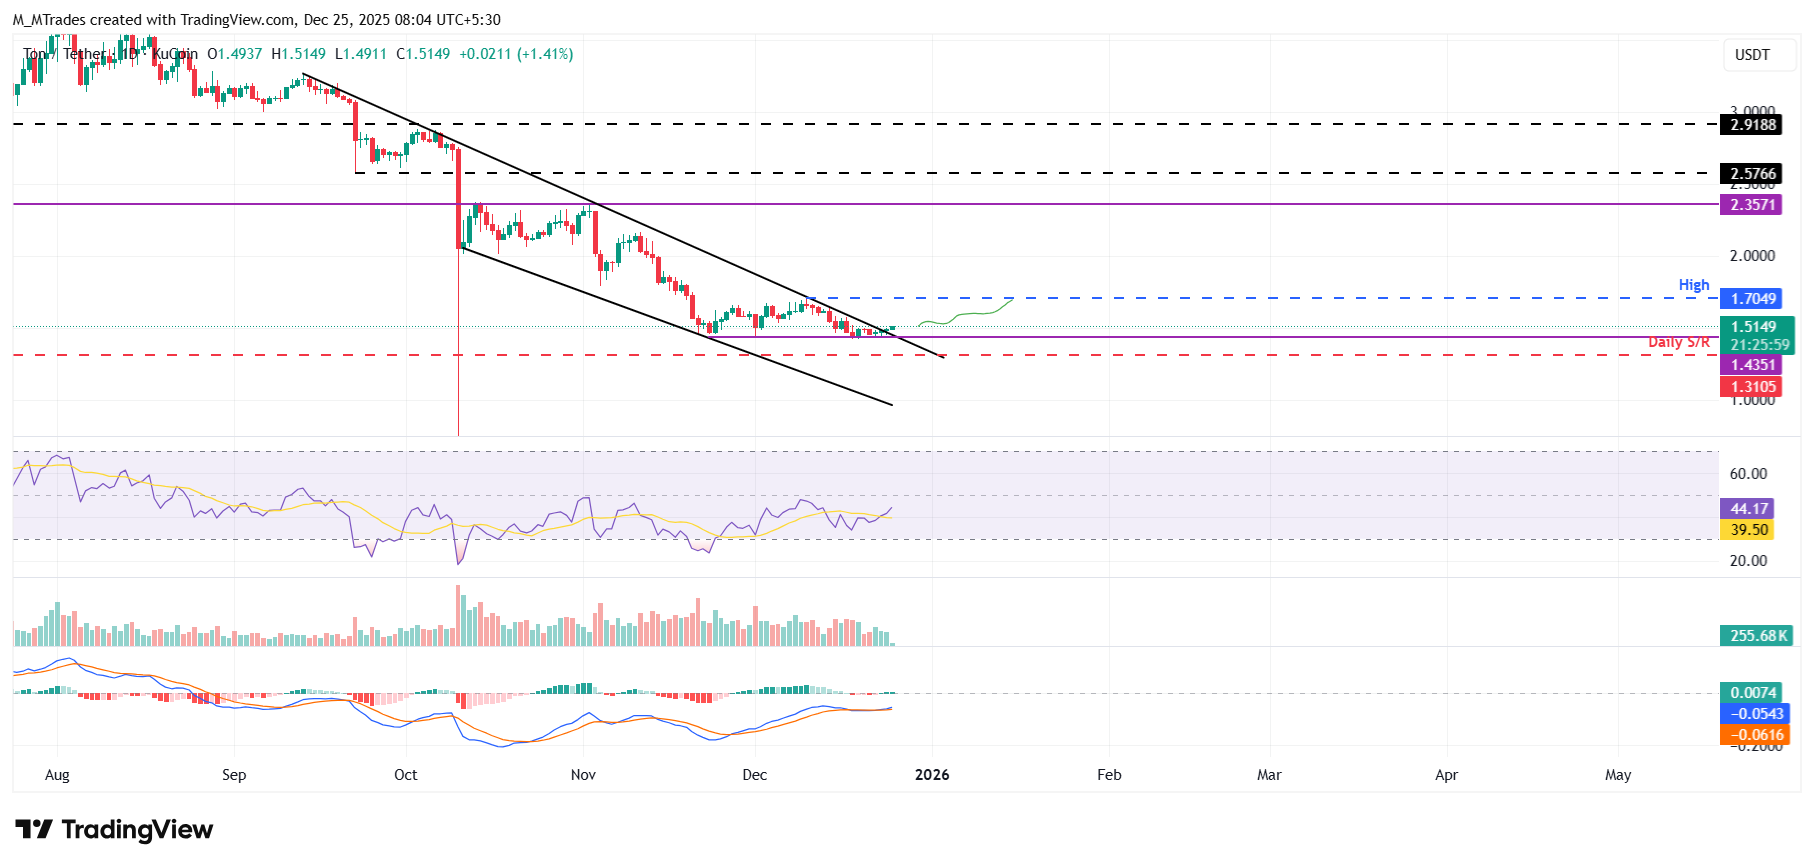
On the other hand, if TON faces a correction, it could extend the decline toward the daily support at $1.43.

超過一百萬用戶依賴 FXStreet 獲取即時市場數據、圖表工具、專家洞見與外匯新聞。其全面的經濟日曆與教育網路研討會協助交易者保持資訊領先、做出審慎決策。FXStreet 擁有約 60 人的團隊,分布於巴塞隆納總部及全球各地。
閱讀更多


