
Top 3 Price Prediction: Bitcoin, Ethereum, Ripple – BTC, ETH and XRP consolidate within key ranges as selling pressure eases
作者 Manish Chhetri
發布日期: 16 Feb 2026 | 修改日期: 16 Feb 2026


熱門文章

Bitcoin (BTC) and Ethereum (ETH) prices have been trading sideways within key ranges following the massive correction. Meanwhile, XRP (Ripple) recovers slightly, breaking above the key resistance zone.
- Bitcoin price consolidates between $65,700 and $72,000 over the last nine days.
- Ethereum price trades sideways between $1,700 and $2,150, signaling indecision among traders.
- XRP hovers around $1.47 after breaking above the lower trendline boundary, hinting at a potential recovery.
Bitcoin (BTC) and Ethereum (ETH) prices have been trading sideways within key ranges following the massive correction. Meanwhile, XRP (Ripple) recovers slightly, breaking above the key resistance zone. The top three cryptocurrencies hint at a potential short-term recovery, with momentum indicators showing fading bearish signs.
Bitcoin trades sideways within $65,700 and $72,000 range
Bitcoin price has been consolidating between $65,729 and $71,746 since February 7. As of Monday, BTC is trading in the $68,376 range.
If BTC breaks above the upper consolidation range at $71,746, it could extend the recovery toward the daily resistance at $73,072.
The Relative Strength Index (RSI) on the daily chart reads 35, rebounding from oversold levels, signaling an easing of bearish momentum. The Moving Average Convergence Divergence (MACD) showed a bullish crossover on Sunday, further supporting the recovery thesis.
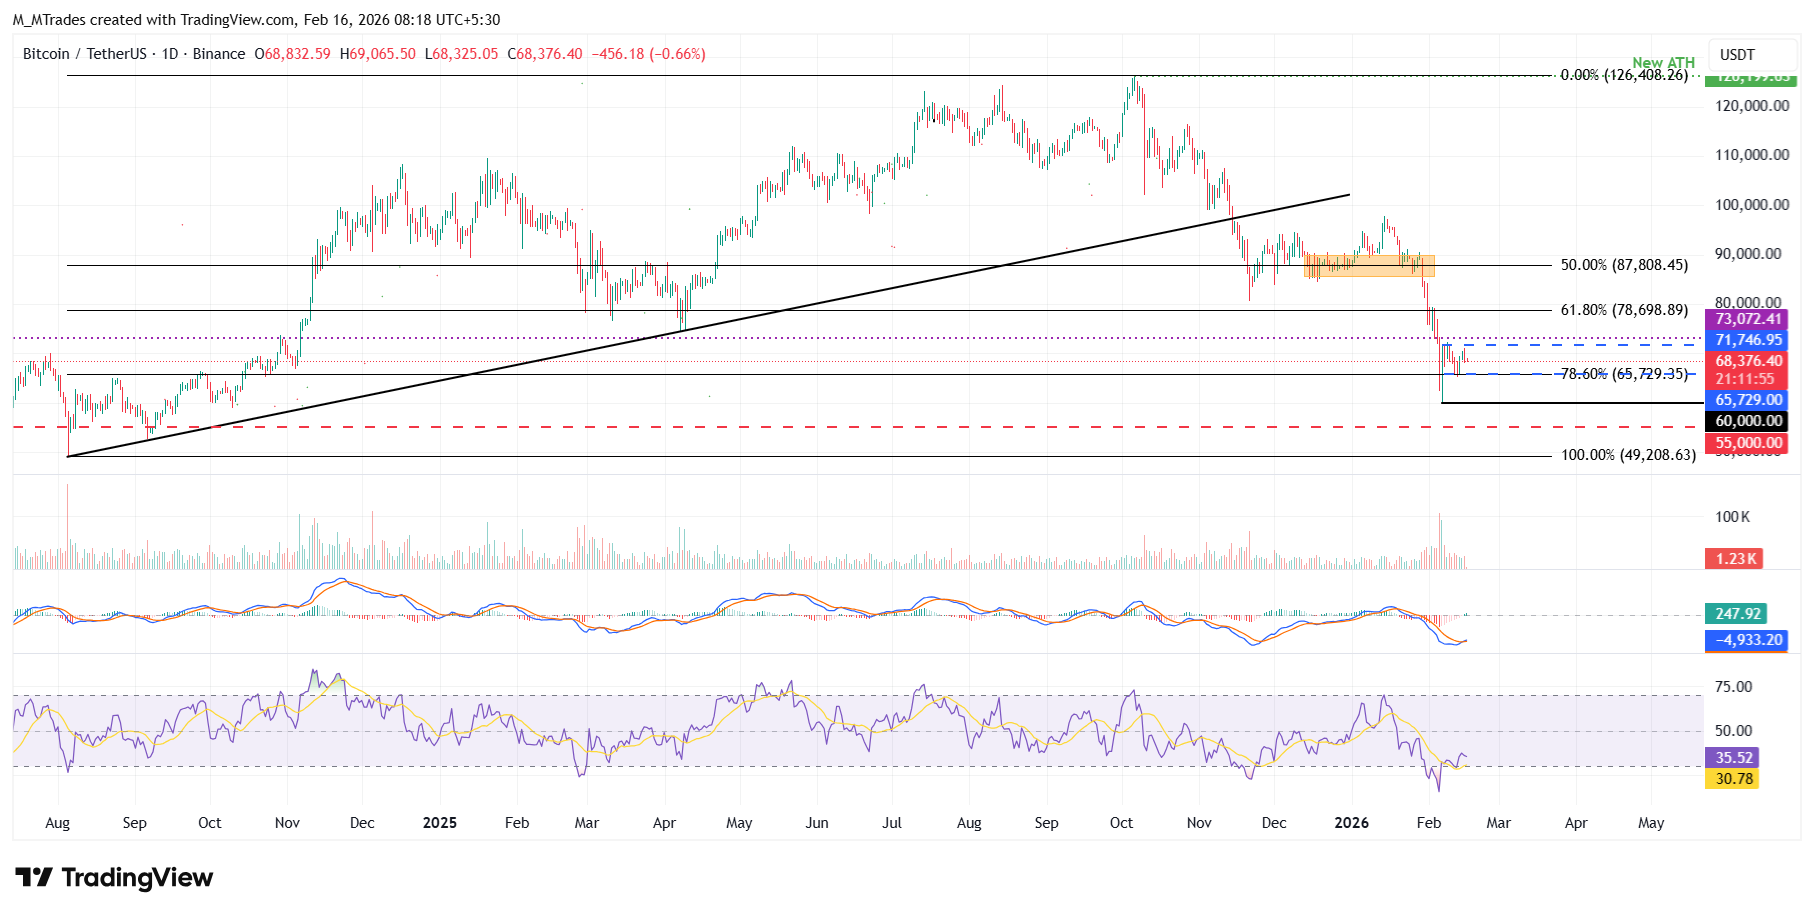
On the other hand, if BTC closes below the lower consolidation level at $65,729, it could extend the decline toward the key support level at $60,000.
Ethereum faces rejection around the upper consolidation zone
Ethereum price faced rejection near the upper consolidation range at $2,149 on Sunday and declined 5.75% that day. As of Monday, ETH is trading at $1,957.
If ETH closes above the upper consolidation range at $2,149, it could extend the recovery toward the next key resistance at $2,400.
Like Bitcoin, Ethereum’s RSI and MACD indicators show fading bearish momentum, hinting at a short-term recovery thesis.
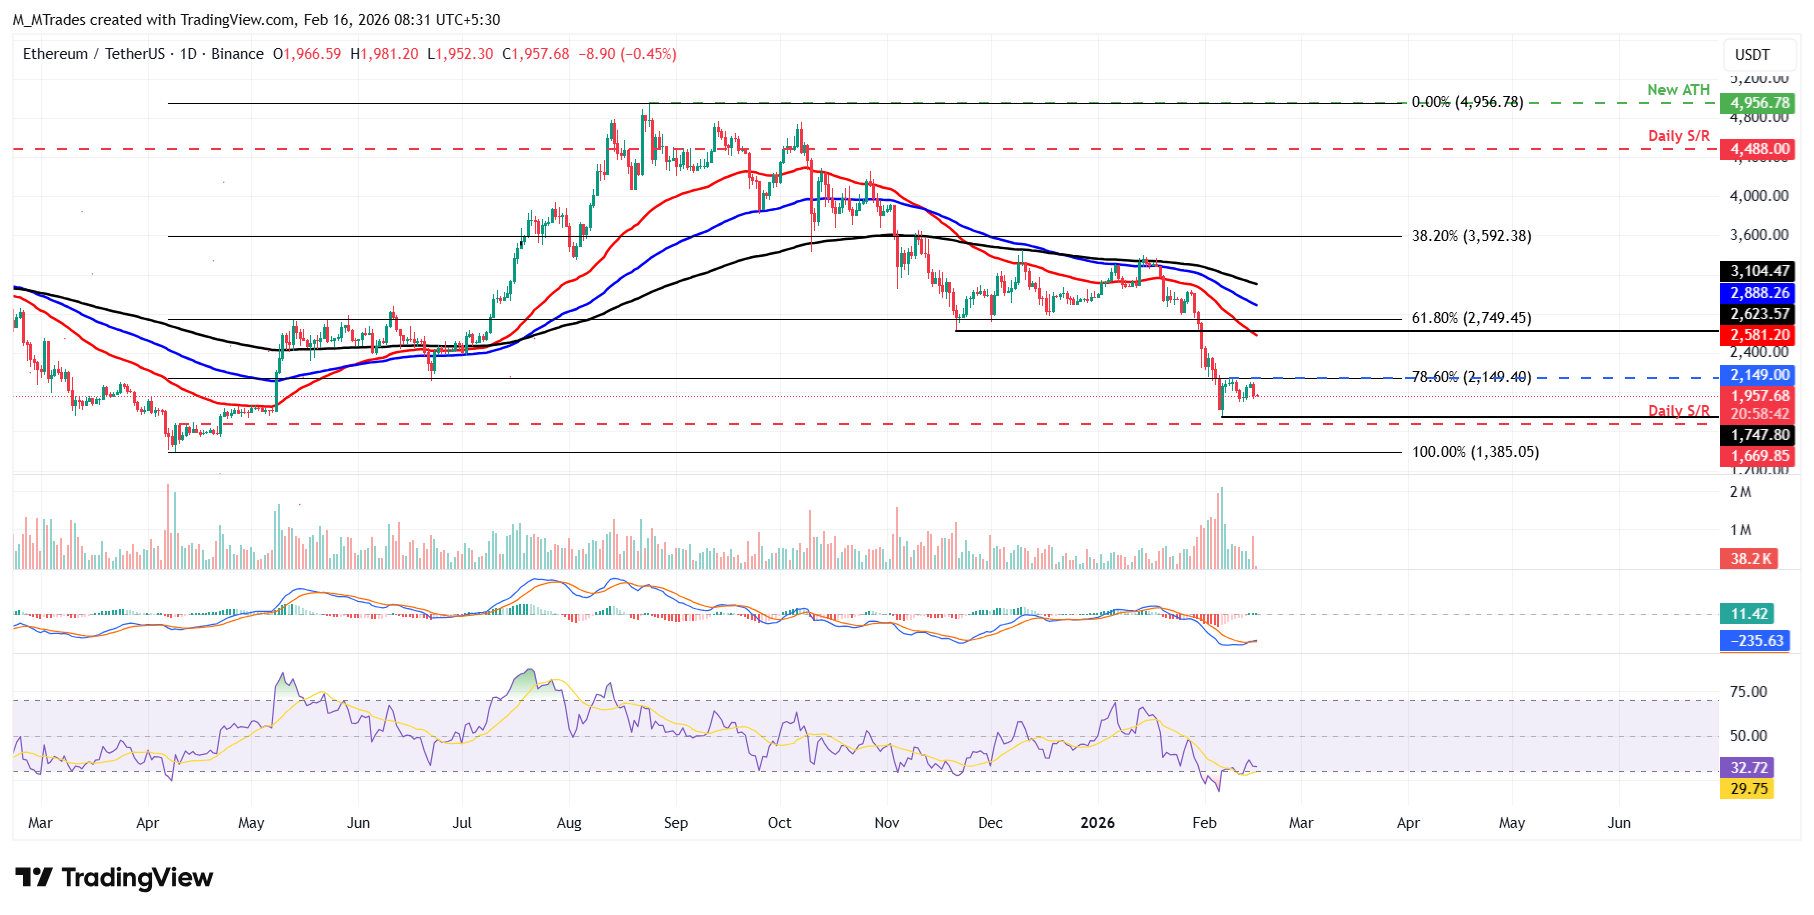
However, if ETH faces a correction, it could extend the correction toward the lower consolidation range at $1,747.
XRP breaks above the lower trendline boundary
XRP broke above the lower trendline boundary of a falling wedge on Saturday and declined slightly the next day, finding support around it. As of Monday, XRP is trading around $1.45.
If the lower trendline boundary holds as support, it could extend the recovery toward the 50-day Exponential Moving Average (EMA) at $1.73.
Like Bitcoin and Ethereum, XRP’s momentum indicators (RSI and MACD) are also signaling a recovery.
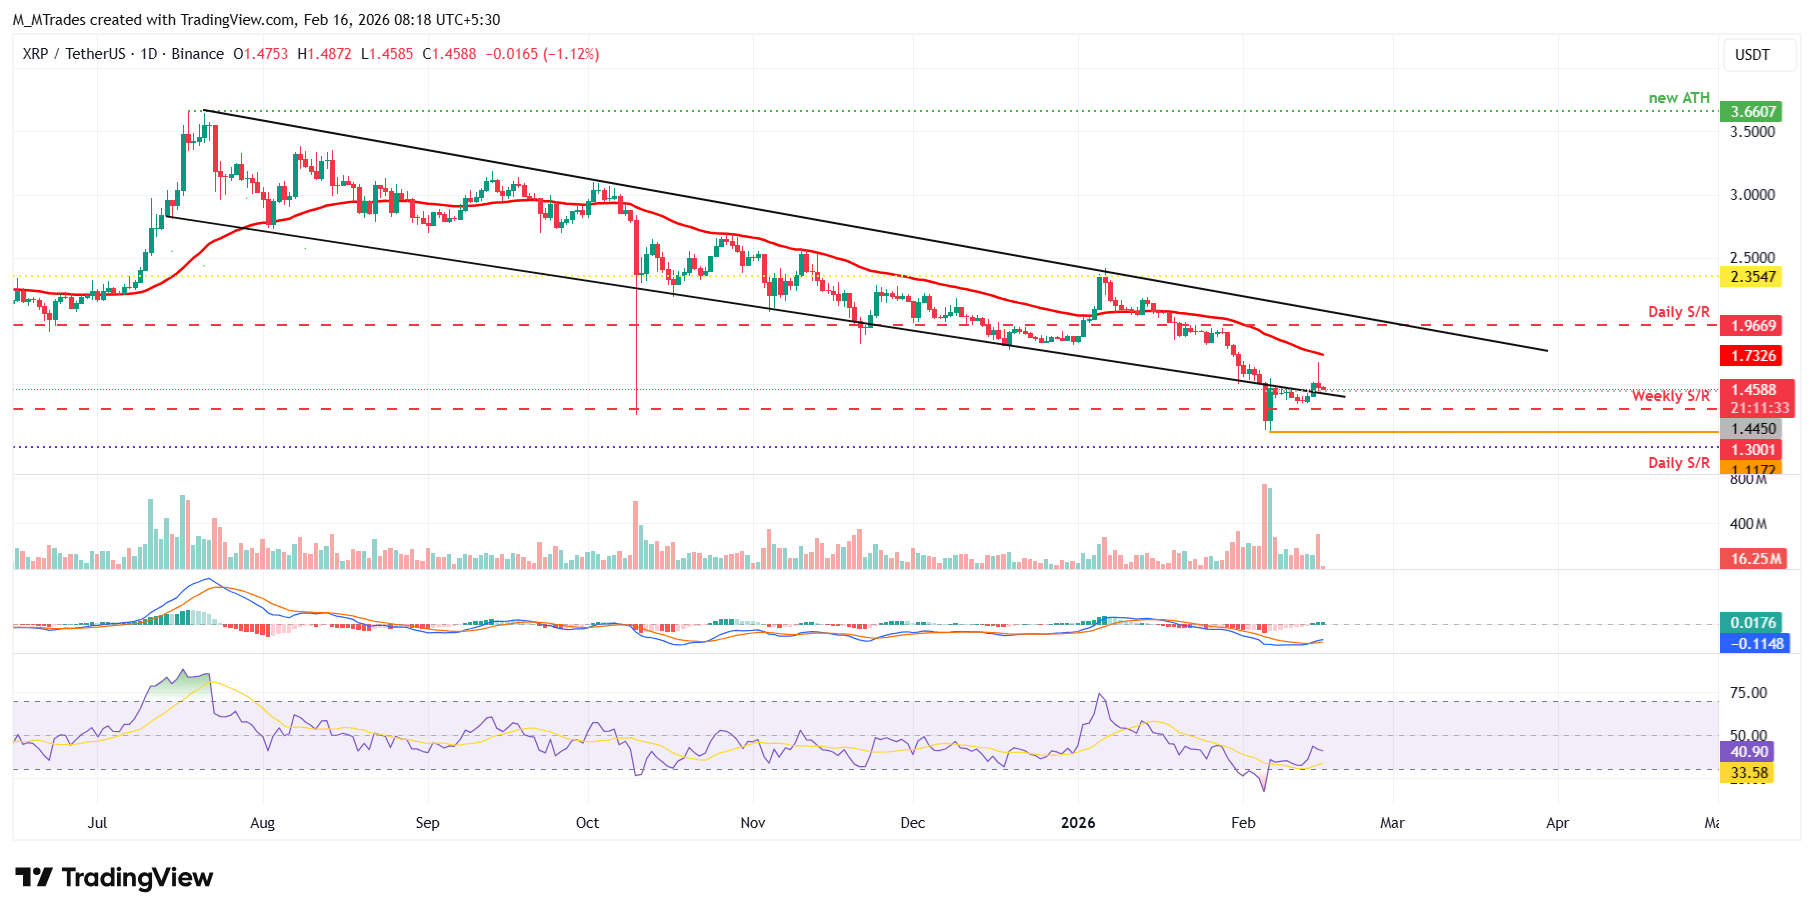
On the other hand, if XRP slips below the lower trendline, it could extend the decline toward the weekly support at $1.30.
Cryptocurrency prices FAQs
Token launches influence demand and adoption among market participants. Listings on crypto exchanges deepen the liquidity for an asset and add new participants to an asset’s network. This is typically bullish for a digital asset.
A hack is an event in which an attacker captures a large volume of the asset from a DeFi bridge or hot wallet of an exchange or any other crypto platform via exploits, bugs or other methods. The exploiter then transfers these tokens out of the exchange platforms to ultimately sell or swap the assets for other cryptocurrencies or stablecoins. Such events often involve an en masse panic triggering a sell-off in the affected assets.
Macroeconomic events like the US Federal Reserve’s decision on interest rates influence crypto assets mainly through the direct impact they have on the US Dollar. An increase in interest rate typically negatively influences Bitcoin and altcoin prices, and vice versa. If the US Dollar index declines, risk assets and associated leverage for trading gets cheaper, in turn driving crypto prices higher.
Halvings are typically considered bullish events as they slash the block reward in half for miners, constricting the supply of the asset. At consistent demand if the supply reduces, the asset’s price climbs.

超過一百萬用戶依賴 FXStreet 獲取即時市場數據、圖表工具、專家洞見與外匯新聞。其全面的經濟日曆與教育網路研討會協助交易者保持資訊領先、做出審慎決策。FXStreet 擁有約 60 人的團隊,分布於巴塞隆納總部及全球各地。
閱讀更多


