
USD/CHF Price Forecast: Rebounds on firm USD, targets 0.7800
作者 Christian Borjon Valencia
發布日期: 27 Feb 2026 | 修改日期: 27 Feb 2026


熱門文章

USD/CHF recovers some ground on Thursday, rising some 0.19% as the Greenback appreciates and bounces off daily lows beneath 0.7700 on solid US data. At the time of writing, the pair trades at 0.7743, yet it remains shy of the key resistance level seen at 0.7817, the February 2 daily peak.
- USD/CHF climbs 0.19% as solid US data revives Dollar demand.
- Price tests triangle resistance near 0.7760, with RSI still below neutral.
- Break above 0.7800 exposes 50-day SMA, while drop under 0.7700 risks 0.7600.
USD/CHF recovers some ground on Thursday, rising some 0.19% as the Greenback appreciates and bounces off daily lows beneath 0.7700 on solid US data. At the time of writing, the pair trades at 0.7743, yet it remains shy of the key resistance level seen at 0.7817, the February 2 daily peak.
USD/CHF Price Forecast: Technical outlook
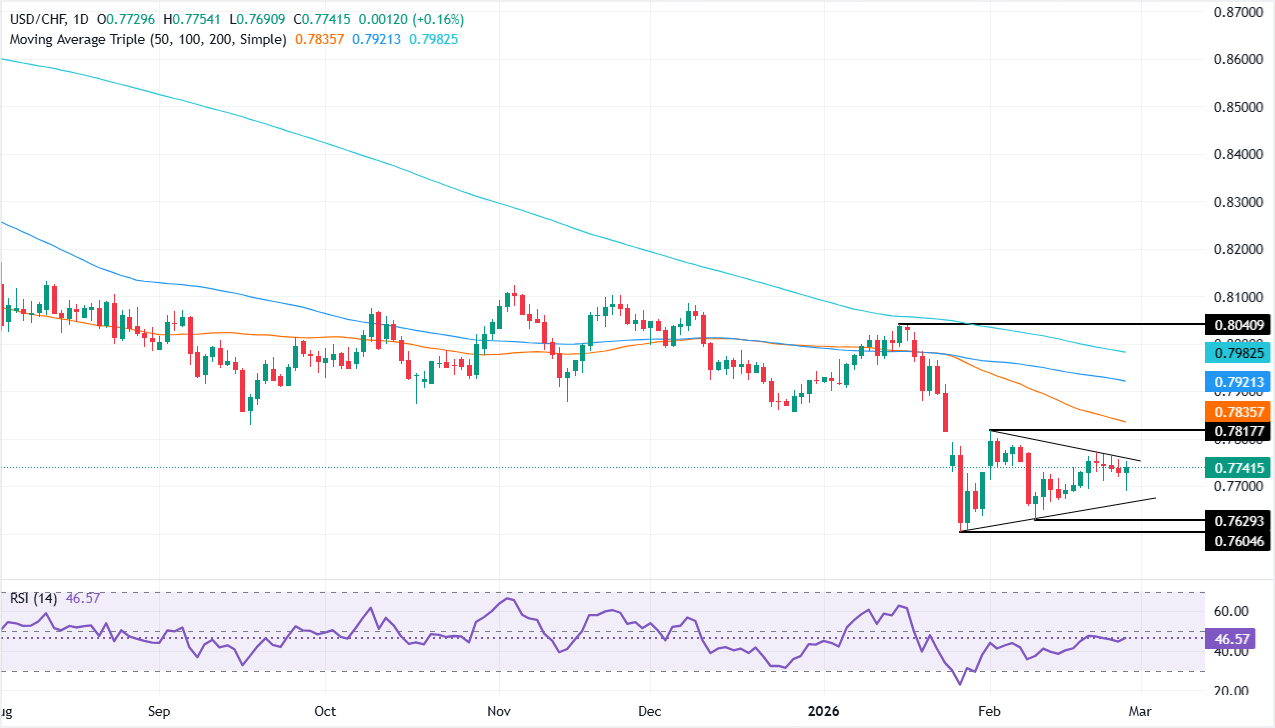
The USD/CHF technical picture shows some consolidation within a symmetrical triangle on a downtrend, yet price action seems closer to the resistance trendline of the chart pattern, which, if broken, would clear the way for further upside. However, momentum seems tilted to the downside as depicted by the Relative Strength Index (RSI) below its neutral level.
For a bearish continuation, a break below 0.7700 is needed to challenge the key support trendline of the triangle at around 0.7650-0.7665. On further weakness, the next stop would be 0.7600 ahead of the August 2011 low of 0.7069.
For a bullish reversal, buyers need to clear the triangle’s resistance trendline at around 0.7760-75, ahead of 0.7800. Additional gains lie overhead at the 50-day SMA at 0.7835, ahead of the 100-day SMA at 0.7921.
USD/CHF Price Chart – Daily
Swiss Franc Price This week
The table below shows the percentage change of Swiss Franc (CHF) against listed major currencies this week. Swiss Franc was the strongest against the Japanese Yen.
| USD | EUR | GBP | JPY | CAD | AUD | NZD | CHF | |
|---|---|---|---|---|---|---|---|---|
| USD | 0.01% | 0.02% | 0.78% | 0.07% | -0.37% | -0.07% | -0.07% | |
| EUR | -0.01% | 0.01% | 0.76% | 0.06% | -0.38% | -0.07% | -0.06% | |
| GBP | -0.02% | -0.01% | 0.93% | 0.05% | -0.43% | -0.09% | -0.06% | |
| JPY | -0.78% | -0.76% | -0.93% | -0.70% | -1.12% | -0.77% | -0.83% | |
| CAD | -0.07% | -0.06% | -0.05% | 0.70% | -0.43% | -0.08% | -0.12% | |
| AUD | 0.37% | 0.38% | 0.43% | 1.12% | 0.43% | 0.32% | 0.33% | |
| NZD | 0.07% | 0.07% | 0.09% | 0.77% | 0.08% | -0.32% | 0.02% | |
| CHF | 0.07% | 0.06% | 0.06% | 0.83% | 0.12% | -0.33% | -0.02% |
The heat map shows percentage changes of major currencies against each other. The base currency is picked from the left column, while the quote currency is picked from the top row. For example, if you pick the Swiss Franc from the left column and move along the horizontal line to the US Dollar, the percentage change displayed in the box will represent CHF (base)/USD (quote).

超過一百萬用戶依賴 FXStreet 獲取即時市場數據、圖表工具、專家洞見與外匯新聞。其全面的經濟日曆與教育網路研討會協助交易者保持資訊領先、做出審慎決策。FXStreet 擁有約 60 人的團隊,分布於巴塞隆納總部及全球各地。
閱讀更多


