
USD/CHF Price Forecasts: Support at 0.7740 keeps holding bears
作者 Guillermo Alcala
發布日期: 5 Feb 2026 | 修改日期: 5 Feb 2026


熱門文章

The US Dollar is flat against the Swiss Franc on Thursday, trading around 0.7780 at the time of writing.
- USD/CHF trades flat near 0.7780 after bouncing from 0.7740 lows
- The Greenback's recovery lost momentum following mixed US economic data.
- Elliott Wave analysis suggests an A-B-C correction towards the 0.7880 area.
The US Dollar is flat against the Swiss Franc on Thursday, trading around 0.7780 at the time of writing. The pair’s recovery from last week’s lows has been capped at 0.7818, but downside attempts remain limited above 0.7740, which keeps the immediate bullish trend in play.
The US Dollar rally, however, has lost momentum following Wednesday’s mixed US data. The ADP Employment report revealed that job creation slumped in January, offsetting better-than-expected US ISM Services PMI figures, which also showed an unexpected slowdown in labour demand.
Technical Analysis: Potential A-B-C correction towards the 0.7880 area
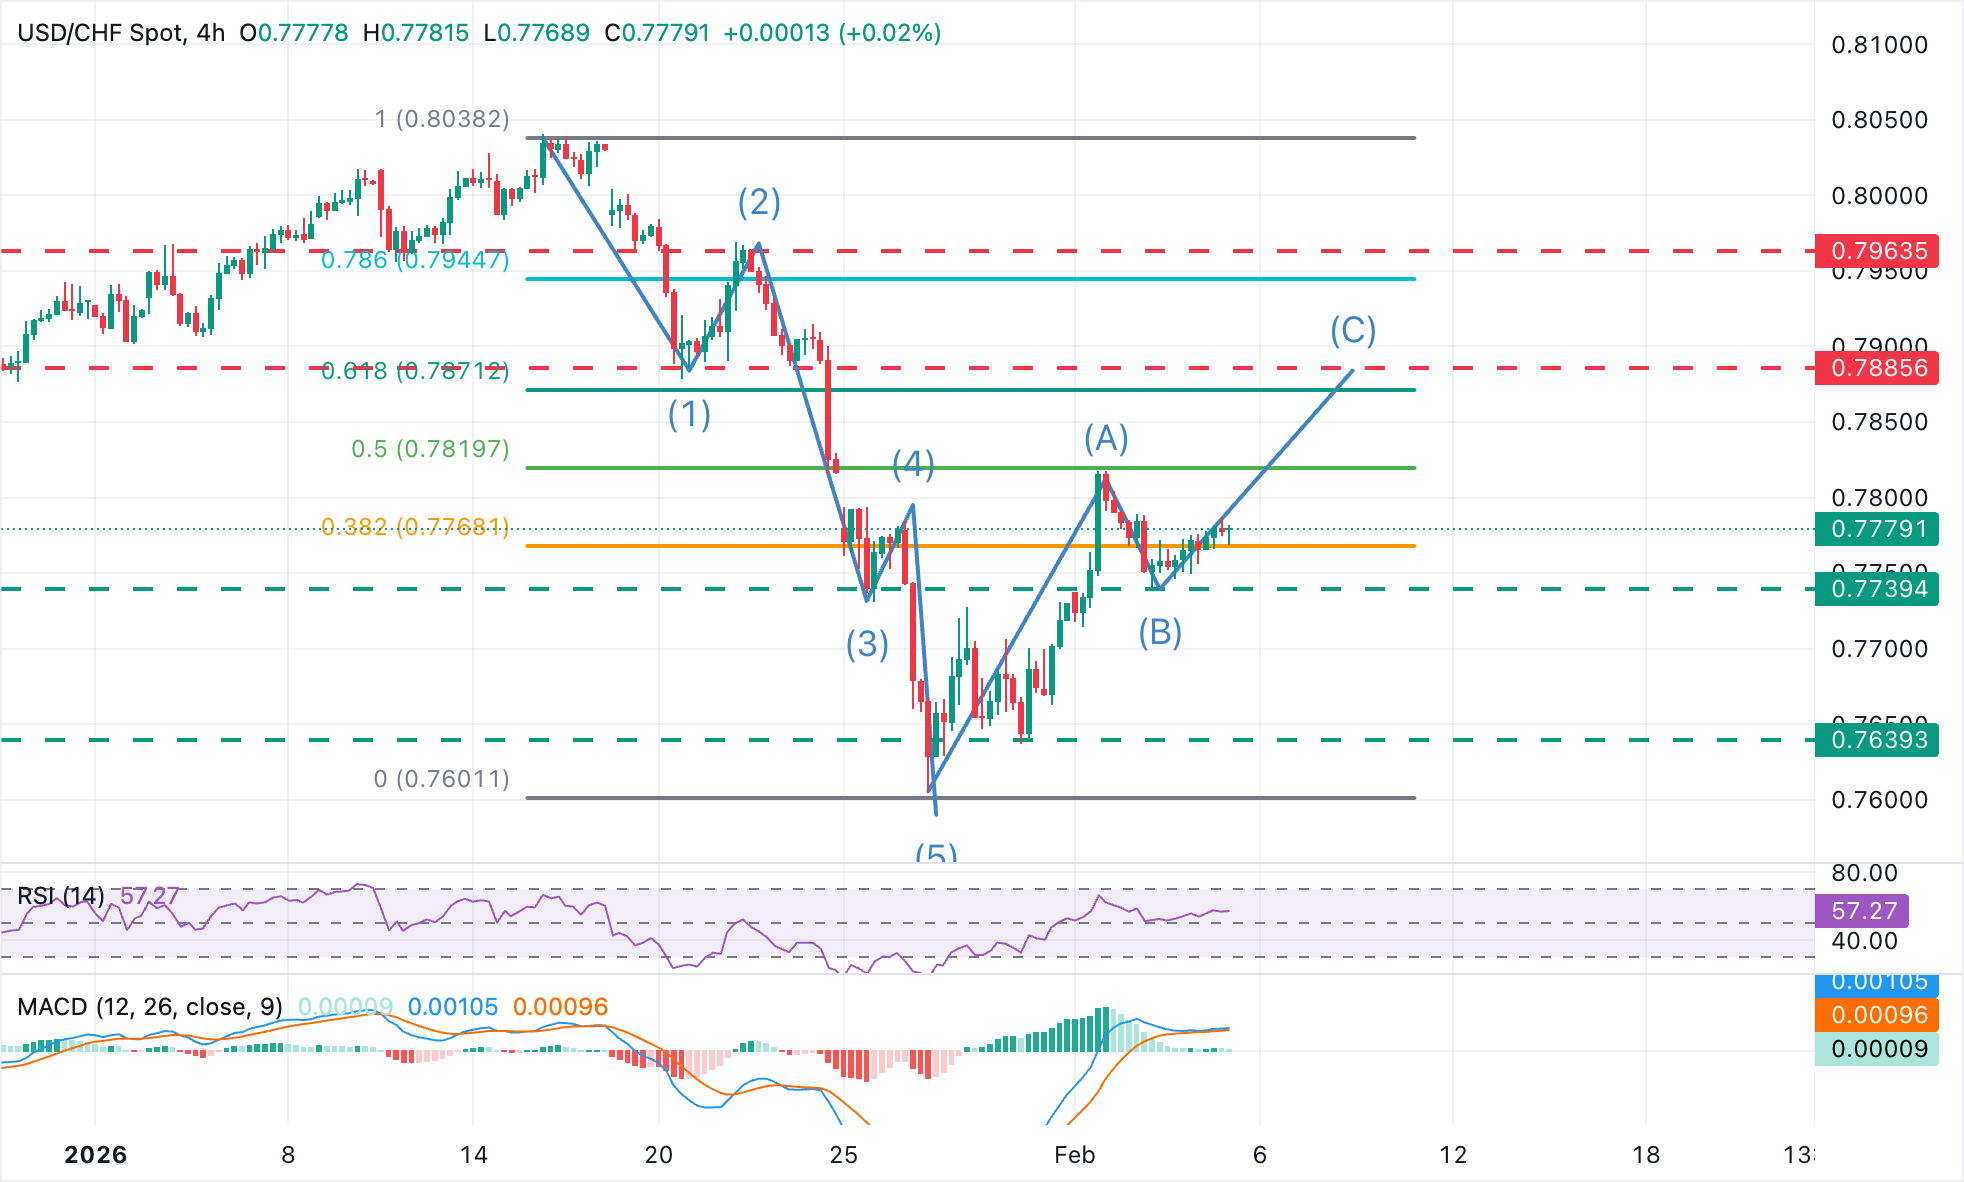
The USD/CHF is looking for direction with technical indicators showing a neutral-to-positive bias. The Moving Average Convergence Divergence (MACD) in the 4-hour chart highlights a fading bullish momentum, while the Relative Strength Index (RSI) remains above the 50 midline, reinforcing a modest upside bias.
Elliott Wave Analysis would suggest that the pair is in an A-B-C corrective impulse heading beyond February 2 highs at 0.7820 towards the resistance area between the 61.8% Fibonacci retracement level, at 0.7870, and the January 20 and 22 lows, near 0.7885.
On the downside, a confirmation below support at the 0.7740 area (February 3 low) invalidates this view and would increase pressure towards the January 30 low, near 0,7640.
(The technical analysis of this story was written with the help of an AI tool.)
US Dollar Price Today
The table below shows the percentage change of US Dollar (USD) against listed major currencies today. US Dollar was the strongest against the British Pound.
| USD | EUR | GBP | JPY | CAD | AUD | NZD | CHF | |
|---|---|---|---|---|---|---|---|---|
| USD | 0.17% | 0.59% | 0.25% | 0.23% | 0.42% | 0.33% | 0.14% | |
| EUR | -0.17% | 0.42% | 0.07% | 0.06% | 0.26% | 0.16% | -0.03% | |
| GBP | -0.59% | -0.42% | -0.34% | -0.36% | -0.16% | -0.26% | -0.45% | |
| JPY | -0.25% | -0.07% | 0.34% | -0.03% | 0.18% | 0.06% | -0.11% | |
| CAD | -0.23% | -0.06% | 0.36% | 0.03% | 0.20% | 0.10% | -0.09% | |
| AUD | -0.42% | -0.26% | 0.16% | -0.18% | -0.20% | -0.11% | -0.29% | |
| NZD | -0.33% | -0.16% | 0.26% | -0.06% | -0.10% | 0.11% | -0.19% | |
| CHF | -0.14% | 0.03% | 0.45% | 0.11% | 0.09% | 0.29% | 0.19% |
The heat map shows percentage changes of major currencies against each other. The base currency is picked from the left column, while the quote currency is picked from the top row. For example, if you pick the US Dollar from the left column and move along the horizontal line to the Japanese Yen, the percentage change displayed in the box will represent USD (base)/JPY (quote).

超過一百萬用戶依賴 FXStreet 獲取即時市場數據、圖表工具、專家洞見與外匯新聞。其全面的經濟日曆與教育網路研討會協助交易者保持資訊領先、做出審慎決策。FXStreet 擁有約 60 人的團隊,分布於巴塞隆納總部及全球各地。
閱讀更多


