
Chainlink Price Forecast: Rising momentum fuels rally after Grayscale ETF launch
作者 Vishal Dixit
發布日期: 3 Dec 2025 | 修改日期: 3 Dec 2025


熱門文章

Chainlink (LINK) rises by almost 7% at press time on Wednesday, underpinned by the launch of Grayscale’s LINK Exchange Traded Fund (ETF) on Tuesday. Derivatives data show an increase in retail interest, as futures Open Interest jumps by over 20% in the last 24 hours.
- Chainlink gains nearly 7% on Wednesday, adding to Tuesday’s 11% surge.
- LINK futures Open Interest builds up following Grayscale’s ETF launch on Tuesday.
- The technical outlook remains bullish as LINK inches closer to surpassing the Supertrend indicator line, which would confirm a trend reversal.
Chainlink (LINK) rises by almost 7% at press time on Wednesday, underpinned by the launch of Grayscale’s LINK Exchange Traded Fund (ETF) on Tuesday. Derivatives data show an increase in retail interest, as futures Open Interest jumps by over 20% in the last 24 hours. The technical outlook is bullish as LINK gains traction and aims to surpass the Supertrend line.
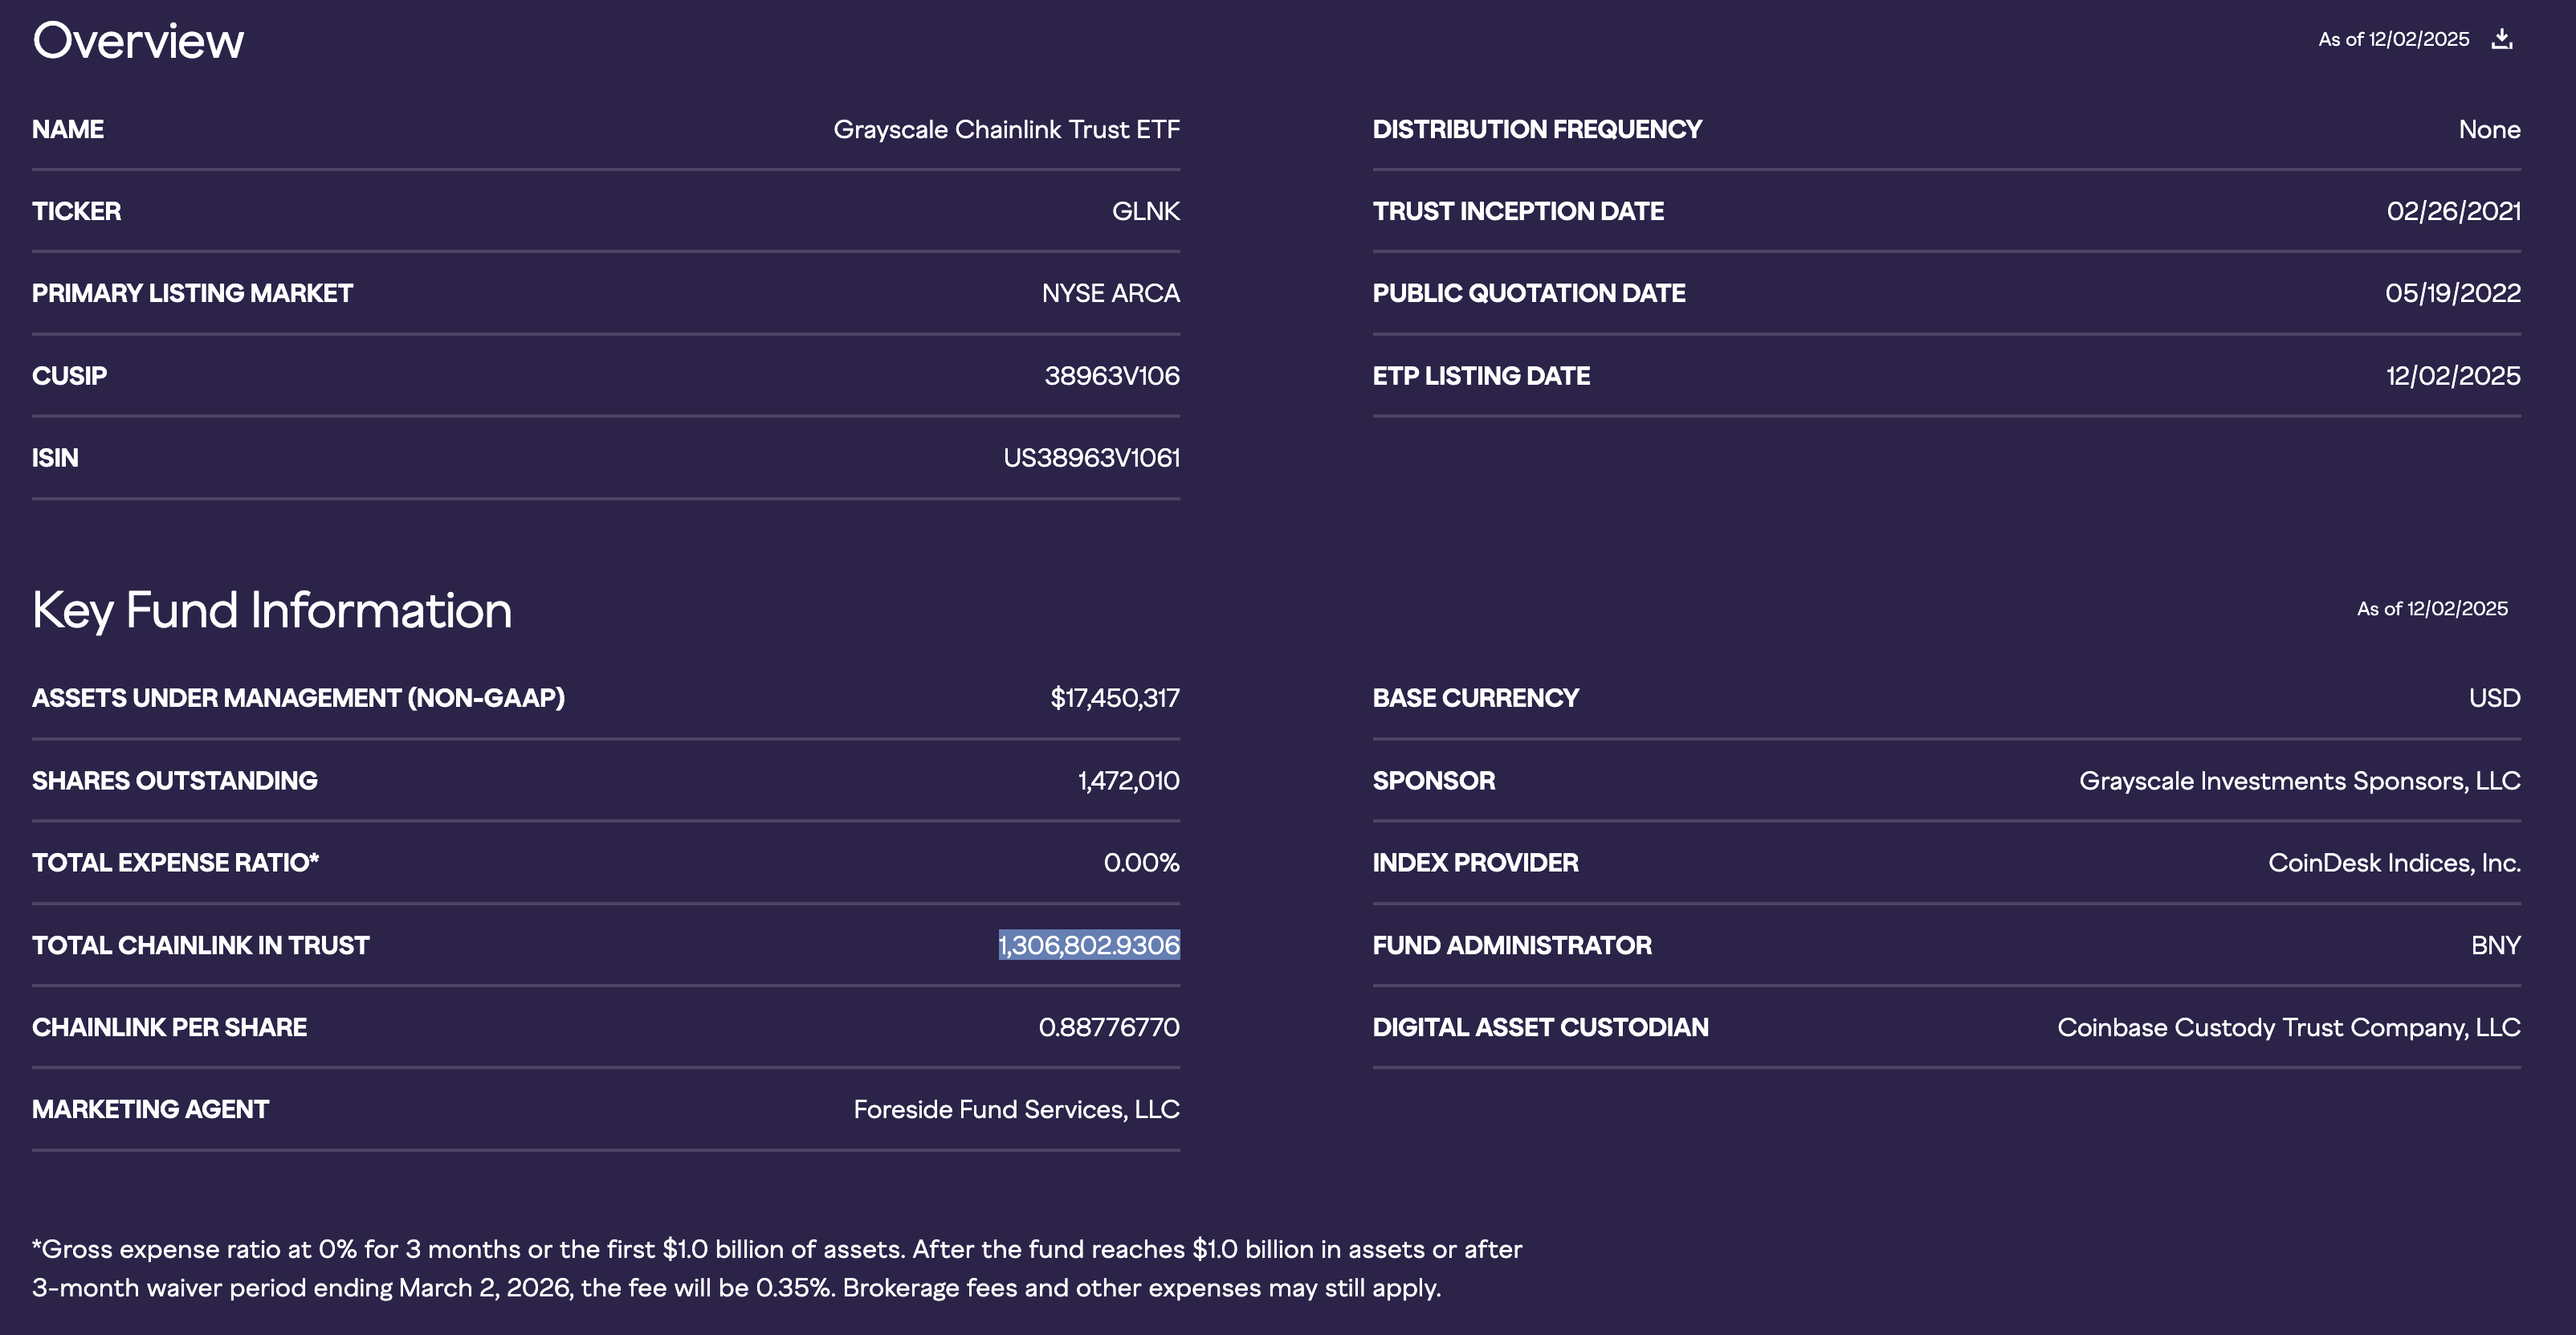
Chainlink demand revives with Grayscale’s LINK ETF launch
Chainlink has emerged as one of the top-performing assets in the broader cryptocurrency market over the last 24 hours amid the launch of the Grayscale Chainlink Trust ETF (GLINK) on Tuesday. According to Sosovalue, Tuesday's trading volume was $13.81 million, while the official daily flow data has not been released by press time.
Still, the official Grayscale data shows holding 1.30 million LINK tokens as of Wednesday. If the GLINK ETF experiences a steady inflow phase similar to the Solana ETFs, it could support a rally in LINK.
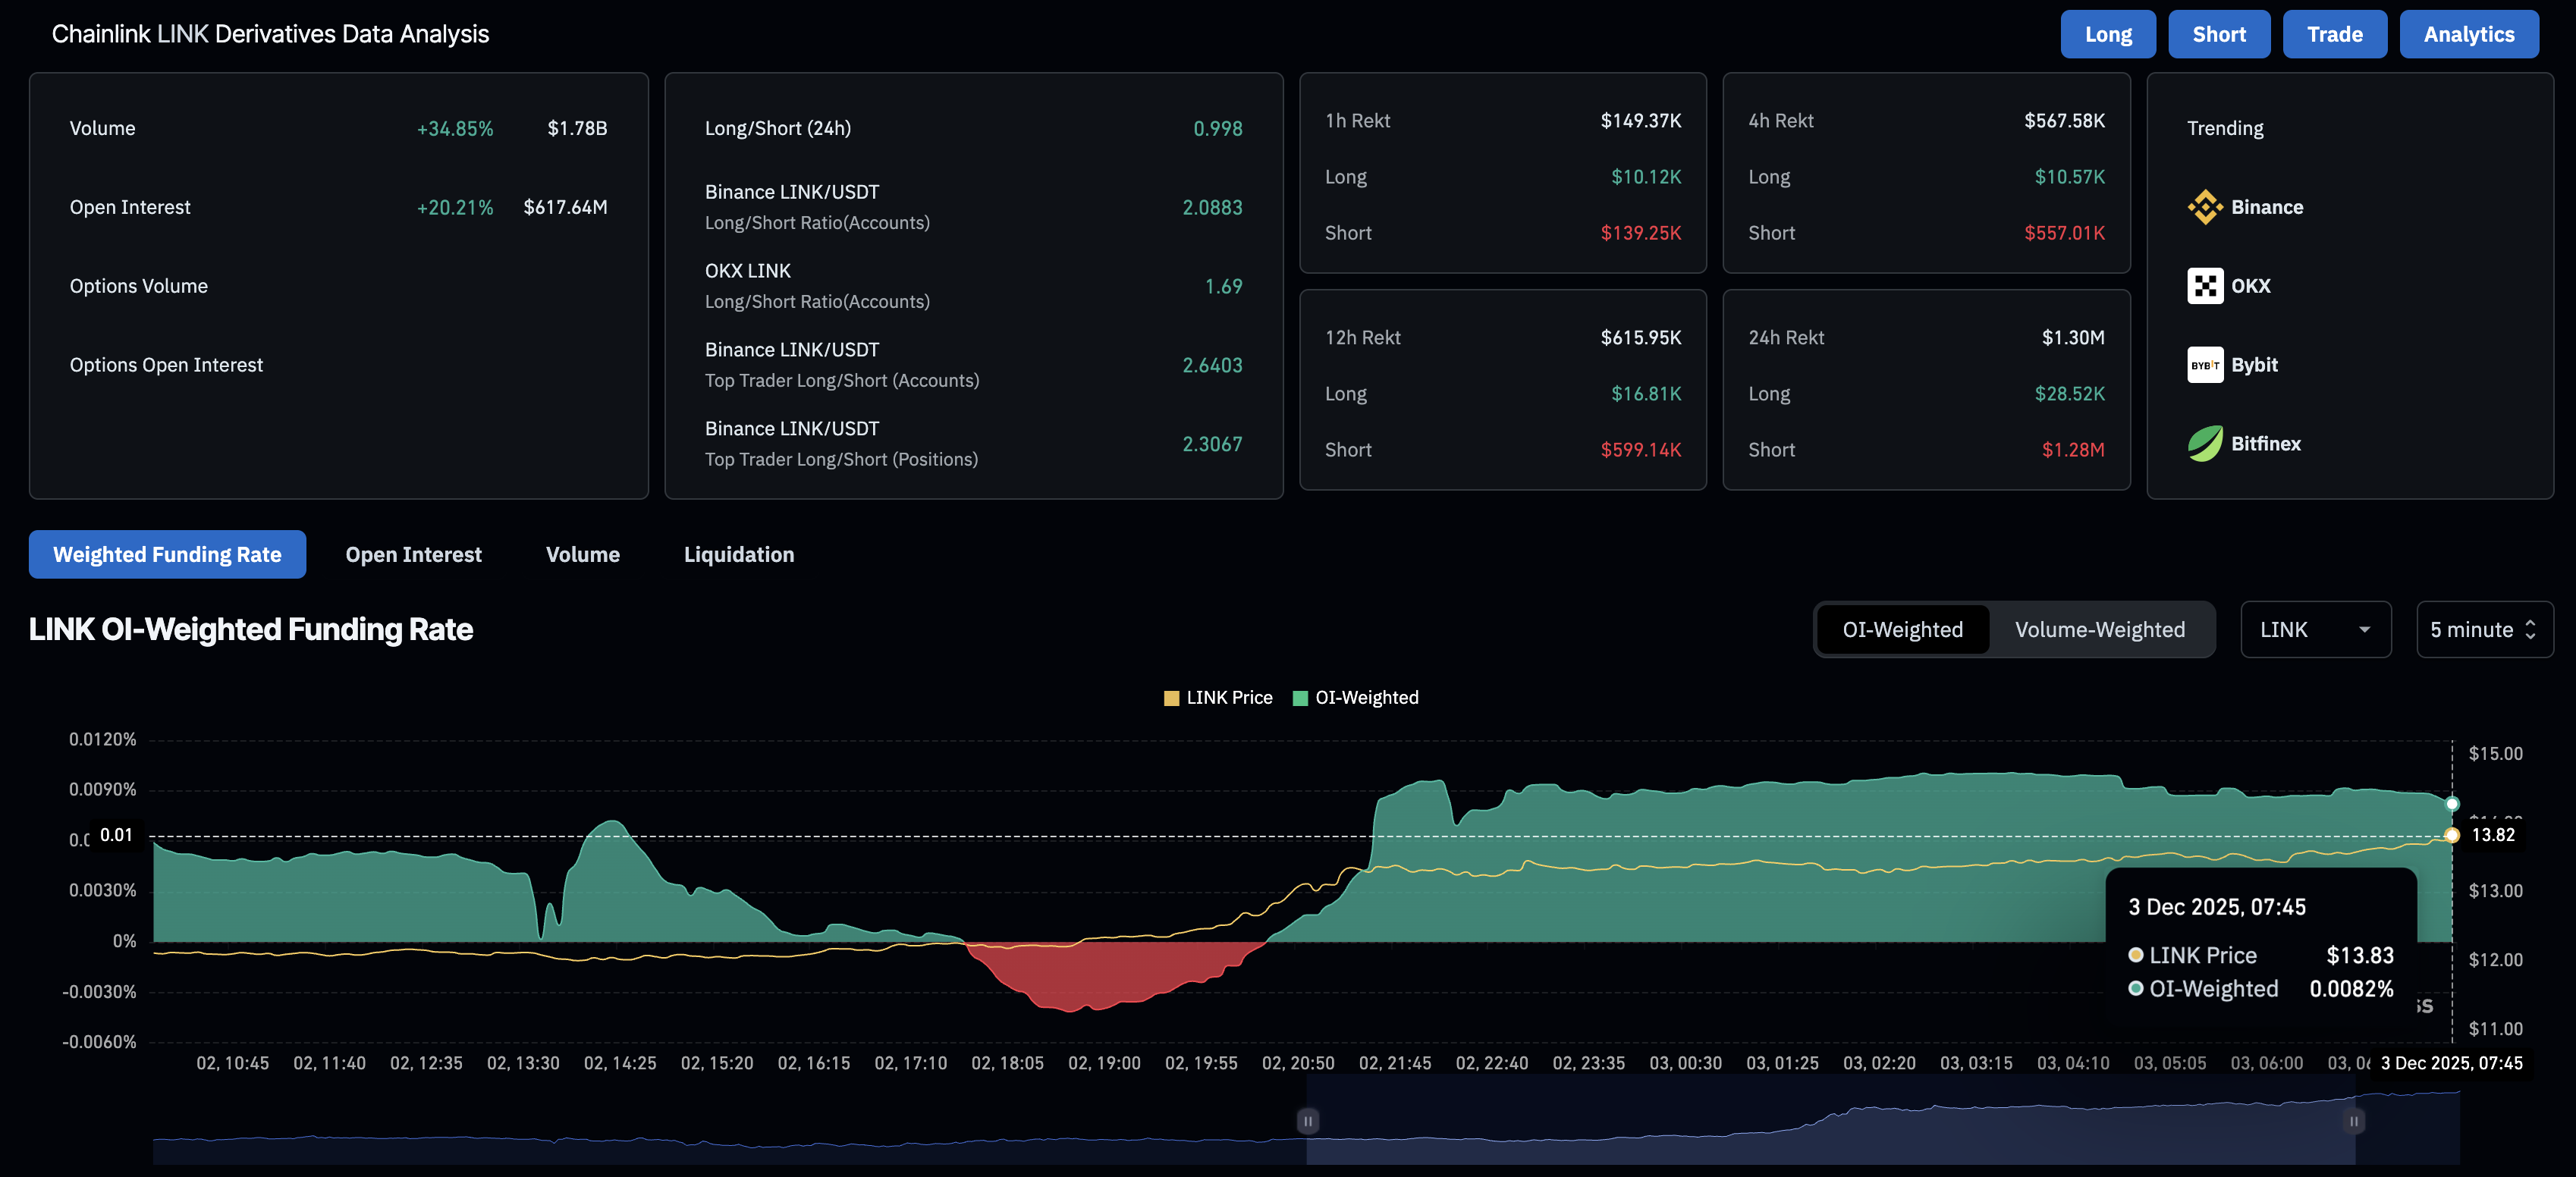
The Chainlink derivatives market has also experienced a surge in retail demand. CoinGlass data shows that LINK futures Open Interest (OI) stands at $617.64 million, up 20.21% in the last 24 hours, indicating a positional buildup by bulls.
Additionally, the LINK OI-weighted funding rate of 0.0082% reflects strong confidence. Bulls pay the positive funding rates as a premium to hold long positions, which, near 0.010% typically shows intense conviction.
Chainlink inches closer to signaling fresh bullish trend
Chainlink marks its second consecutive day of recovery. Still, LINK is trading below its 50-day and 200-day Exponential Moving Averages (EMA) at $15.33 and $17.51, respectively, indicating an uphill battle for bulls.
The oracle token is approaching the Supertrend indicator at $14.96, which could add to the bullish thesis if it closes decisively above this level. Apart from the moving averages, the October 20 and October 7 highs at $19.19 and $23.73 could also serve as resistance levels.
The Relative Strength Index (RSI) is at 53 on the daily chart following a V-shaped recovery that led the indicator to cross above the halfway line, indicating a boost in buying pressure. The Moving Average Convergence Divergence (MACD) indicator shows increasing bullish momentum as the average lines continue to rise towards the zero line.
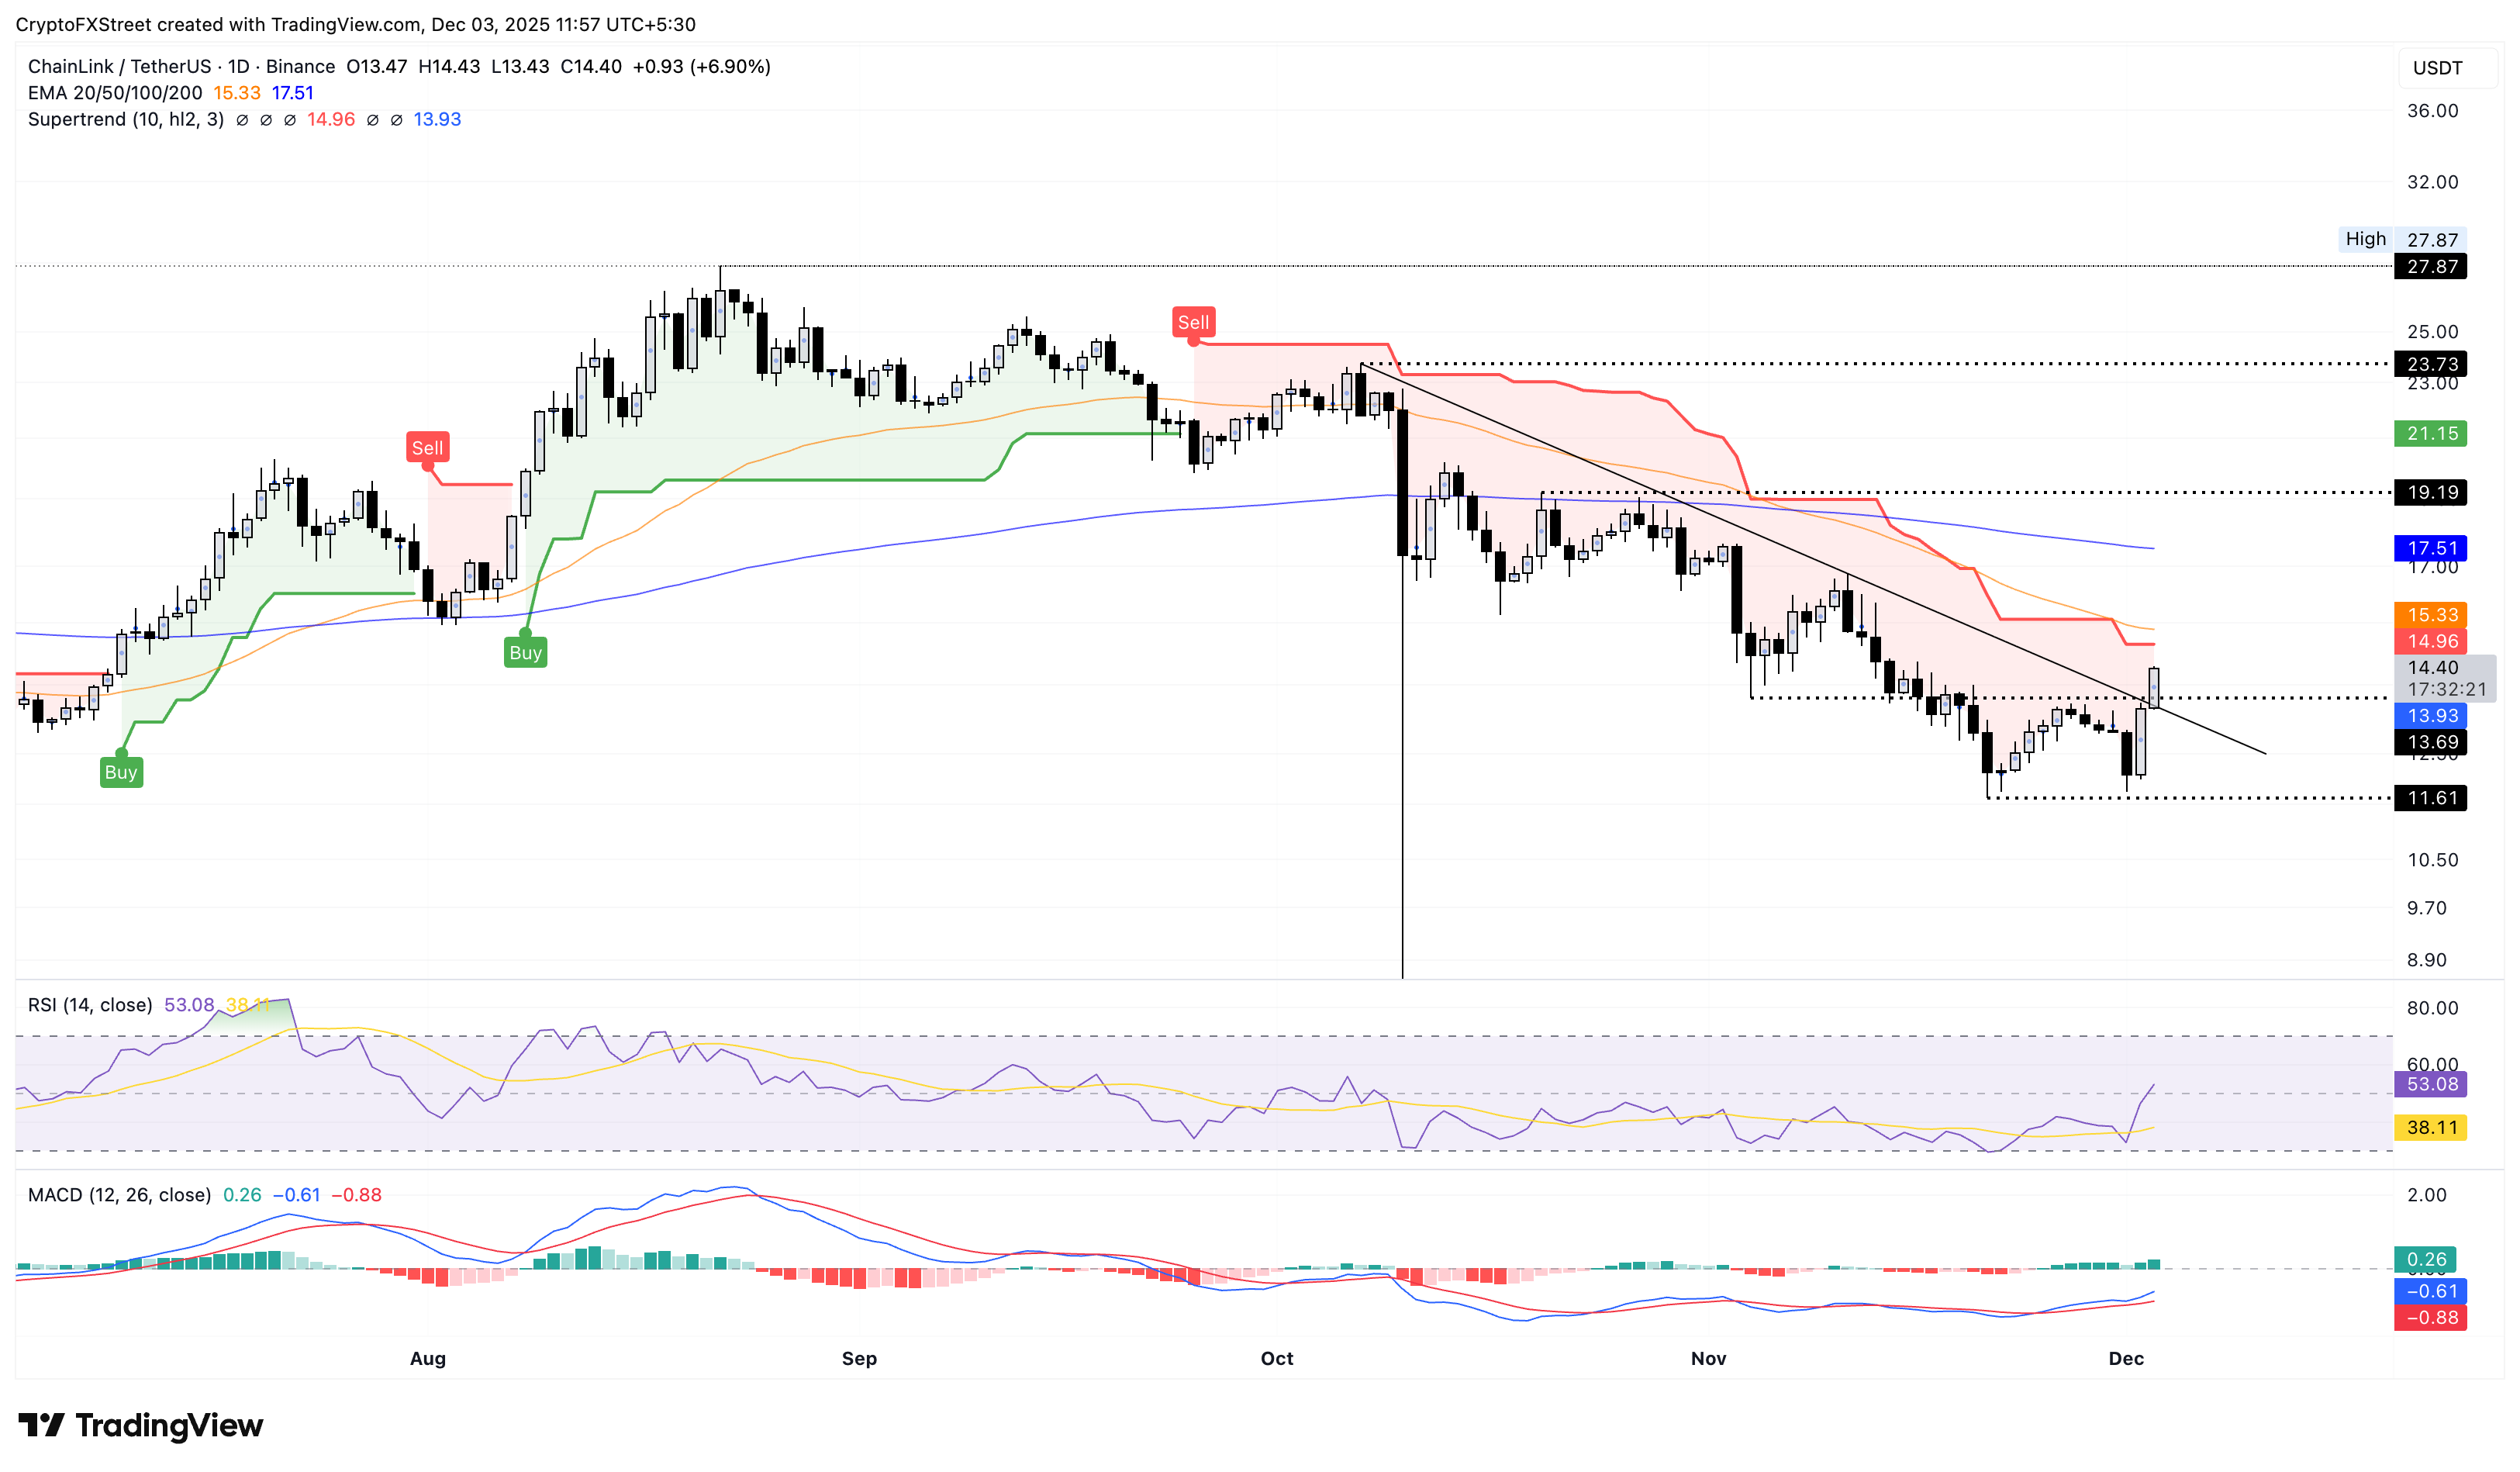
If LINK fails to hold a daily close above the November 4 low at $13.69, it could resume the decline to the November 21 low at $11.61.

超過一百萬用戶依賴 FXStreet 獲取即時市場數據、圖表工具、專家洞見與外匯新聞。其全面的經濟日曆與教育網路研討會協助交易者保持資訊領先、做出審慎決策。FXStreet 擁有約 60 人的團隊,分布於巴塞隆納總部及全球各地。
閱讀更多


