
Trade The World
Chiliz Price Forecast: CHZ recovers amid whale accumulation
作者 Vishal Dixit
發布日期: 8 Jan 2026 | 修改日期: 8 Jan 2026


POPULAR ARTICLES

Chiliz (CHZ) ticks higher by over 3% at press time on Thursday after a two-day pullback, extending the prevailing upward trend. Demand for the CHZ token among large wallet investors, commonly referred to as whales, has increased this year.
- Chiliz recovers over 3% on Thursday, extending the prevailing uptrend and approaching a key resistance level.
- On-chain data shows increased buying from large-wallet investors, fueling the recent recovery.
- The upcoming FIFA 2026 World Cup could further fuel demand for the sport-focused blockchain ecosystem.
Chiliz (CHZ) ticks higher by over 3% at press time on Thursday after a two-day pullback, extending the prevailing upward trend. Demand for the CHZ token among large wallet investors, commonly referred to as whales, has increased this year. The technical outlook for Chiliz remains mixed as it approaches a key resistance level that has been capping the upside in January, following a 40% rise in December.
Whales' interest spikes ahead of the FIFA World Cup 2026
During the 2022 World Cup, the launch of multiple Fan tokens and official Non-Fungible Tokens (NFTs) expanded Chiliz’s ecosystem, boosting the value of its CHZ token. The sport-focused blockchain network regains strength as the FIFA World Cup returns to the US in June, potentially boosting US investors' participation in Chiliz’s ecosystem in the upcoming months.
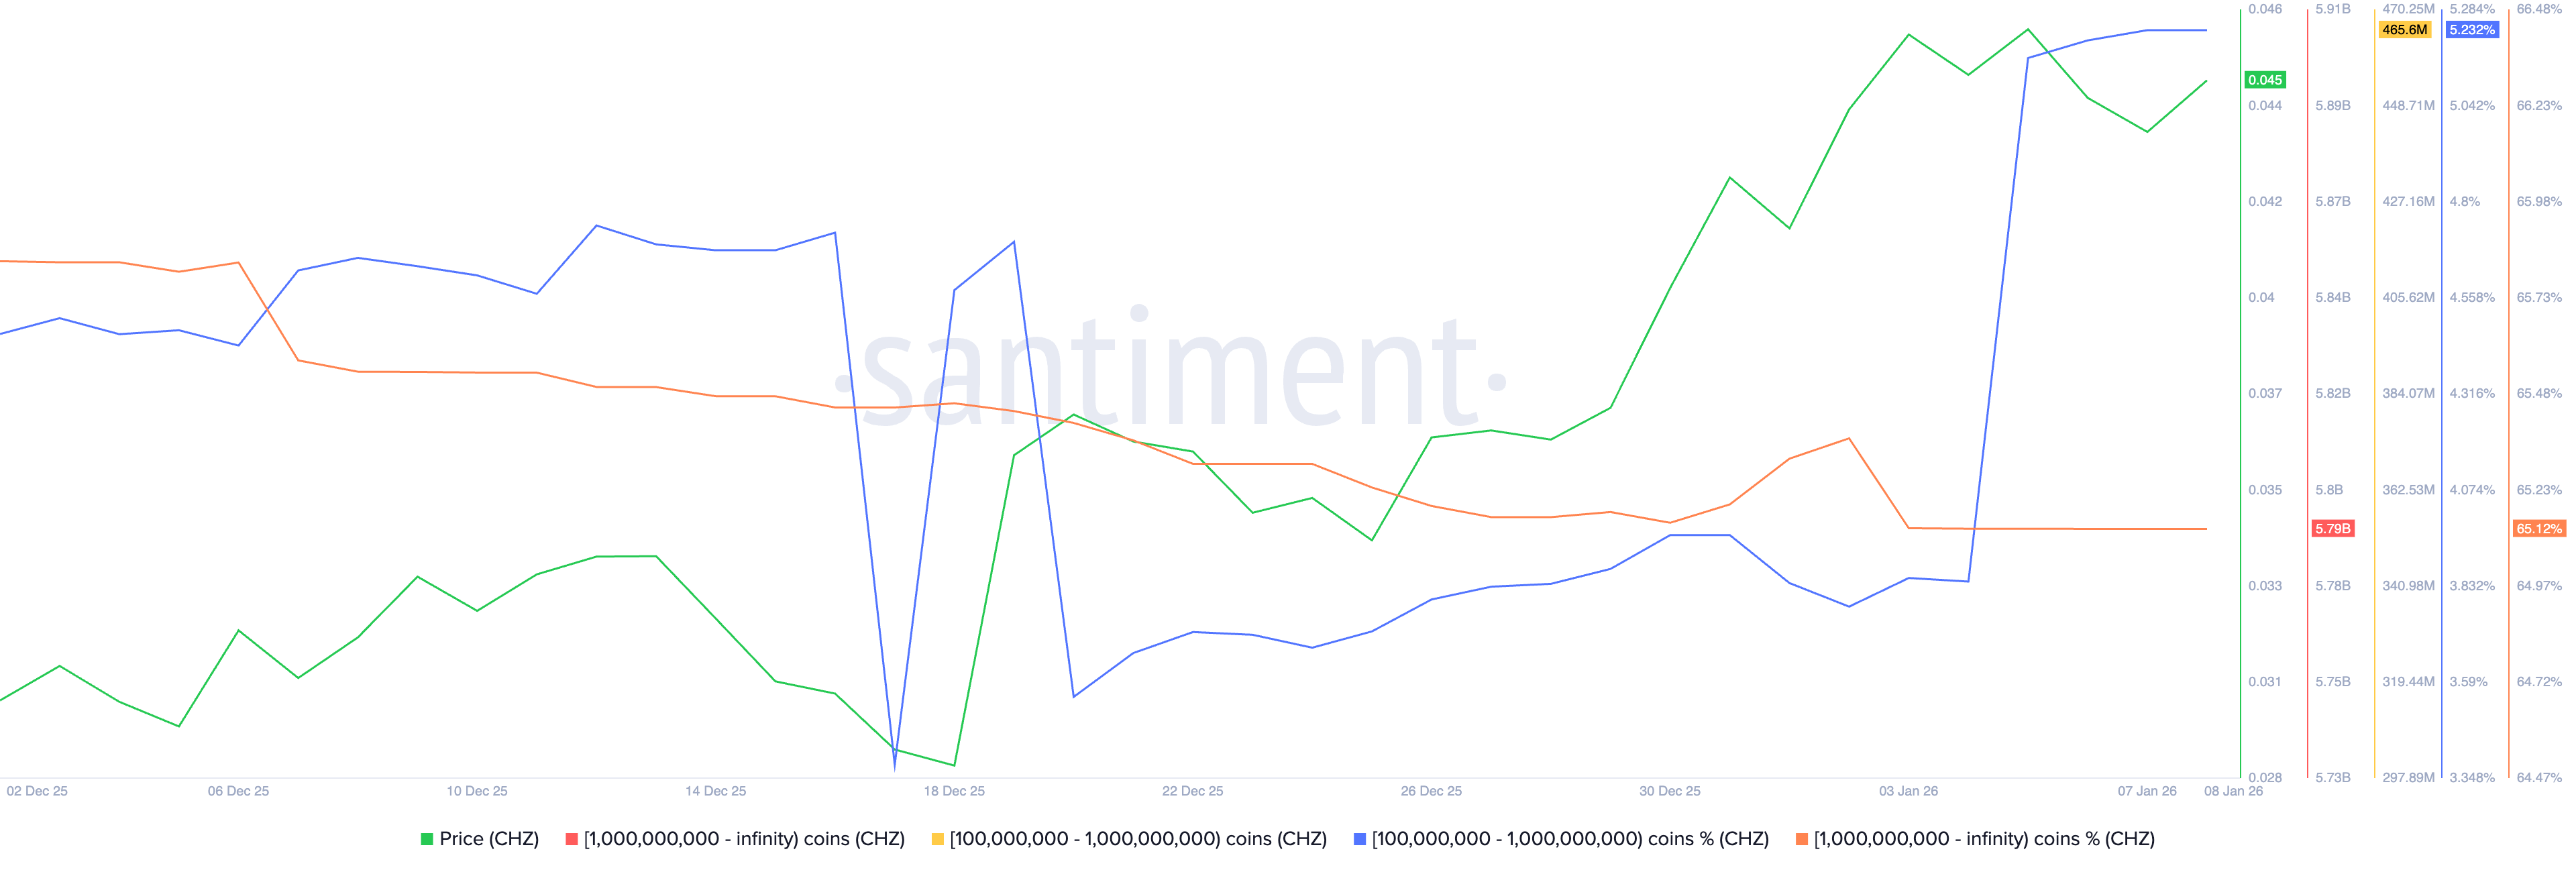
On-chain data shows that whales are accumulating CHZ tokens, overlooking the 48% decline last year, which marked the fourth consecutive bearish year. Investors with 100 million to 1 billion CHZ have increased exposure to 5.23% of the on-chain supply, from 3.84% on January 1. Meanwhile, the larger cohort with over 1 billion CHZ tokens steadies its exposure at 65.12%, a rather silent signal of confidence.
Chiliz recovery hits a crossroads below the $0.5000 psychological level
Chiliz approaches the $0.04635 resistance level, last tested on Monday, which has capped the price since late July. If CHZ exceeds $0.04635, it could target the $0.05000 psychological level.
Corroborating the upside potential, the 50-day Exponential Moving Average (EMA) crosses above the 100-day EMA, triggering a Golden Cross as the short-term recovery gathers strength.
However, the technical indicators on the daily chart suggest a weakening in CHZ recovery. The Relative Strength Index (RSI) is at 66 after exiting overbought conditions, suggesting fading bullish momentum. At the same time, the Moving Average Convergence Divergence (MACD) risks crossing below the signal line, which would trigger a sell signal.
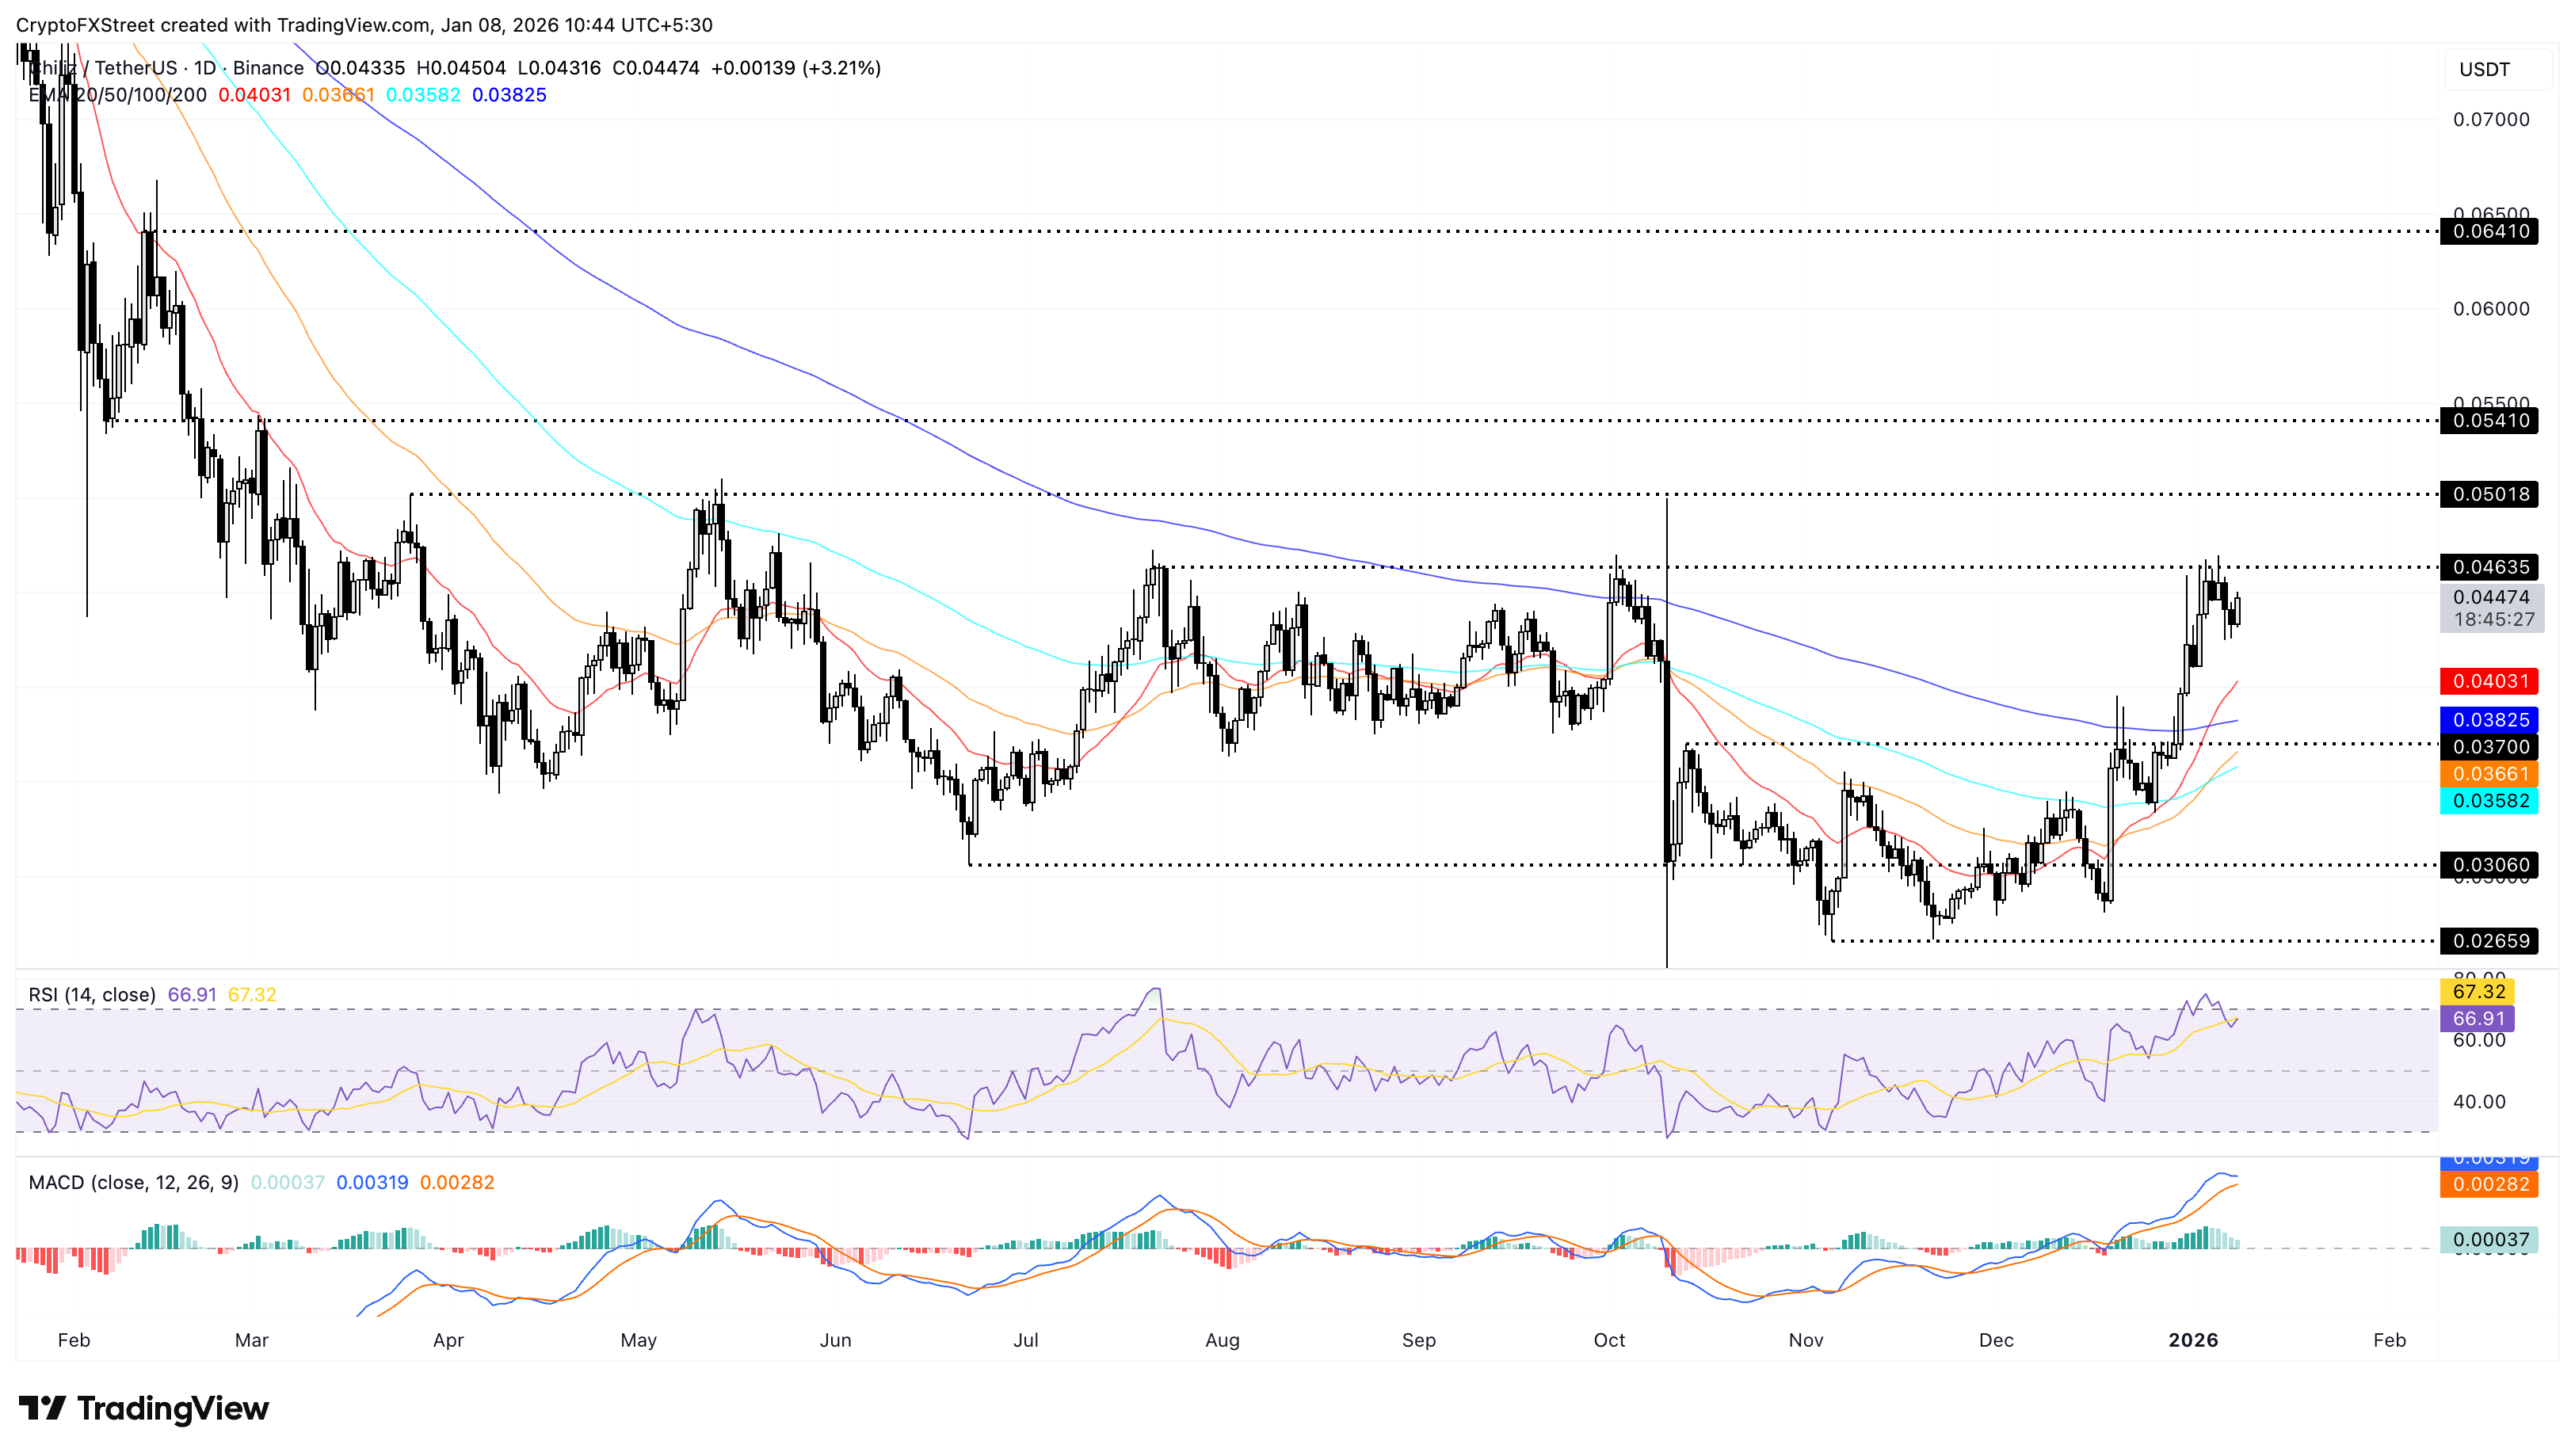
If CHZ reverses from $0.04635, the 20-day and 200-day EMAs at $0.04031 and $0.03825, respectively, could serve as dynamic support levels.

FXStreet
超過一百萬用戶依賴 FXStreet 獲取即時市場數據、圖表工具、專家洞見與外匯新聞。其全面的經濟日曆與教育網路研討會協助交易者保持資訊領先、做出審慎決策。FXStreet 擁有約 60 人的團隊,分布於巴塞隆納總部及全球各地。
Read More


