
Cosmos Price Forecast: ATOM rebounds on rising on-chain, retail demand
作者 Vishal Dixit
發布日期: 20 Jan 2026 | 修改日期: 20 Jan 2026


熱門文章

Cosmos (ATOM) trades near $2.50 at the time of writing on Tuesday, holding above the 20-day Exponential Moving Average (EMA). A steady rise in capital deposited on the network and ATOM futures Open Interest suggests that on-chain demand is consistently increasing with retail activity.
- ATOM extends recovery on Tuesday after a bullish pinbar candlestick formed near the 20-day EMA the previous day.
- Data shows the total chain value on Cosmos is $1.24 billion, which is consistent with 99.5% of ATOM.
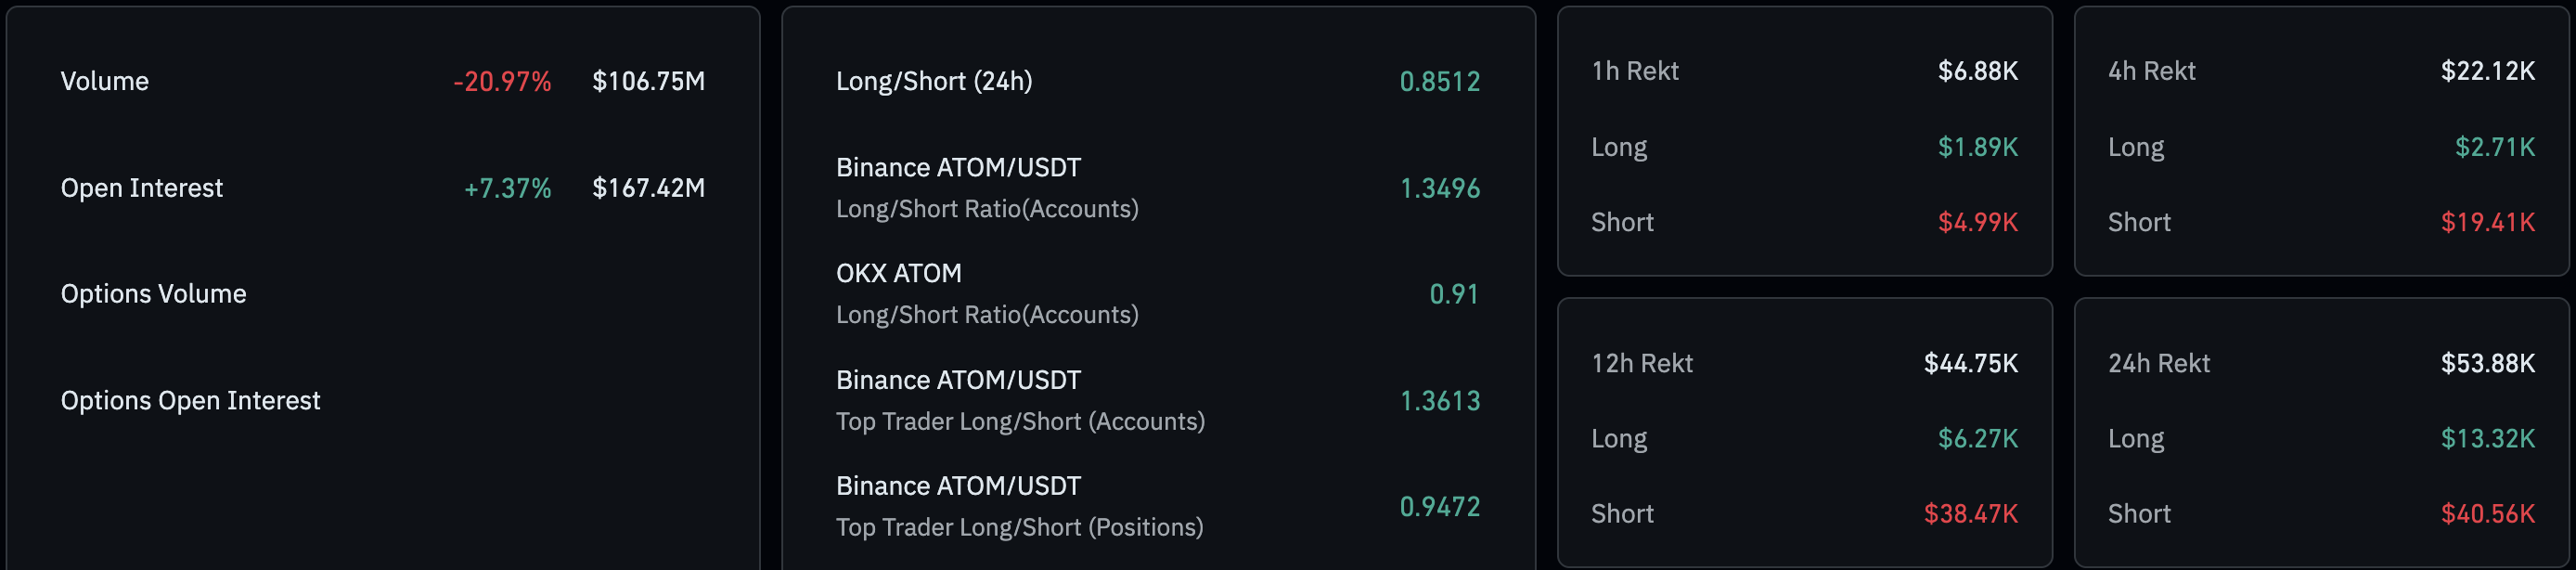
- Derivatives data suggests renewed interest among retail traders as ATOM futures Open Interest rises.
Cosmos (ATOM) trades near $2.50 at the time of writing on Tuesday, holding above the 20-day Exponential Moving Average (EMA). A steady rise in capital deposited on the network and ATOM futures Open Interest suggests that on-chain demand is consistently increasing with retail activity. The technical outlook for ATOM remains mixed, as indicators suggest a downside bias.
Cosmos regains on-chain, retail demand
According to Mintscan data, the Total Chain Value of Cosmos stands at $1.24 billion on Monday, up from $938.50 million on December 31. Over 99% of the value is derived from ATOM, while Inter-Blockchain Communication (IBC) accounts for $13.71 million of outflow from the blockchain.
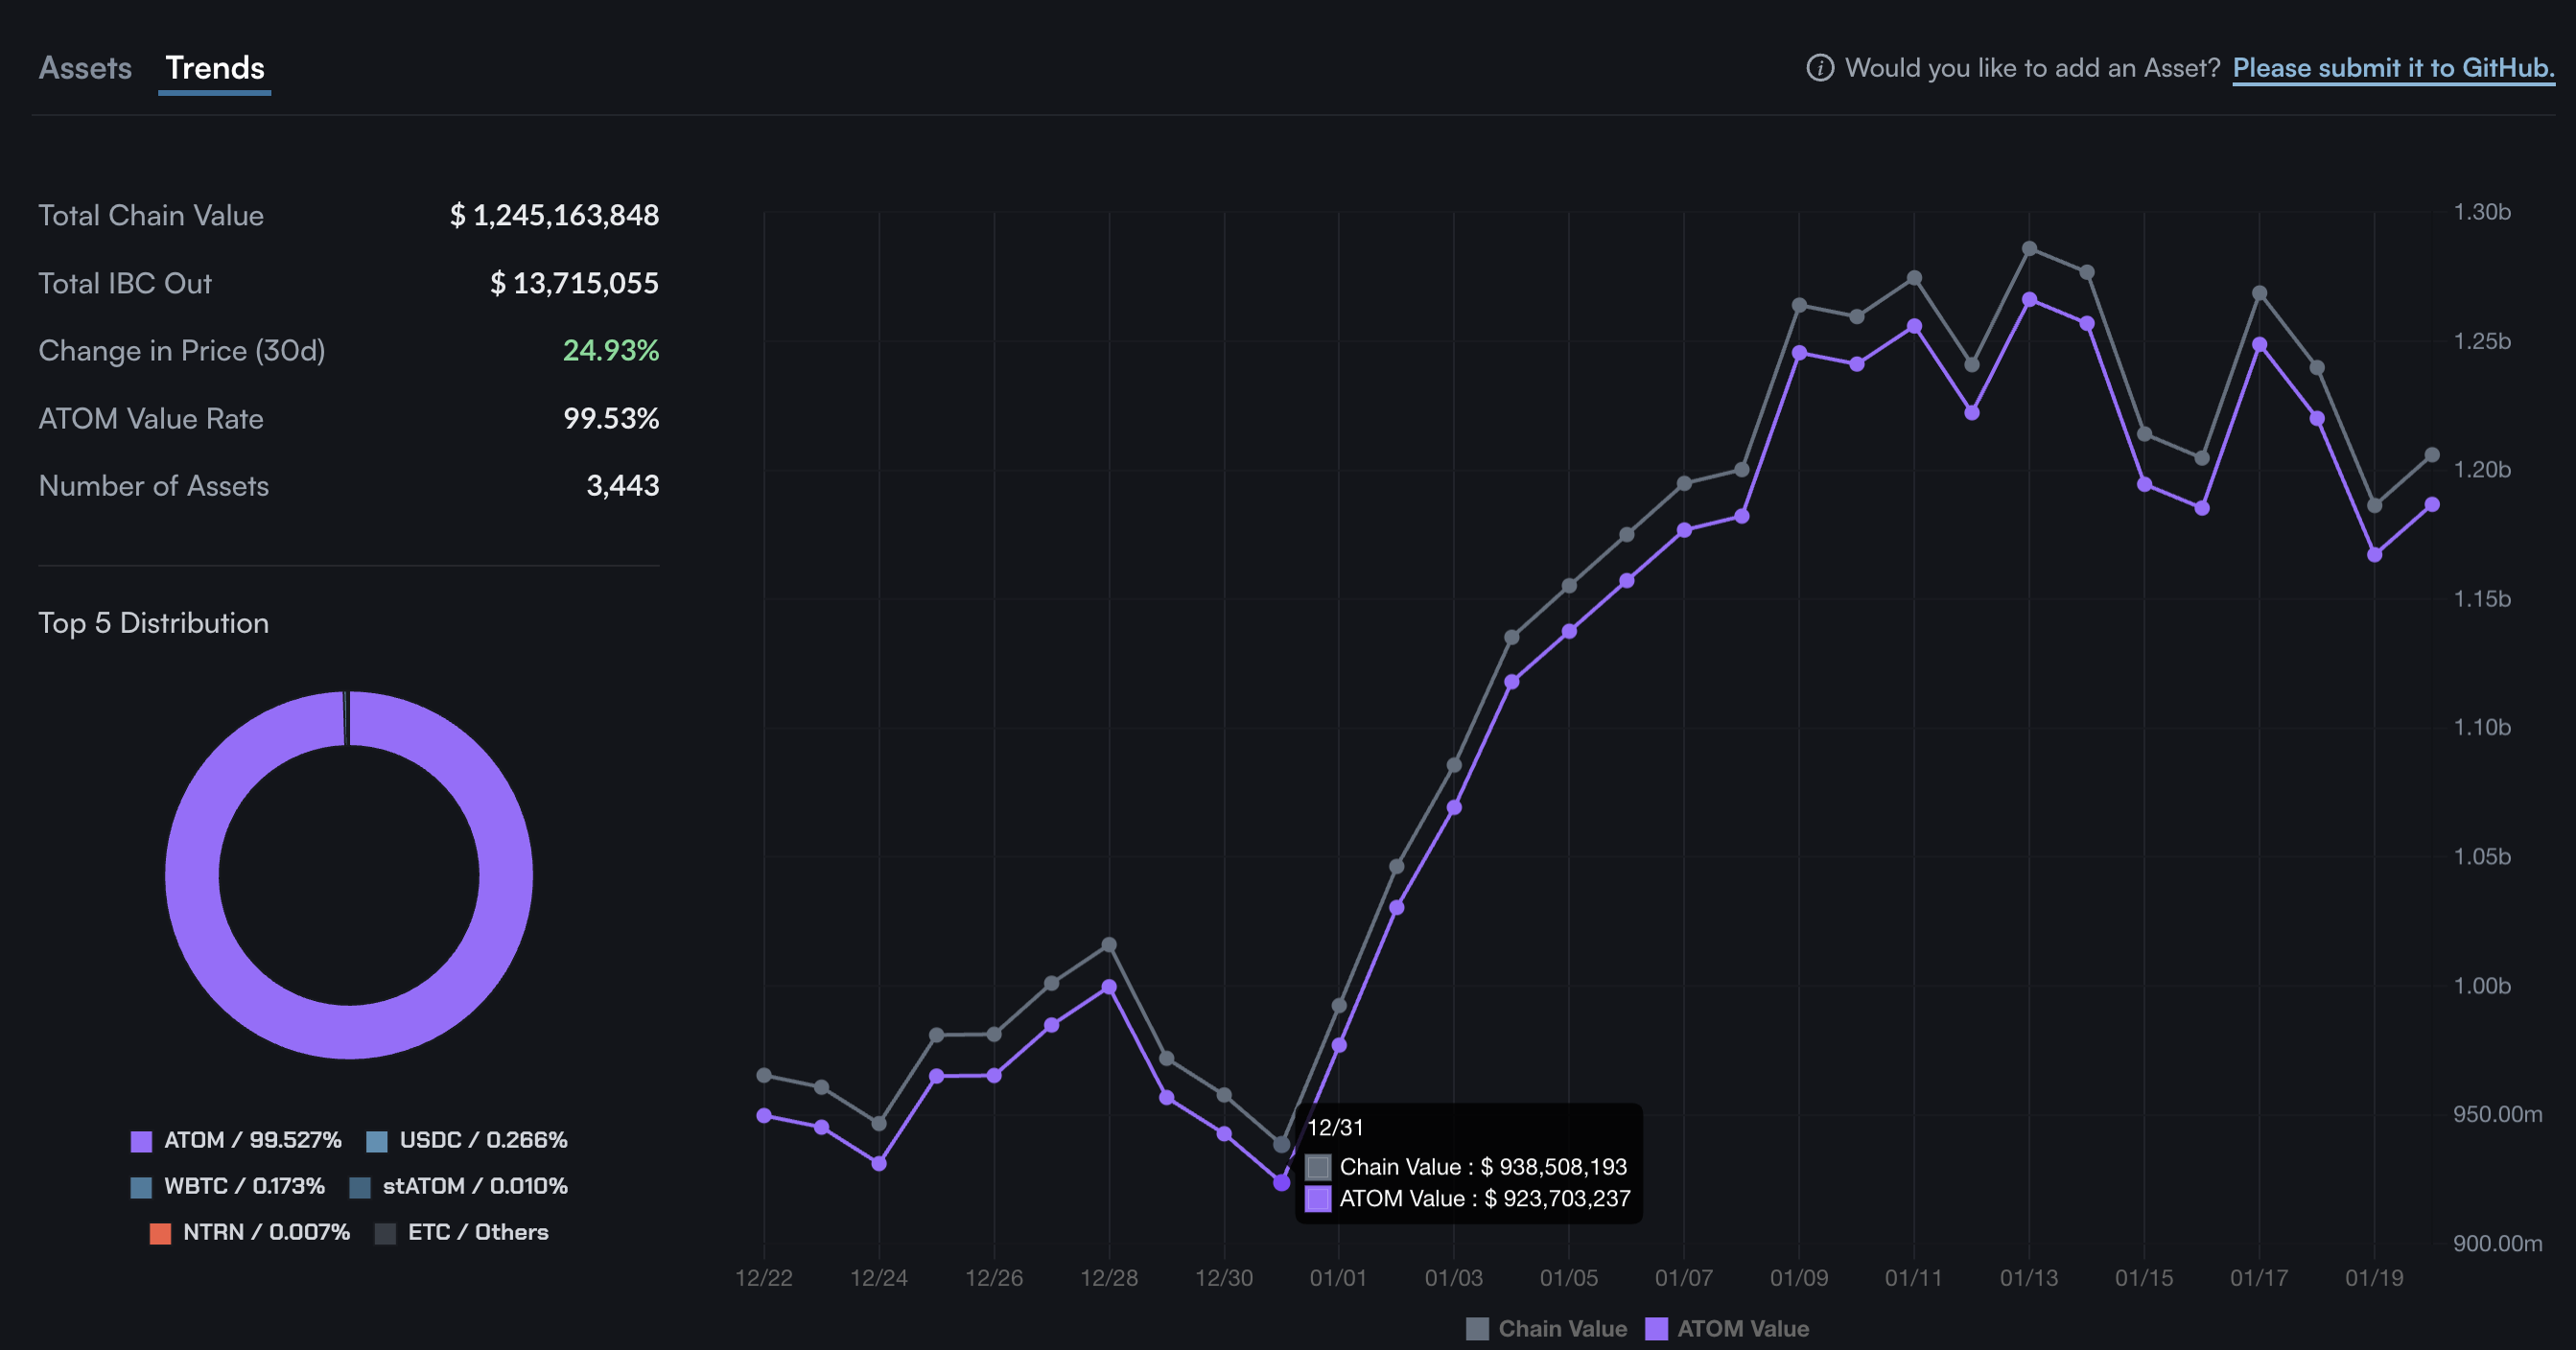
On the derivatives side, CoinGlass data shows ATOM futures Open Interest (OI) is up 7.37% over the last 24 hours, to $167.42 million, indicating a capital influx consistent with renewed on-chain demand. A steady rise in chain value and OI could shift the bias upside for ATOM.
Technical outlook: Will Cosmos extend recovery?
Cosmos holds above the 20-day EMA at $2.43 and the 50-day EMA at $2.40, with both averages edging higher and supporting the short-term bid. Still, ATOM remains well beneath a falling 200-day EMA at $3.24, reflecting a broader downtrend.
The Moving Average Convergence Divergence (MACD) indicator crossed below the red signal line on the daily chart, and the histogram is extending to the downside, suggesting a rise in bearish momentum. If the histogram returns to positive, it would improve bullish conviction, while sustained weakness could reinforce the downside bias.
The Relative Strength Index (RSI) is at 57 on the same timeframe, confirming a slightly bullish momentum.
The October 11 low at $2.85 could serve as an immediate target for a potential rebound in ATOM as a support-turned-resistance.
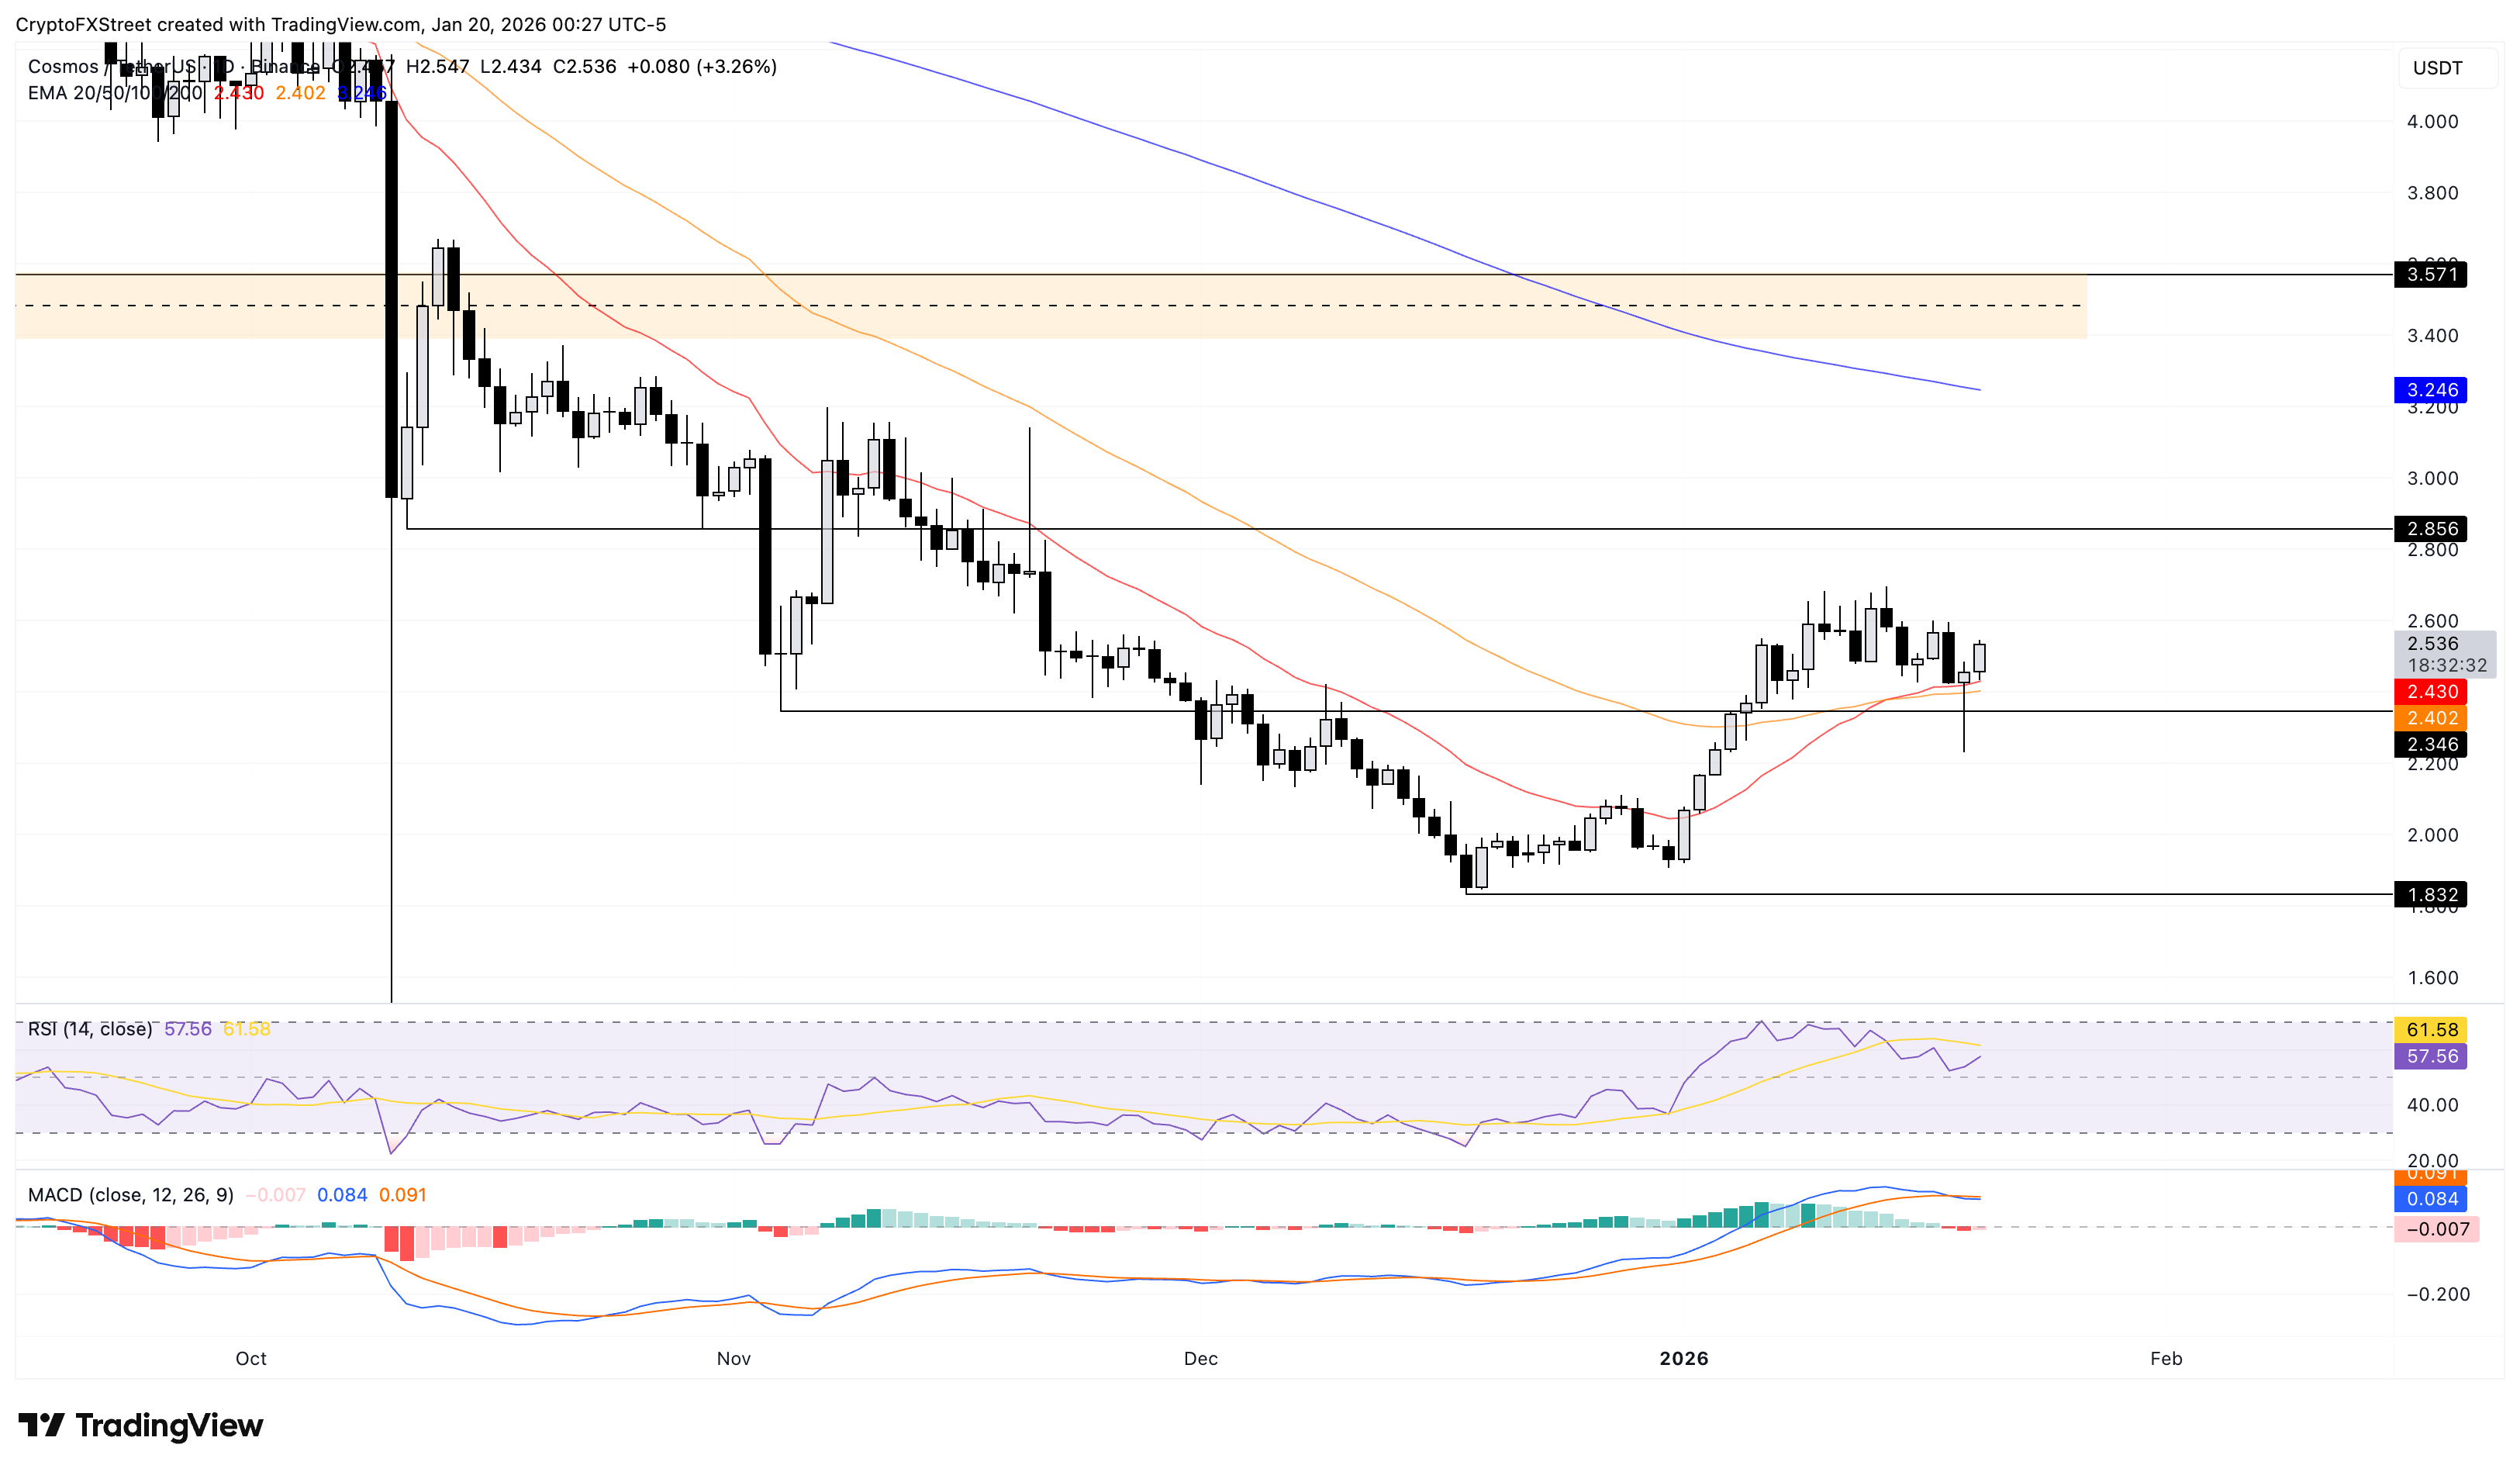
On the contrary, if ATOM marks a daily close below the November 4 low at $2.34, it would likely open the door to the $2.00 psychological support level.
(The technical analysis of this story was written with the help of an AI tool.)

超過一百萬用戶依賴 FXStreet 獲取即時市場數據、圖表工具、專家洞見與外匯新聞。其全面的經濟日曆與教育網路研討會協助交易者保持資訊領先、做出審慎決策。FXStreet 擁有約 60 人的團隊,分布於巴塞隆納總部及全球各地。
閱讀更多


